Dell XPS 17 (9730) Review: A High-Performance, Gorgeous Laptop

Now it's time to see how the Dell XPS 17 9730 performs. Our review unit came to us running Windows 11 Home version 22H2. Before running any of our benchmarks, we apply all of the latest Windows and driver updates to the system we are testing. This laptop was pretty up-to-date as far as Windows goes, but did have one firmware/BIOS update that needed to be installed along with a few driver updates. Other than applying any available Windows updates and drivers, we run all of our tests with out-of-the-box settings to give prospective buyers an idea of what to expect.
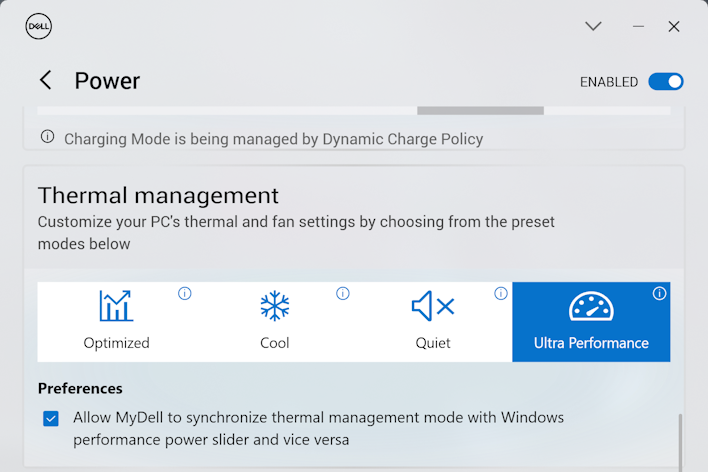
One exception was that we utilized the available thermal profiles within the My Dell app, which can have an impact on performance if you check the box to allow thermal management to sync with the Windows efficiency profiles. Optimized in My Dell also selects the Balanced Windows 11 power profile, while Ultra Performance kicks the laptop into Best Performance mode. We started off running all of our tests in Optimized mode as well as Ultra Performance. However, with rare exception, the added noise of Ultra Performance didn't really do much to help the notebook's performance. For clarity's sake we aren't reporting every Ultra Performance number here, but we did select several that illustrate the point.
ATTO Disk Benchmark
The ATTO disk benchmark is a fairly quick and simple test which measures read/write bandwidth and IOPS across a range of different data sizes. While we don't typically compare these results across multiple machines, it's useful to gauge whether a particular notebook's storage subsystem is up to snuff.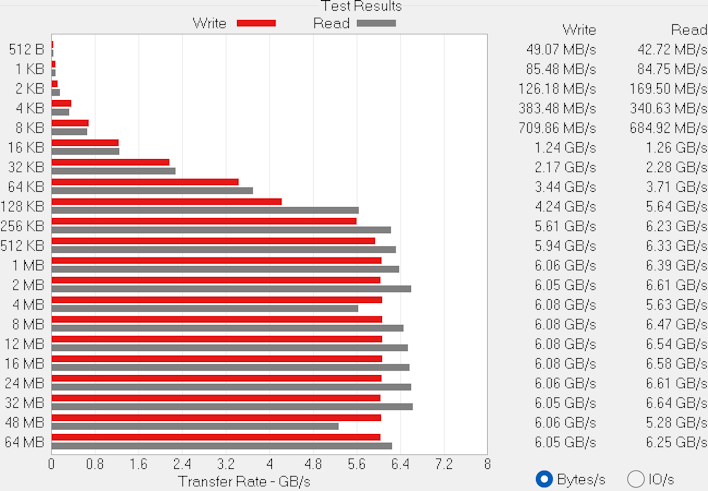
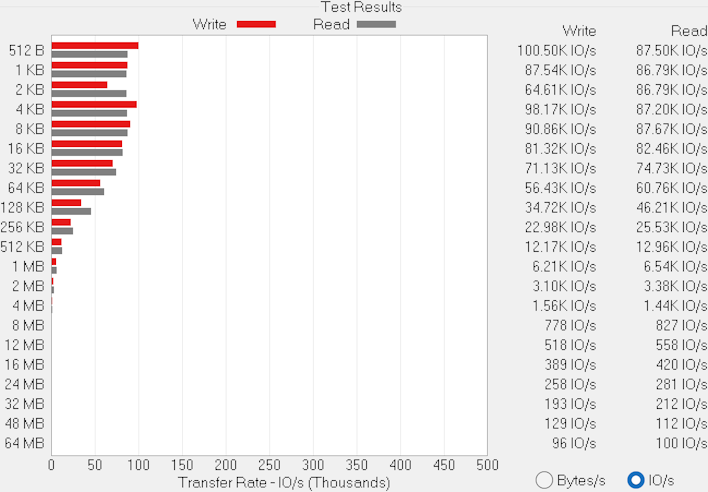
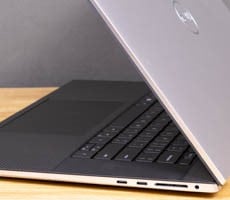
The Dell XPS 17 9730 configuration we tested has the same speedy SK Hynix PC801 SSD as the XPS 15 (9530). Because of that, the performance is still super quick - over 6 GB per second in reads, up over 5 GB per second in writes, and small IO transactions hitting 100,000 IOPS. There's a second M.2 slot in this laptop, which we'll spot in a moment, so adding additional storage should be a cinch.
Speedometer 2.0 Browser Benchmark
We use BrowserBench.org's Speedometer test to gauge our web experiences, which takes a holistic look at web application performance. This test automatically loads and runs several sample web apps from ToDoMVC.com using the most popular web development frameworks around, including React, Angular, Ember.js, and even vanilla JavaScript. This test is a better example of how systems cope with real web applications, as opposed to a pure JavaScript compute test like JetStream. All tests were performed using the latest version of Chrome.
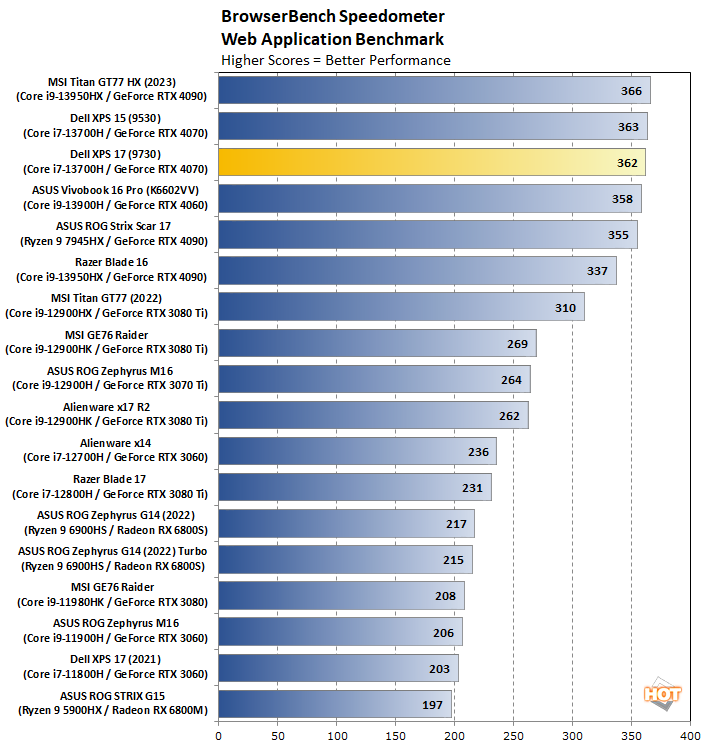
Most modern laptops excel in this benchmark, but browsing the web is such an important task that it bears confirmation. And just like the XPS 15 before it, the XPS 17 is extremely fast, nearly matching the Core i9-13950HX in the MSI Titan GT77 HX.
Cinebench R23 Rendering Benchmark
This is the latest 3D rendering benchmark from Maxon, based on the Cinema 4D R23 rendering engine. We tested both single-threaded and multi-threaded tests on all of the notebooks represented here...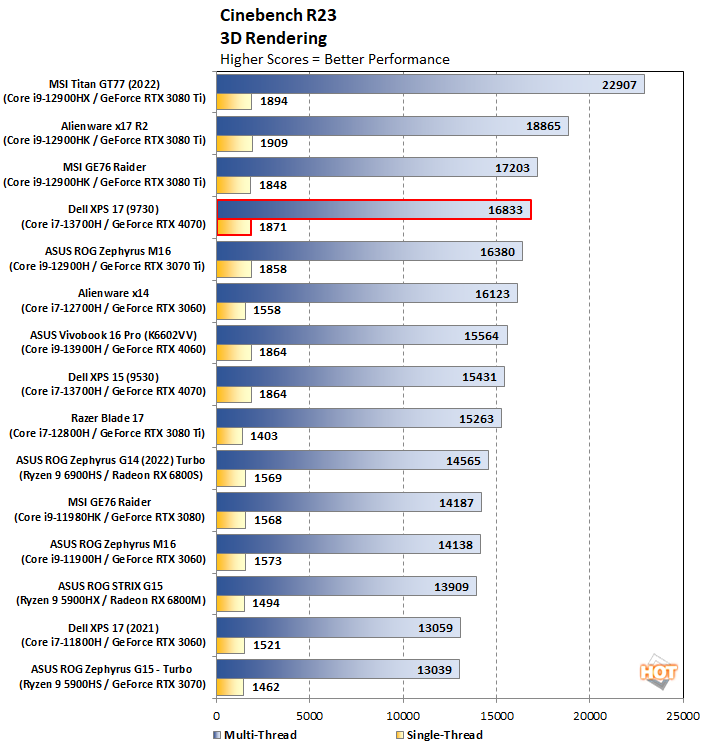
Step for step, line for line the XPS 17 9730 has so far stuck close to its smaller sibling. It's also stuck close to just about every 12th-generation and 13th-generation Core notebook on our chart. To pull significantly ahead, a notebook needs more cores than this one, so the first really significant step forward comes from the Alienware x17 R2. It's going to be tough for notebooks to distinguish themselves in these purely CPU-bound tasks.
Geekbench 5 Benchmarks
Geekbench is a cross-platform benchmark that simulates real world processing workloads in image processing and particle physics scenarios. We tested the notebooks featured here in Geekbench's single and multi-core workloads. It measures single-threaded performance allowing a single core to stretch its legs, and multi-threaded throughput to put all cores under a heavy load.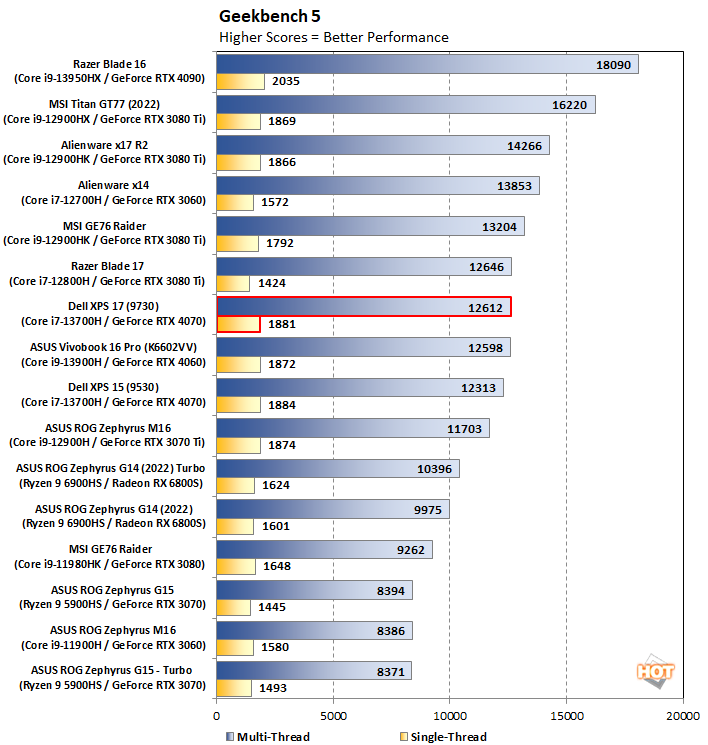
The XPS 17 is again clustered with a whole host of other notebooks in this test, including the Razer Blade 17 as well as the XPS 15 (9530). Its single-threaded performance is right on par with other notebooks in this class, as well as the multi-threaded tests.
PCMark 10 Whole System Benchmarks
PCMark 10 uses a mix of real-world applications and simulated workloads to establish how well a given system performs productivity tasks, including image and video editing, web browsing, and OpenOffice document editing. While these scores appear to be all over the place, the systems are sorted by their overall PCMark score, which is the third (gray) bar in each cluster.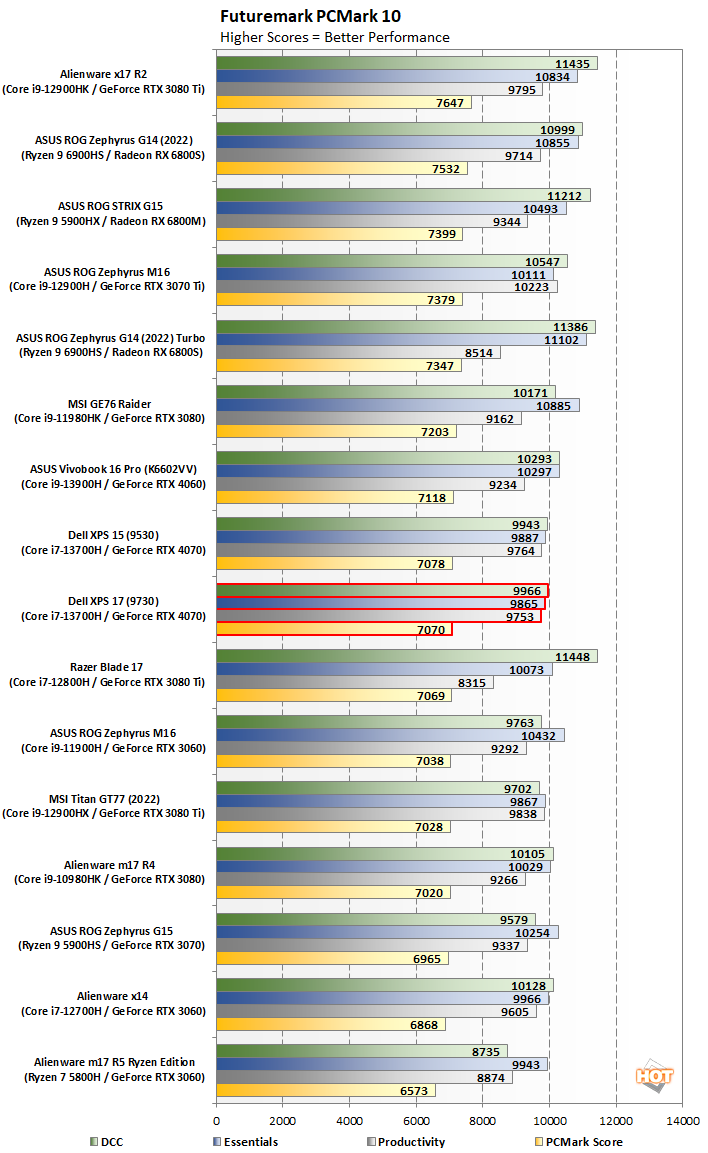
The XPS 17 is quite literally neck-and-neck with the XPS 15 here, once again owing to the close relation these two notebooks bear. What's most interesting is how our three selected subtests cluster together, all pushing up against but not quite reaching the 10,000 mark. Most of the notebooks that place higher have, interestingly, AMD CPUs like the ASUS ROG Zephyrus G14, and do so on the weight of their Digital Content Creation and Productivity scores. Still, the XPS 17 9730 is no slouch.
Let's look at what that 60 Watt GeForce RTX 4070 can do for us...
3DMark Graphics And GPU Tests
3DMark has several different graphics tests which focus on different types of systems. We start with Time Spy, which was 3DMark's headline benchmark until just recently. This test presents a pretty significant challenge for the system's CPU and GPU using the DirectX 12 API...
Now we're starting to see some separation between the two XPS notebooks. The extra 50% power limit on the larger XPS 17 affords it about 20% on its smaller sibling, at least in Optimized mode. This is one instance where the Ultra Performance mode was deadlocked with Optimized, and afforded no extra performance. We said at the start to expect this, and we say again to expect more of it.
Next up, let's take a look at the Extreme preset for the punishing 3DMark Fire Strike test. This DirectX 11 test has been around for a while, but it's still pretty challenging for mobile GPUs.
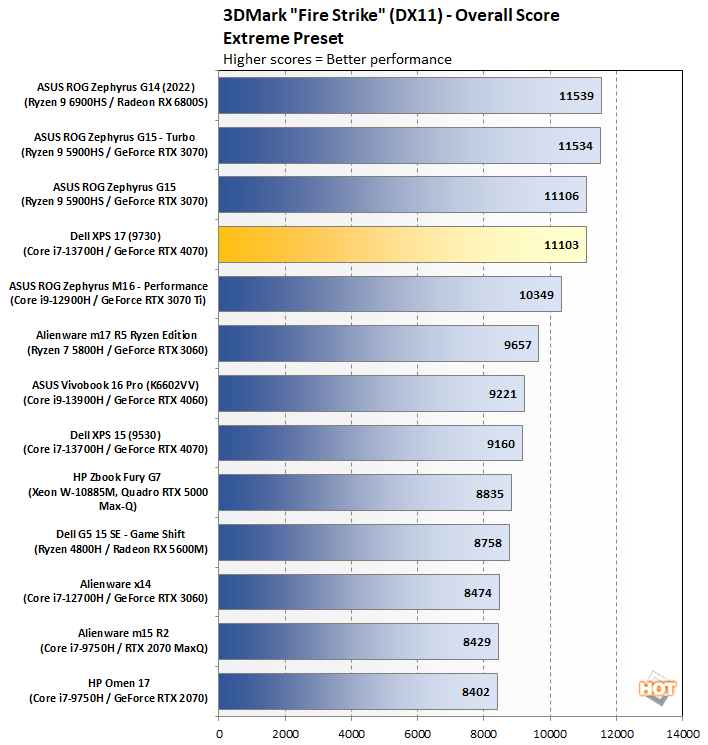
This older DX11 test is still a bit of a torture test for modern platforms. The XPS 17 is again about 20% faster in this benchmark than the smaller XPS 15 notebook. While it might seem unimpressive that this notebook only ties with the ASUS ROG Zephyrus G15, remember that the GeForce RTX 3070 in that notebook has an 80 Watt TGP compared to the 60 Watts afforded to the XPS 17. This is a power efficiency triumph for Ada Lovelace in our eyes.
Lastly, the Port Royal test uses DirectX Ray Tracing (DXR) along with traditional rasterization techniques to illuminate a scene...
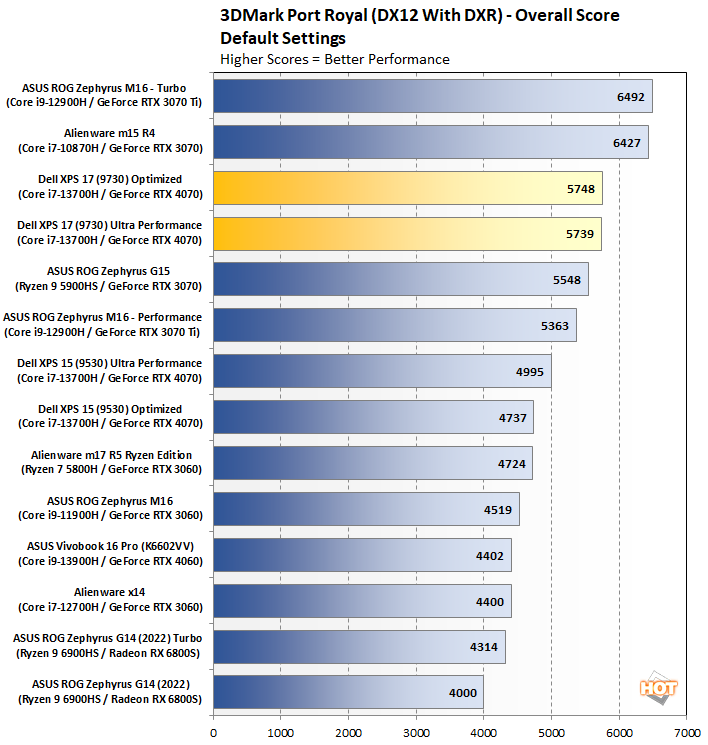
The RTX 4070's DXR performance here has about a 16% uplift compared to the 40 Watt version in the XPS 15. It does, however, fall short of the 125 Watt solution found in the Alienware m15 R4 by a bit, but that's more than twice the power draw to eke out a small victory. What really matters is actual games, and speaking of which...
Middle Earth: Shadow Of War Tests
Middle Earth: Shadow of War is a fun and beautiful title set in Tolkien's Lord of the Rings universe. To test the game's performance relative to other systems, we set the resolution to 1,920 x 1,080 (or 2,560 x 1,440) and turned the visuals up to the High preset. The frame rates here are the average reported by the built-in benchmark.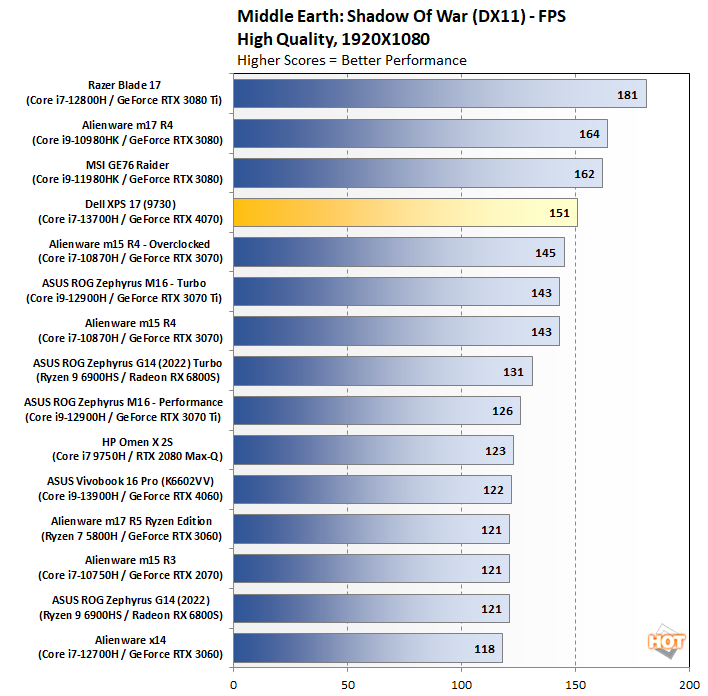
Our first game test shows the same 20% improvement due to the extra power headroom in the XPS 17 9730 over the XPS 15 9530. And also worth noting is that Alienware m15 R4 that won in the 3D Mark Port Royal benchmark is actually trailing here. There's plenty of performance under the hood to drive this game at even higher resolutions, if desired.
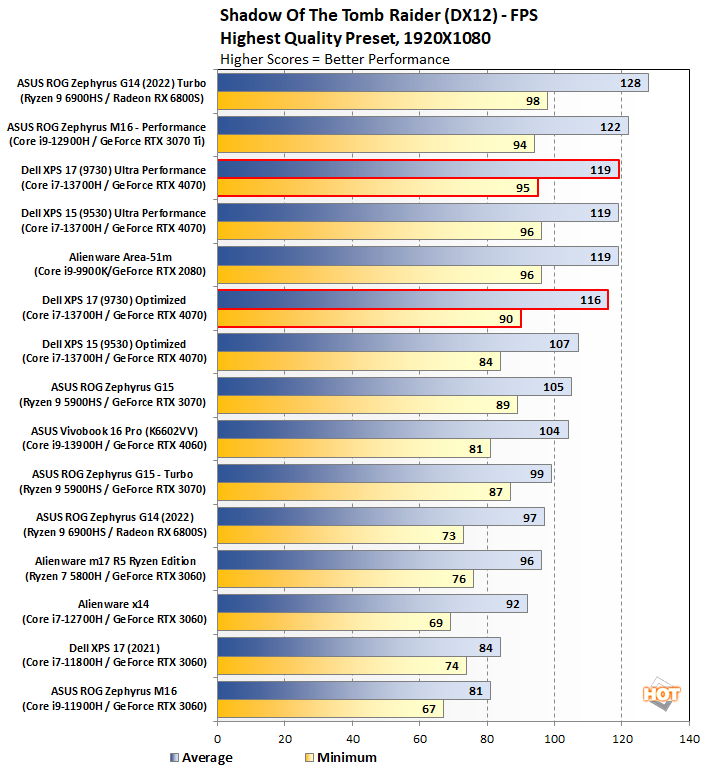
Shadow Of The Tomb Raider Benchmarks
The finale in the rebooted Tomb Raider trilogy, Shadow of the Tomb Raider is easily the best-looking of the bunch. It's also brimming with Tobii eye-tracking hardware support, and leading-edge graphics technologies. To test this game out, we again turned the visuals up to their highest preset and tested at the FullHD resolution of 1920x1080, and again at 2560x1440.
F1 2021 Benchmarks
F1 2021 supports DirectX 12 with ray tracing, and it incorporates support for a number of AMD's FidelityFX Super Resolution (FSR) and NVIDIA technologies (like DLSS). We tested the games with its Ultra High graphics preset, with ray-tracing and TAA enabled at a couple of resolutions to see what the Razer Blade 16 could do...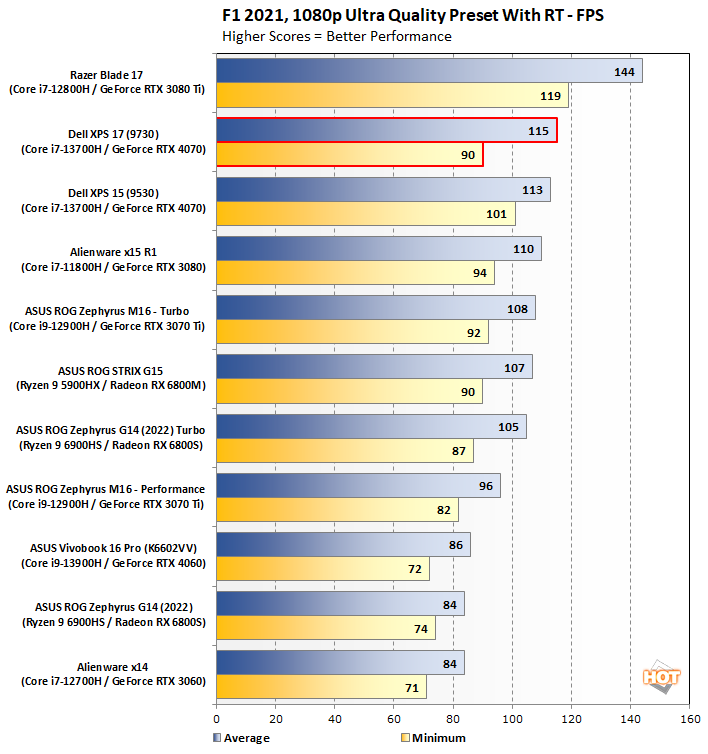
Marvel's Guardians Of The Galaxy
Marvel’s Guardians of the Galaxy is an action-adventure game where you play as Star-Lord and lead the rest of the Guardians from mission to mission. The game’s minimum requirements call for a Radeon RX 570 or GeForce GTX 1060-class GPU, but it also supports some of the latest graphics technologies, including DXR and DLSS.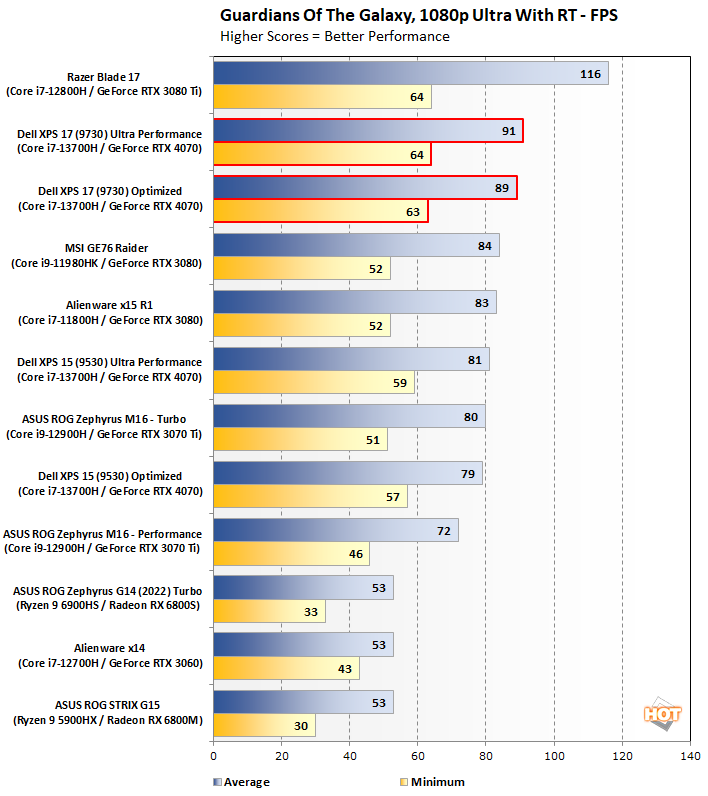
Next up, let's take a look at battery life and check out the insides of this machine to see how it keeps going under pressure...