ASUS ROG Zephyrus M16 Review: 12th Gen Power, RTX Punch

The ROG Zephyrus M16 has an additional wrinkle in that it gives users the ability to run with a couple of different power and fan profiles. We tested everything with two profiles: the Performance setting, which is the default, and the high-performance Turbo mode. Turbo boosts the TGP of the GeForce RTX 3070 Ti from 100 to 120 Watts. However, it didn't do anything to help CPU-focused tests, so we omitted those from our non-3D results. However, it made a pretty substantial difference in our GPU-focused tests, so we're including those results here. It also has a pretty substantial noise penalty, so we recommend using a headset for gaming. We'll talk more about that later.
2022 Zephyrus M16 ATTO Disk Benchmark
The ATTO disk benchmark is a fairly quick and simple test which measures read/write bandwidth and IOPS across a range of different data sizes. While we don't typically compare these results across multiple machines, it's useful to gauge whether a particular notebook's storage subsystem is up to snuff.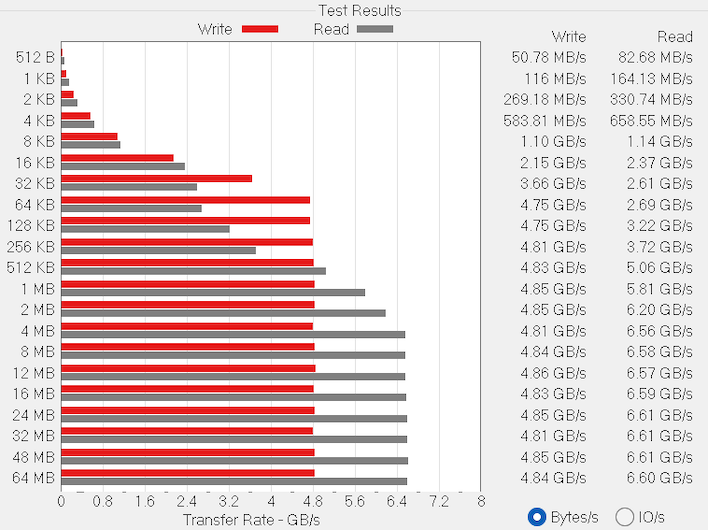
Up to snuff it is. Our system shipped with a single 2 TB NVMe PCI Express 4 solid state PM981a drive from Samsung that's similar to its excellent 980 Pro SSD. The transfer speeds are close to as good as we've seen from a single drive in a notebook. Writing consistently at nearly 5 GB per second is also very good throughput. The ROG Zephyrus M16 boots in just a few seconds from the BIOS to the Windows desktop, and everything we did from loading games to copying huge files was snappy.
Speedometer 2.0 Browser Benchmark
We use BrowserBench.org's Speedometer test to gauge our web experiences, which takes a holistic look at web application performance. This test automatically loads and runs several sample web apps from ToDoMVC.com using the most popular web development frameworks around, including React, Angular, Ember.js, and even vanilla JavaScript. This test is a better example of how systems cope with real web applications, as opposed to a pure JavaScript compute test like JetStream. All tests were performed using the latest version of Chrome.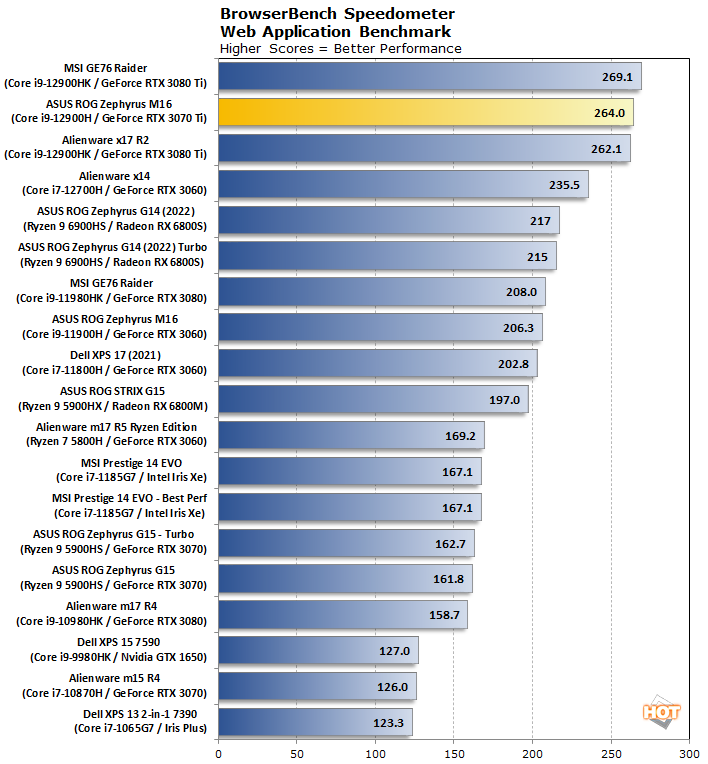
Alder Lake CPUs have dominated this benchmark since their release, and the Zephyrus M16 is no exception. The ASUS laptop is actually wedged between the Core i9-12980HK based Alienware x17 R2 and MSI GE76 Raider, and far ahead of anything with an 11th Gen Core processor or Zen-based CPU. Any system on this chart would likely be subjectively fast enough for any web task, but Alder Lake has been a special breed.
Cinebench R23 Rendering Benchmark
This is the latest 3D rendering benchmark from Maxon, based on the Cinema 4D rendering engine. We tested both single and multi-threaded performance on all of the notebooks represented here.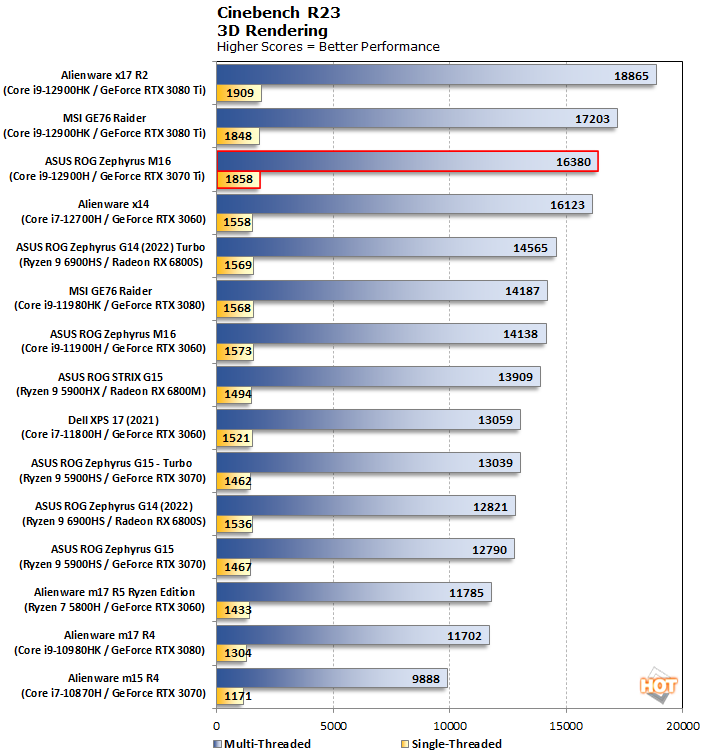
Just like our previous tests, the new and improved ASUS ROG Zephyrus M16 finds itself towards the top of the heap, right behind the slightly higher-specced Alder Lake notebooks. The single-threaded performance is especially strong, as it would rank second on our chart when sorted by that metric. The slightly lower all-core turbo clock is all that holds the ROG Zephyrus M16 from going toe-to-toe with the top machines like the Alienware x17 R2. 3D rendering isn't really something you'll do much on a laptop, but it's a great indicator that the cooling system can let the CPU stretch its legs when needed.
Geekbench 5 Benchmarks
Geekbench is a cross-platform benchmark that simulates real world processing workloads in image processing and particle physics scenarios. We tested the notebooks featured here in Geekbench's single and multi-core workloads. It measures single-threaded performance allowing a single core to stretch its legs, and multi-threaded throughput to put all cores under a heavy load.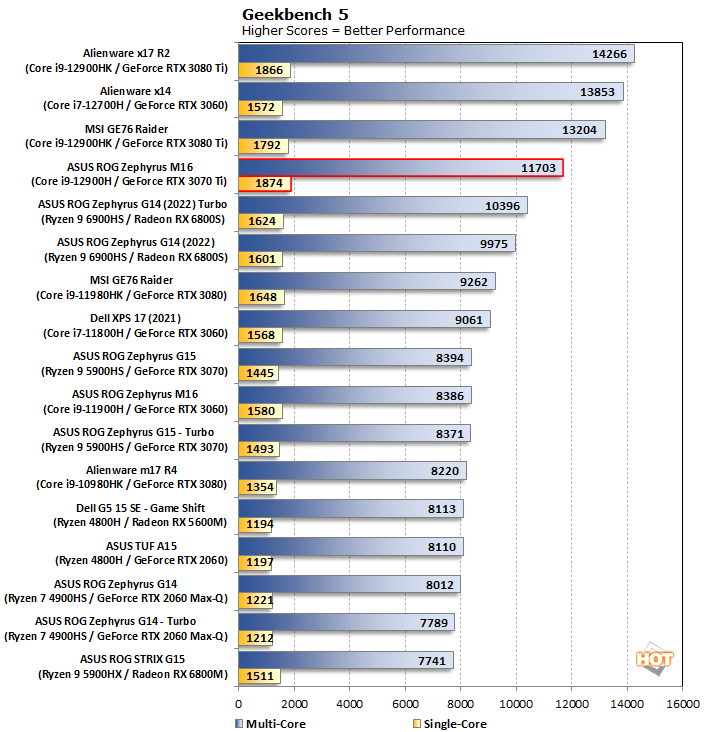
Single-threaded and multi-threaded, the story is the same as it was in Cinebench. Geekbench is a nice synthetic test that evaluates performance with a variety of workloads, however, and the variety does nothing to knock the ROG Zephyrus M16 off its game. While it doesn't rank at the very top of the charts, there's a huge gulf between it and the next-fastest group, including the Dell XPS 17 9710.
PCMark 10 Whole System Benchmarks
PCMark 10 uses a mix of real-world applications and simulated workloads to establish how well a given system performs productivity tasks, including image and video editing, web browsing, and OpenOffice document editing. While these scores appear to be all over the place, the systems are sorted by their overall PCMark score, which is the third (gray) bar in each cluster.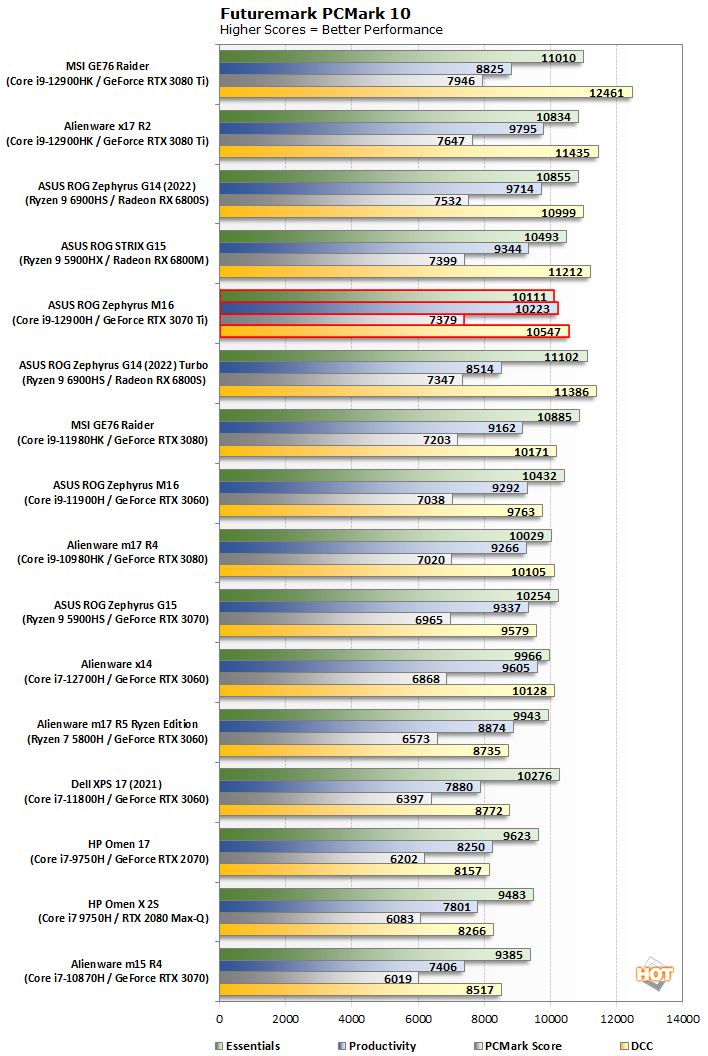
PCMark is a full-system benchmark, and for whatever reason, the Zephyrus as a full system is a bit slower than the other two Alder Lake notebooks. Not that it's even remotely slow; it's still up towards the top of our results and performs great. Interestingly, it's actually a pretty tight race with last year's M16, though the Alder Lake processor in this year's incarnation separates itself a bit, especially in the productivity test.
3DMark Graphics And GPU Tests
3DMark has several different graphics tests which focus on different types of systems. We start with Time Spy, which is 3DMark's headline benchmark. This test presents a pretty significant challenge for the system's CPU and GPU using the DirectX 12 API library.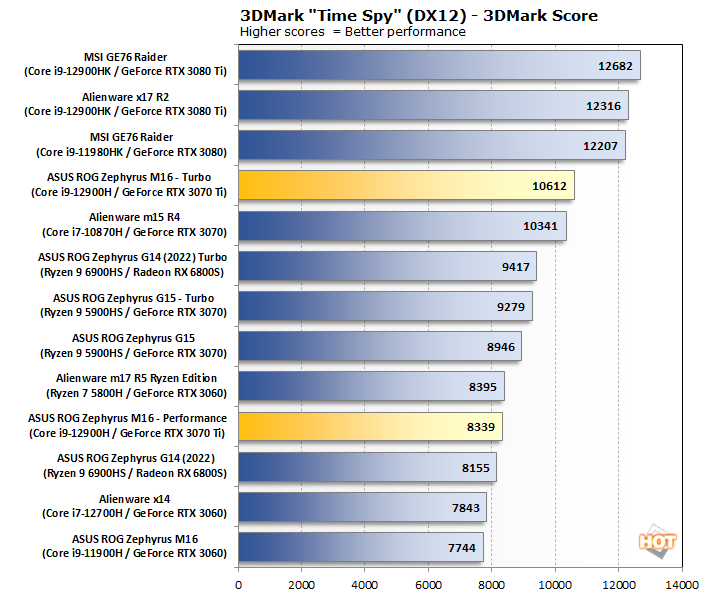
The GeForce RTX 3070 Ti inside the ROG Zephyrus M16 is no slouch, but the fact of the matter is that it's hobbled slightly by its lower CUDA core count and memory speed compared to the RTX 3080 and 3080 Ti of the systems that beat it. The stock Performance mode with its slightly lower 100 W TGP is much more tame, as it only matches the Alienware m17 R5 Ryzen Edition.
However, this is also the first time we'll look at a Turbo figure, and the result is quite a decent boost. While we don't typically overwhelm readers with individual test scores, we can tell you that the tests that benefitted the most were the two graphics-focused scenes, rather than CPU or blended tests. Once the CPU gets kicked up, the bump is pretty minor, but we expect that in games that don't need tons of CPU power, the GPU will be able to stretch its legs. We'll see soon.
But before that let's take a look at the DirectX 11 Fire Strike Extreme, which is still quite a heavy lift for graphics cards today.
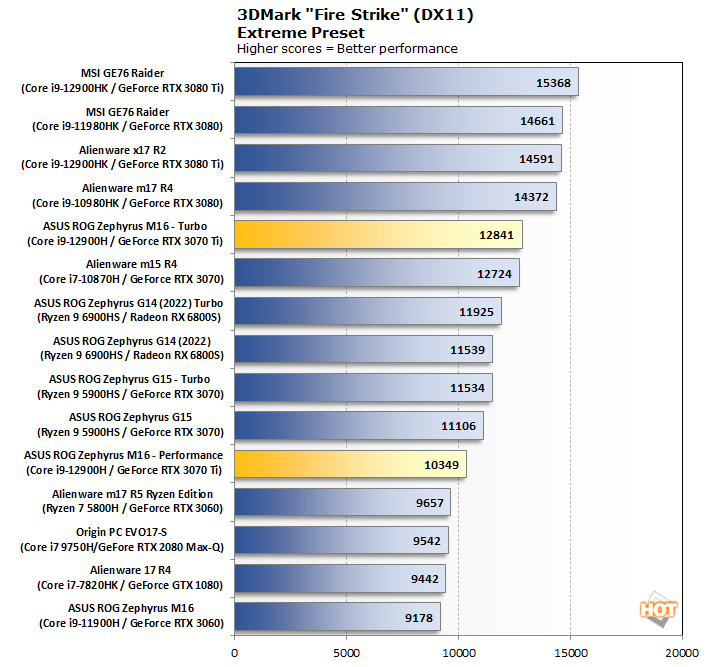
Again, we see performance slotted in right where we'd expect it with a nice bump from the Turbo setting in Armory Crate. In fact, bump doesn't really do it justice. We're seeing a 24% performance increase just from letting the fans run as fast as they can, which in turn allows the CPU and GPU to crank up their respectively clocks for longer durations. As long as this carries into games somewhat, it seems like Turbo mode is a no-brainer for extended gaming sessions, as long as the noise doesn't drive folks away.
Lastly, the Port Royal test uses DirectX Ray Tracing (DXR) to illuminate a scene...
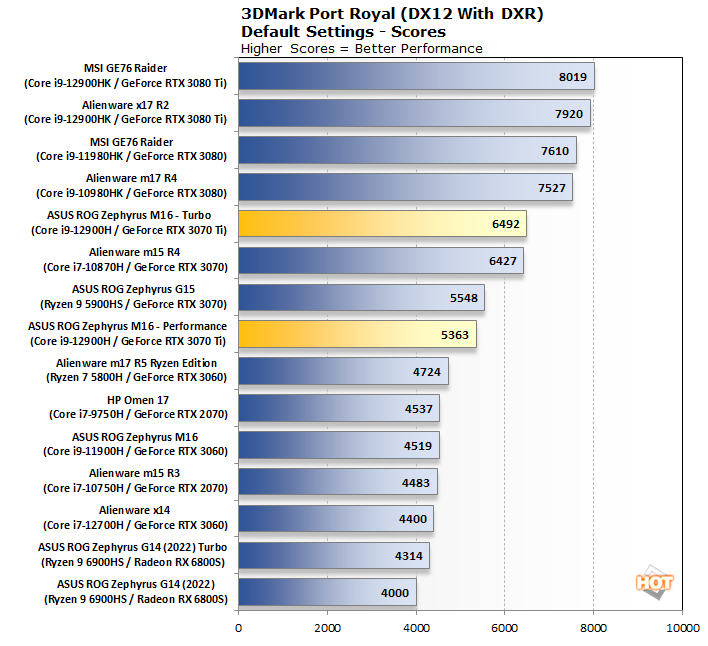
DXR hardware is a requirement for this test, so we don't have quite as many machines represented. Not that it matters; ray tracing-capable systems dominate the non-RT charts, too, and so the Zephyrus M16 still finds itself towards the top of this one. The systems with an RTX 3080 Ti are still a tick faster, but there's a 3080 Ti version of the Zephyrus for those who just need a little more in its more normal-sized form factor.
Already our graphics tests have given the previous generation Zephyrus M16 a real drubbing, but that's to be expected. Last year's model had a GeForce RTX 3060, not the 3070 Ti on display here, so graphics performance is night and day different. That's expected and not at all bad.
F1 2021 Gaming Benchmarks
F1 2021 is Codemaster’s latest Formula One racing simulation, and like previous version of the game, it sports impressive visuals. This latest addition to the franchise supports DirectX 11 or DirectX 12, and it incorporates support for a number of AMD's FidelityFX and NVIDIA technologies (like DLSS), though we didn't enable any of them to keep the playing field level. We tested the game with its Ultra High graphics preset, but with Ray Tracing and enabled to see what the systems cards could do.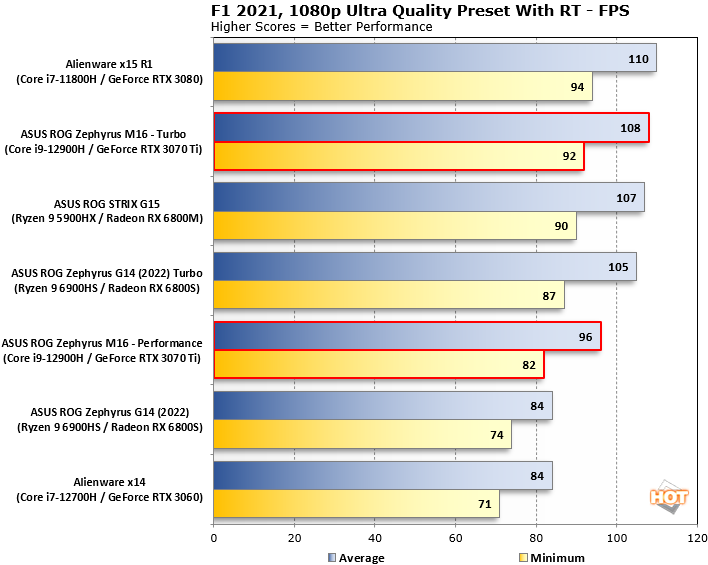
FarCry 5 Gaming Benchmarks
Next up we have Ubisoft's FarCry 5, which takes the franchise to Montana with lush environments and incredible graphics fidelity. We ran this laptop through the built-in benchmark with Ultra Quality settings, alongside all of the other systems in our database.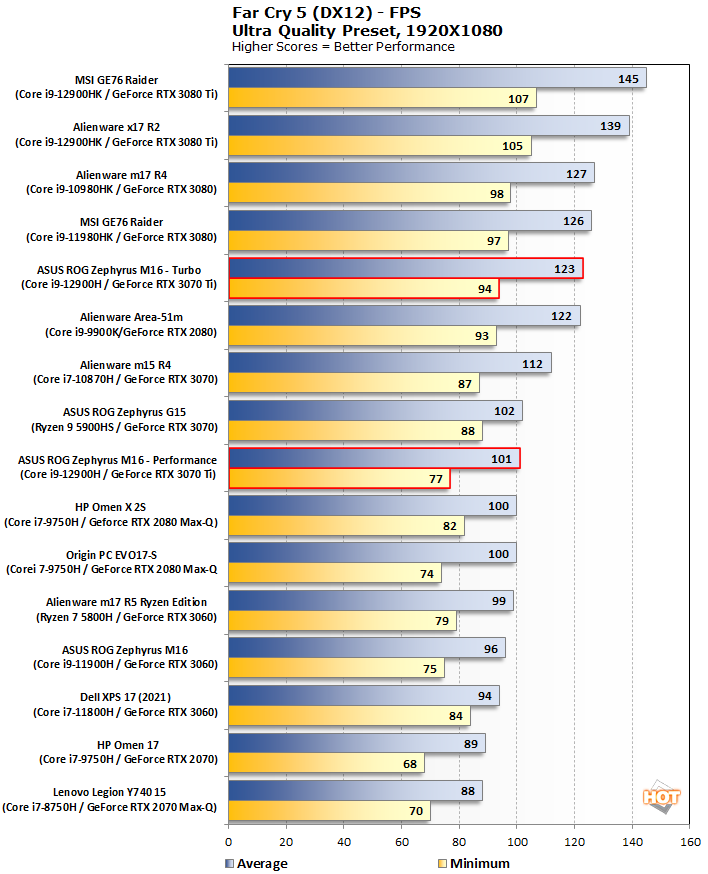
As we've seen in a few previous tests, Turbo mode results in a significantly performance boost. We see a huge 22% bump in frame rates with a similarly large increase on the low end. It's not quite enough to catch the next model up the chain, as our RTX 3080-infused MSI GE76 Raider with Tiger Lake, but it's awfully close. Unsurprisingly, it also beats out every downstream model in Turbo mode. Performance mode actually falls prey to systems like the Alienware m15 R4 with its GeForce RTX 3070, however.
Gears 5 Gaming Benchmark
Gears 5 is a popular title on the Xbox and PC alike, and on top of looking great, it's a blast to play. We used the High image-quality preset at 1920x1080, same as the other games, to test Gears 5.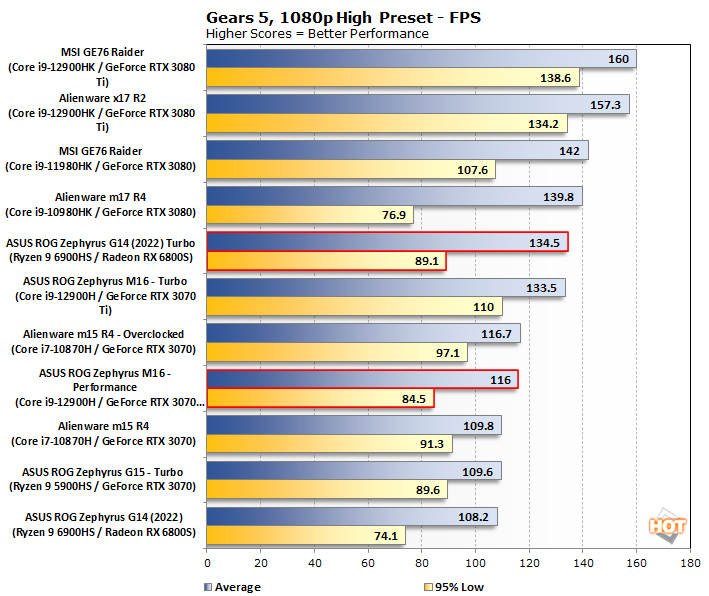
Gears 5 is almost entirely single-threaded, so the CPU doesn't have to work very hard to feed enough data to the GPU to keep the game running smoothly. An average frame rate of 116 fps is pretty great, until you see that Turbo boosts that by more than 10% to up over 130 fps. Again, the GPU sets a rough grouping for our lineup, as the RTX 3070 holds the ROG Zephyrus G15 back from leading over the Zephyrus M16.
Guardians of The Galaxy Gaming Benchmark
Marvel’s Guardians of the Galaxy is an action-adventure game, where you play as Star-Lord and lead the rest of the Guardians from mission to mission. The game’s minimum requirements call for a Radeon RX 570 or GeForce GTX 1060-class GPU and the game also supports some of the latest graphics technologies, including DXR and DLSS, though we didn't enable the AI-assisted AA technique in our testing, to keep the playing field level.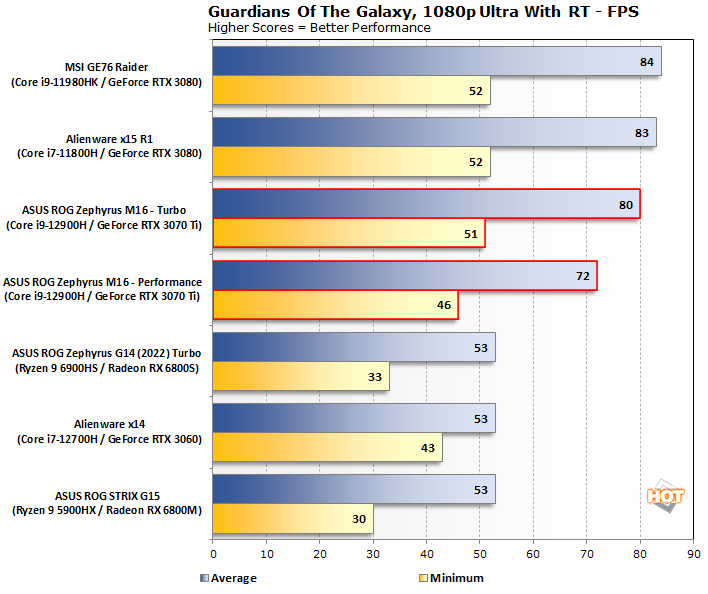
The Radeon in the ROG STRIX G15 doesn't cope particularly well with this Way It's Meant to be Played title, and the GeForce laptops lead the way. This time, the frame rate boost we see on the Zephyrus M16 with Turbo mode enabled is milder, just over 10%, but it's still quite tangible. Low frame rates are up similarly, which is where we need it most. The game runs very smooth even with all the hardware-assisted ray tracing effects cranked up, and it looks great as a result.
Middle Earth: Shadow Of War Gaming Benchmark
Middle Earth: Shadow of War is a fun and and beautiful title set in Tolkien's Lord of the Rings universe. To test the game's performance relative to other systems, we set the resolution to 1920x1080 and turned the visuals up to the High preset. The frame rates here are the average reported by the built-in benchmark.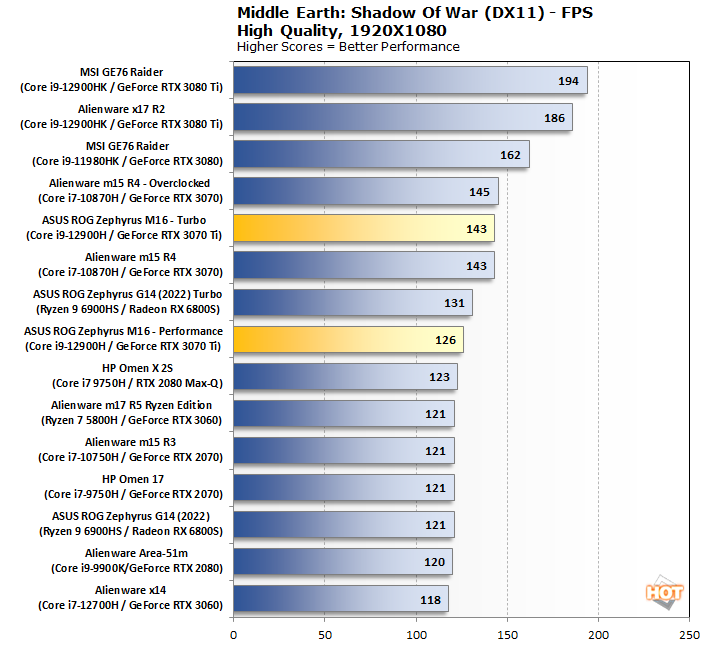
Again the stock performance is pretty nice but the Turbo setting kicks in an extra 15% in the frame rate. Getting beaten out by the GeForce RTX 3070 in the Alienware m15 R4 may not look great, but remember that the ASUS machine is a thinner, smaller notebook that's more portable and easier on the shoulders, so thermals can be a bit of a concern. Turbo doesn't provide a lot of separation in this case, but does catch the system up nicely.
Shadow Of The Tomb Raider Gaming Benchmarks
The finale in the rebooted Tomb Raider trilogy, Shadow of the Tomb Raider is easily the best-looking of the bunch. It's also brimming with Tobii eye-tracking hardware support, and leading edge graphics technologies. To test this game out, we again turned the visuals up to High and tested at the Full-HD resolution of 1920x1080.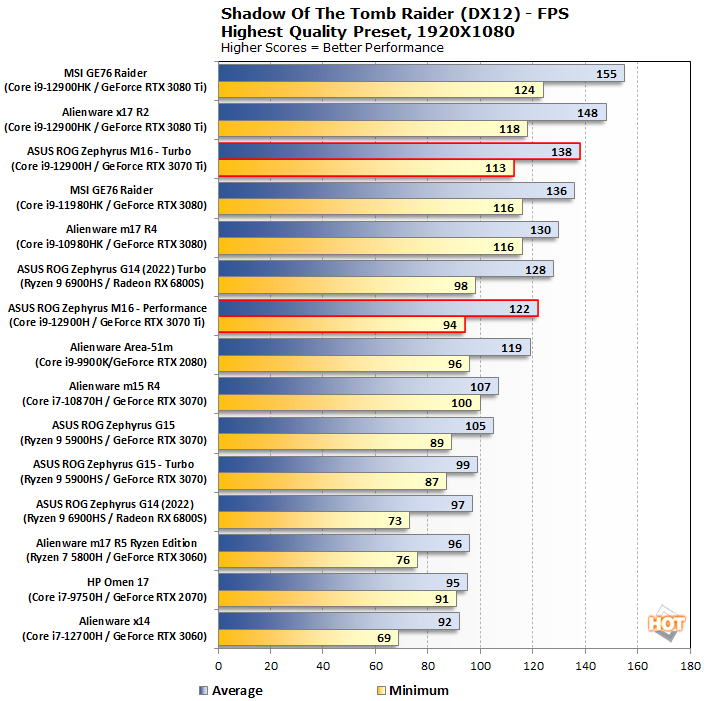
Our final gaming test ends up just like the others: the ASUS ROG Zephyrus M16 punches above its weight class with Turbo enabled. It's consistently faster than any of the GeForce RTX 3070 laptops in our field, although it can't really keep up with the highest of the high end. It gives far more than 60 fps on average, which justifies the high refresh rate of its IPS-level display. Even though the display's 1440p resolution is above our 1080p test resolution, we have good confidence that there's enough performance here to spread to a higher resolution.
Battery Life And Power Tests
We run a custom 1080p HD video loop test developed in-house, to prove out battery life with our test group of machines. In all tests, Windows Quiet Hours / Focus Assist has been enabled and the displays are calibrated with lux meters on pure white screens to as close to 115 lux as possible. For the average laptop this is somewhere between a 40-60 percent brightness setting.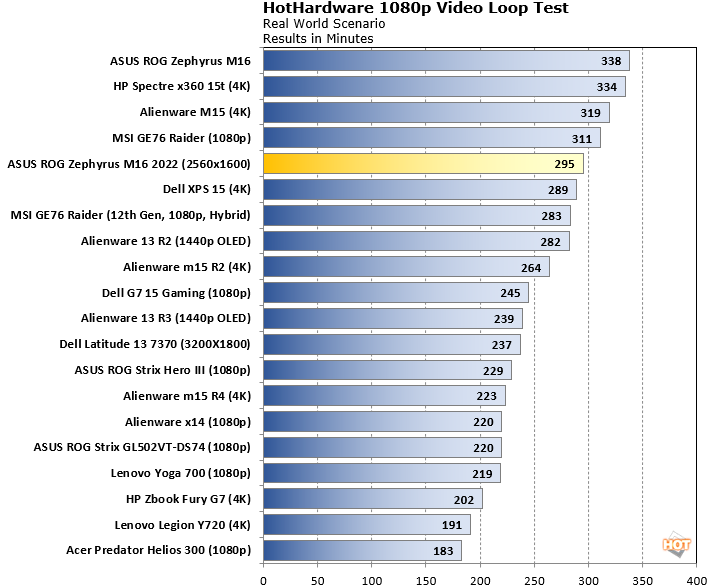

Battery life isn't great, but it's not terrible. The 90 Wh battery inside the ROG Zephyrus M16 lasted about as long as the slightly larger 99 Wh behemoth in the GE76 Raider, and the runtimes aren't all that different either in gaming or in video playback. Pushing up towards five hours is respectable when the onboard GPU has to be kept going. There's no distinction between discrete-only and hybrid here, so nobody has to worry about managing modes to make the battery last its longest.
While the battery life wasn't exactly mind-blowing, we do need to call out the 240W power adapter that ASUS includes with the Zephyrus M16. When the system fully charged after the video playback test in about 80 minutes, I thought maybe I misread the clock when plugging it in. But after the gaming test, it only took another 80 minutes to get to 100% again, so that's just how quickly it charges. That's impressive.
So, we've got great performance and so-so battery life. Let's look next into how the Zephyrus keeps all that hardware nice and cool, and then sum up how we feel about the sum of its parts.