HP ZBook Ultra G1a Review: An AMD Strix Halo Based Portable Powerhouse

It's time to see how the HP ZBook Ultra G1a runs in a wide array of tests. As always we ran each test a minimum of three times to ensure that a run wasn't spoiled by random background tasks and the like. We installed the latest drivers and everything available on Windows Update before we proceeded with these tests. Every test was run on the Balanced power profile, as well. And as previously disclosed, we uninstalled Wolf Security because it hampered the hardware's performance.
ATTO Disk Benchmark
First up is a quick-and-dirty SSD test from ATTO. These days, just about any SSD can handle any consumer workload at a pace where users would be hard pressed to tell the difference, but we do like to see extended actions get done sooner rather than later.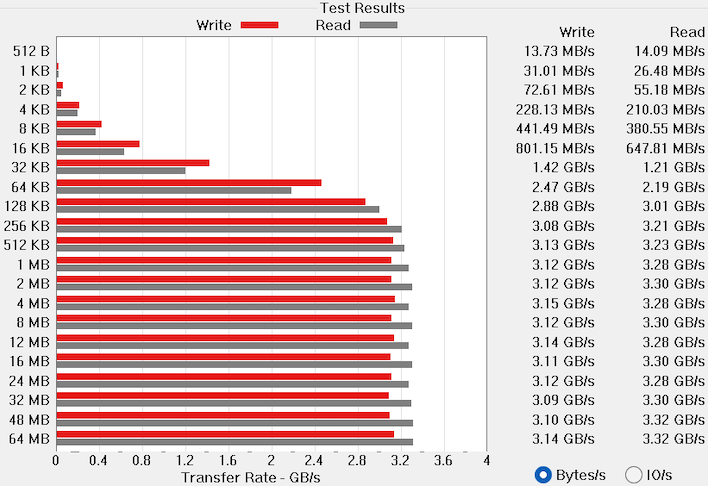
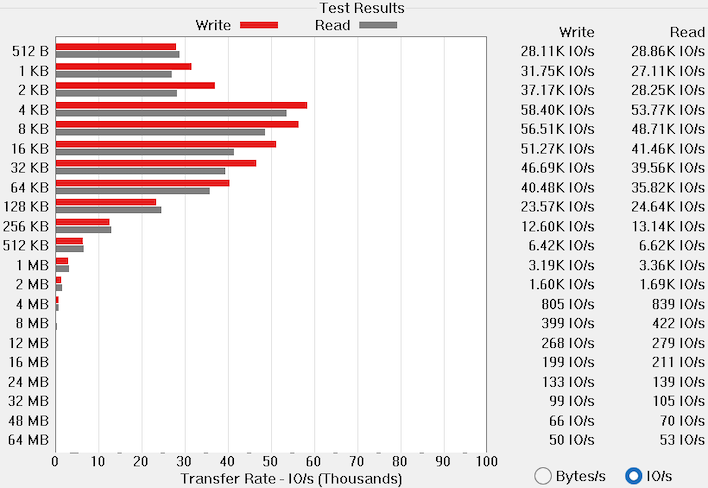
Our ZBook Ultra G1a came with a 2TB Western Digital SN810, which is an M.2 2280 NVMe drive. While it's a PCI Express 4.0 drive with a rated throughput of up to 6.6 GB per second, we only hit about half that speed here. We're not sure if the slot is limited to PCIe 3.0, if there's a configuration issue in the BIOS (we couldn't find anything) or if there's something else going on. At any rate, our benchmarks for the ZBook Ultra G1a are off to an inauspicious start.
Speedometer 3 Browser Benchmark
We use BrowserBench.org's Speedometer test to take a holistic look at web application performance. This test automatically loads and runs a variety of sample web apps using the most popular web development frameworks around, including React, Angular, Ember.js, and even plain-Jane JavaScript. This test is a better example of how systems cope with real web applications in comparison with a more compute-focused JavaScript test like JetStream. All tests were performed using the latest version of Chrome.
We can probably blame what appears to be random sorting on this chart on the fact that Google optimizes its V8 JavaScript engine with zealous enthusiasm, because the most recent entries are all the fastest. On the other hand, our ZBook Ultra G1a sits in the middle as a good divider between thin-and-light notebooks on the low end and power-thirsty gaming notebooks above it. Performance is about where we'd expect it, although it's always disappointing to see a Zen 5 CPU get beat by a three-year-old MacBook Pro, especially when you're talking about a $2,000-and-up notebook. While it's about 10% slower than the ASUS ROG Flow z13, it's still ahead thin and light notebooks by a good margin.
MAXON Cinebench 2024 3D Rendering Benchmark
Next up is the latest-generation 3D rendering benchmark from Maxon, based on the Cinema 4D rendering engine. It's a purely CPU-based test that doesn't make use of the graphics processor at all, and it scales very well with additional CPU cores. We ran both single- and multi-threaded tests on all of the machines in the charts.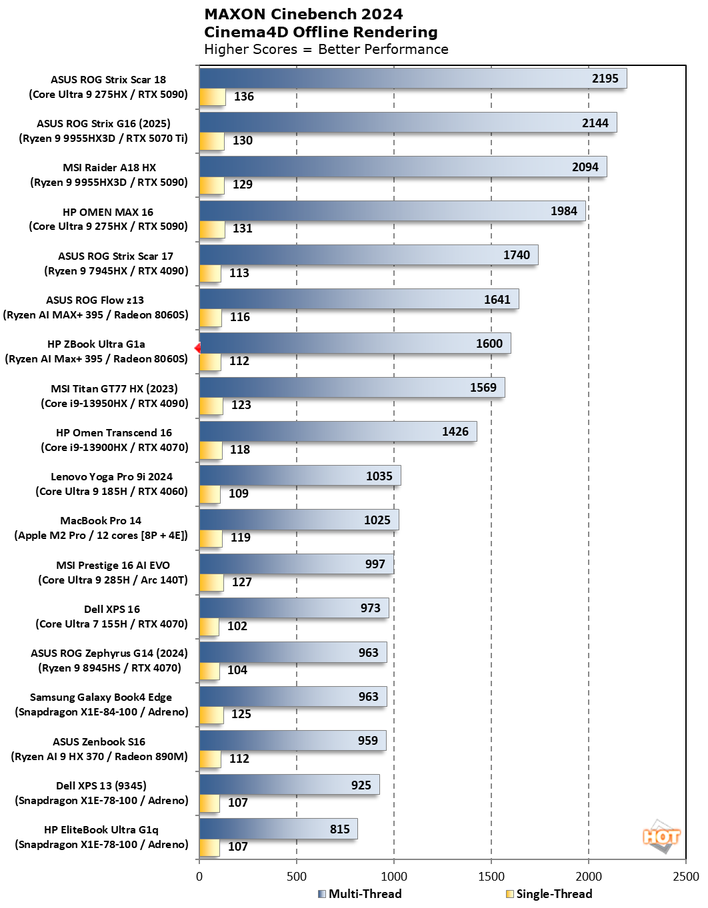
We'd expect for the ZBook Ultra G1a to land right about where the ROG Flow z13 does on the chart, and that's exactly what we get. The ASUS system is limited to an 80W TDP, and considering the HP's 140W USB-C charger, we have to expect that's about where the HP is configured as well. Although HP doesn't advertise the exact TDP, it might be somewhat fluid depending on the power profile. All the same this is a very healthy score. Considering HP marketing this machine to professionals as a high-performance, lightweight notebook, it even seems like rendering might be a targeted use case for this one.
Geekbench 6 CPU Performance Benchmark
Geekbench is a cross-platform benchmark that simulates real-world workloads in a wide variety of tasks, including encryption, image processing, physical simulation, machine learning, and many more. We tested the systems featured here with the latest Geekbench 6 version to get an idea of their overall system performance.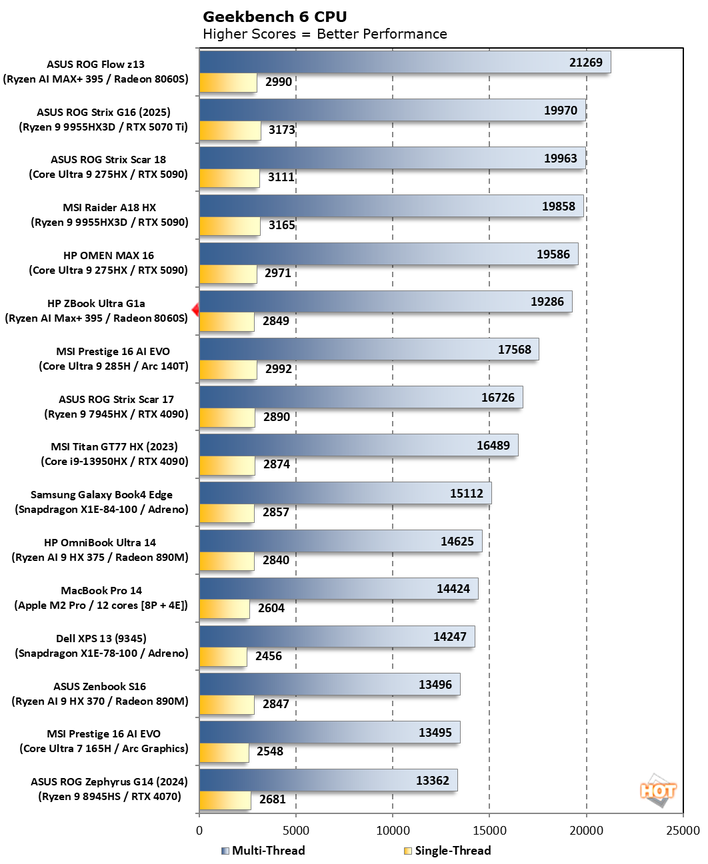
Geekbench is kind of suspect as a benchmark, since it seems to be more interested in bandwidth than actual CPU performance, but the ZBook Ultra G1a lands about where you'd expect. Single-threaded performance in any modern CPU is about the same, and the HP's multi-threaded score hangs with notebooks that require a lot more power. All good here.
Geekbench AI Machine Learning Benchmarks
The Geekbench AI benchmark provides a straightforward look at how well a device handles a variety of AI-assisted tasks. This quick and easy test gives you a numerical snapshot of the CPU, GPU, and NPU's ability to power through real-world machine learning workloads, factoring in both speed and accuracy. The higher the score, the better the device's AI chops, whether it's image recognition, object detection, or natural language processing.Results are presented in three levels of numerical precision: single precision or FP32, half precision or FP16, and quantized or INT8. All results that the benchmark provides are geomean scores from multiple runs of each test workload, which is pretty convenient for us reviewers.
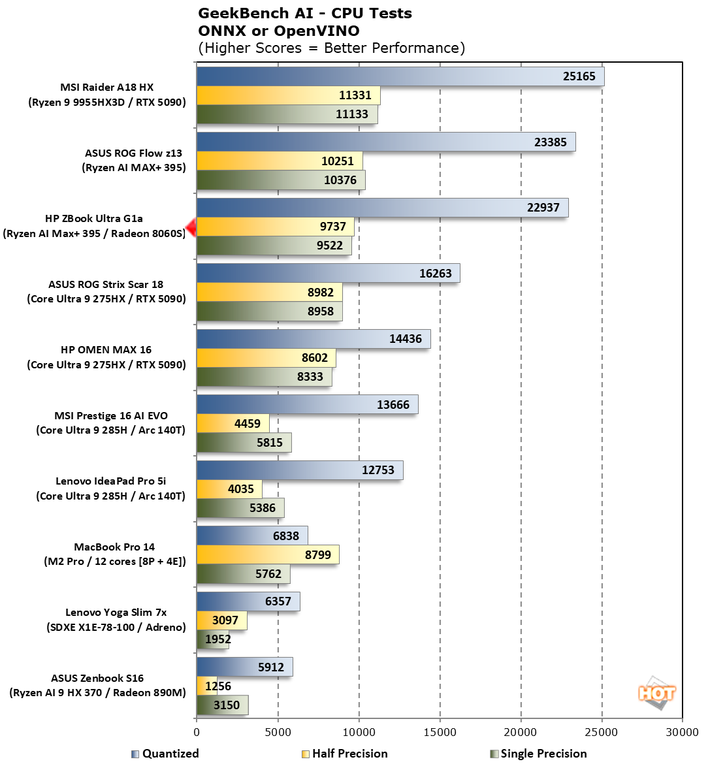
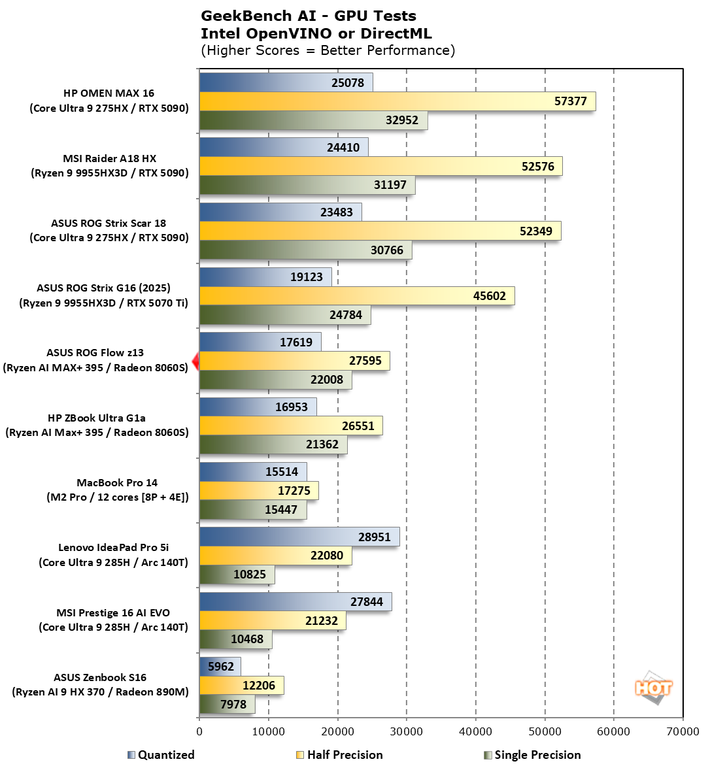
In both cases, the HP ZBook Ultra G1a was within spitting distance of the ROG Flow z13. It's kind of hard to make a comparison of GPUs on our charts, though. The Radeon 8060S is much faster than all other integrated GPUs, but it lags behind larger mobile discrete GPUs like the GeForce RTX 5070 Ti in the ASUS ROG Strix G16. On the other hand, it likely pulls less power while doing it, which is good for efficiency, battery life, and heat generation.
UL PCMark 10 Productivity Benchmark
The standard PCMark 10 benchmark uses a mix of real-world applications like OpenOffice and Zoom as well as simulated workloads to establish how well a given system performs productivity and content creation tasks, including (but not limited to) image and video editing, web browsing, teleconferencing, document creation, and so on. We ran it on all these machines to see which one is the best for creative work.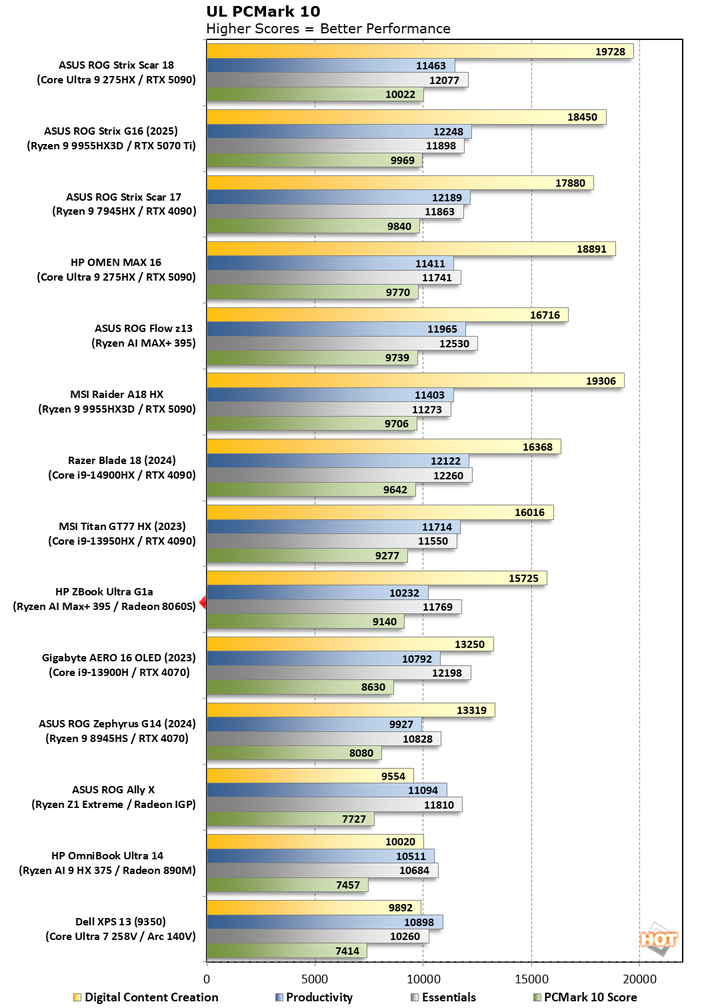
This represents the biggest loss of the ZBook Ultra G1a's showing, trailing the Strix Halo-equipped ROG Flow z13 by around 7% overall, mostly due to a significant 20% slowdown in the Digital Content Creation score. We could potentially chalk this up to drivers, since the HP system uses AMD's Radeon Pro software, which could be tuned differently to ensure accuracy over raw performance, or the lower than expected SSD performance. Whatever the cause, it's the first time among all our tests that we saw anything that might be a cause for concern. The DCC result still represents a huge step up over low-power discrete GPUs like we found in the Gigabyte Aero 16 OLED and light years ahead of anything else in which the GPU is integrated.
UL PCMark Applications Office Benchmarks
We've started using the PCMark 10 Applications benchmark a bit more because it measures performance in Office and Edge using native instruction set-compatible versions of the apps for optimal performance across both x86 and Arm architectures. The following results should paint a picture of performance with the best foot forward from all systems tested.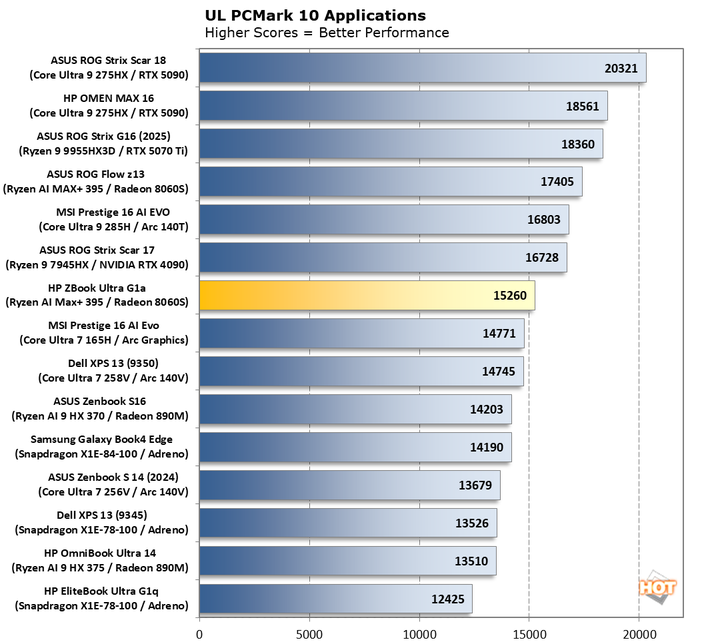
Here's another PC Mark test in which the ZBook Ultra G1a trailed the 80-Watt ASUS system by a fairly wide margin. 2200 points equates to around 15% faster for the ASUS machine, with a similar processor. This time the ZBook performed more like the low-power thin and light notebooks like the MSI Prestige AI Evo. It's certainly not slow, but it's not as fast as we feel like it should be.
UL 3DMark Synthetic Gaming Benchmarks
3DMark has a wide variety of graphics and gaming related tests available. To best match up with the historical benchmark data that we have hanging around, we ran the Fire Strike Extreme QHD DirectX 11 benchmark, the Time Spy QHD DirectX 12 benchmark, and the Port Royal DXR ray-tracing benchmark. First up: Fire Strike Extreme: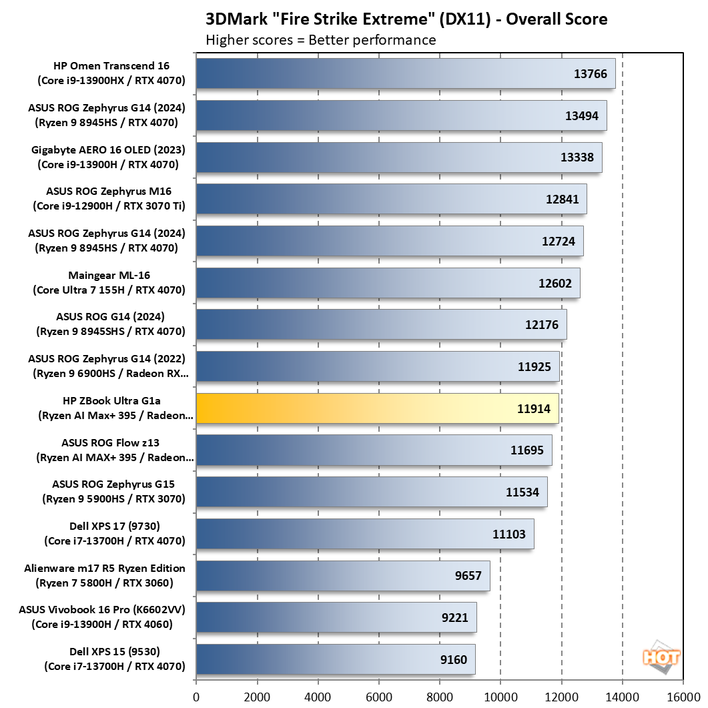
This DirectX 11 benchmark is kind of losing its relevance. Most of our notebooks are tightly packed at around the 12,000 point mark, and there are GeForce RTX 4070 notebooks that (spoiler alert) are much faster in other tests, like the HP Omen Transcend 16, that are only a little bit faster here. DX 11 is ancient as far as graphics APIs go, but if you're mostly interested in older titles here's a good look.
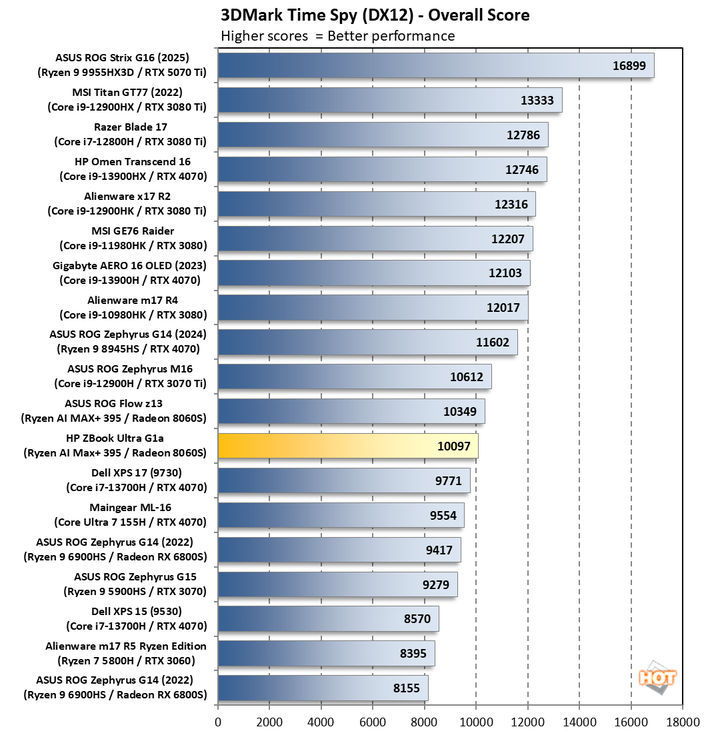
Time Spy is, in our view, much more relevant as it targets DirectX 12 and has a fairly demanding workload for something without ray tracing. And here you can see that with hardware that focuses on current APIs, and while using said APIs, the HP ZBoox is now 25% faster. The HP ZBook Ultra G1a stands on its own, though; it's very speedy in its own right and nips at the heels of the ASUS ROG Flow z13 with the same chip. We don't think it'll have trouble running real games at all.
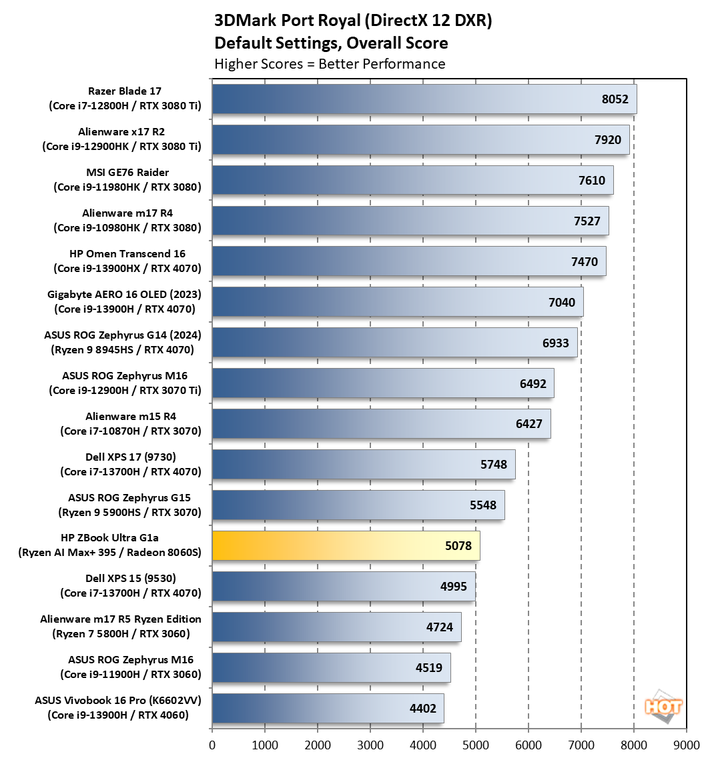
Thanks to its RDNA 3.5 roots, the ZBook Ultra G1a does not do particularly well in Port Royal. That was expected, however. RNDA 4 saw big gains on the desktop side, and we're expecting that once those mobile parts ship, they will do well in notebooks too. But for now, NVIDIA-based notebooks like the Alienware m17 R4 (which is much larger than the ZBook) will continue to rule the roost here.
Middle-earth Shadow of War Benchmarks
Middle-earth: Shadow of War is a fun and beautiful title set in J.R.R. Tolkien's Lord of the Rings universe. To test the game's performance relative to other systems, we set the visuals to the High preset and tested in both 1080p and 2560×1440. The frame rates here are the average reported by the built-in benchmark.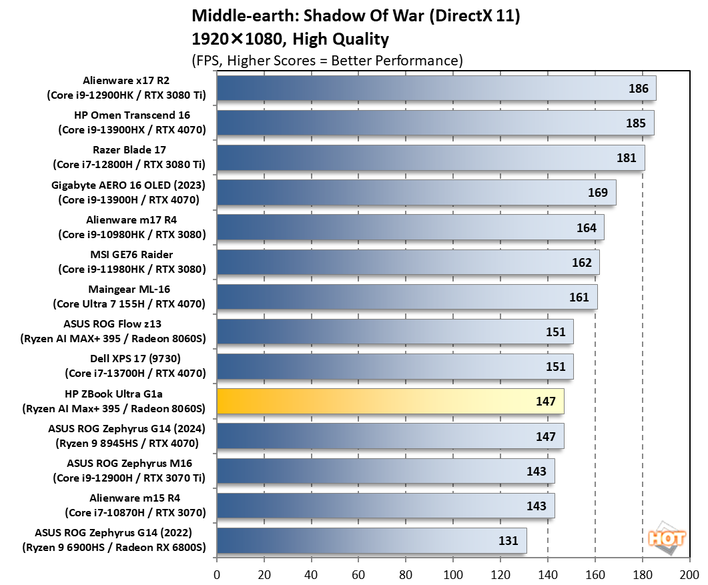
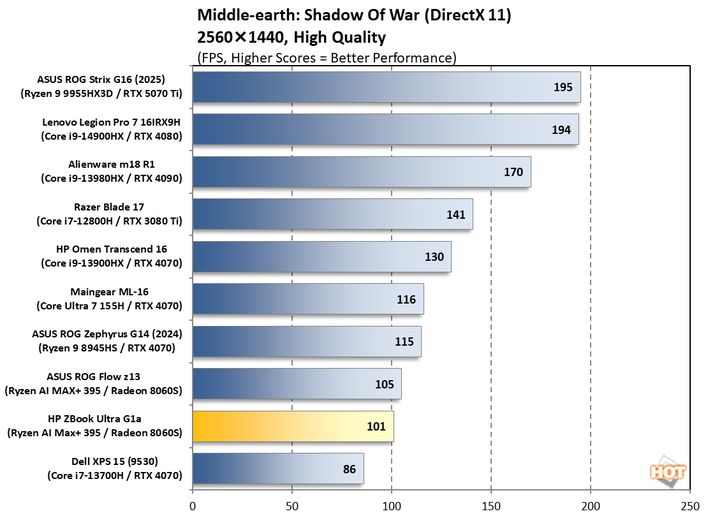
1080p in this title was super playable so we'll jump straight to talking about 2,560 x 1,440 here. And despite being on the lower end here, the ZBook Ultra G1a was still a very smooth experience. While we don't collect data for every resolution under the sun, I can tell you that the native 2,880 x 1,800 resolution of the ZBook was still a smooth experience here. Go ahead, play games like this one at the native resolution and enjoy it.
Shadow of the Tomb Raider Benchmarks
The finale in the rebooted Tomb Raider trilogy, Shadow of the Tomb Raider is easily the best-looking of the bunch. It's also brimming with fancy tech, including all three vendors' smart upscalers, ray-traced shadows, and even Tobii eye-tracking support. To test this game out, we turned the visuals up to their highest preset and tested at 1080p and 2560x1440.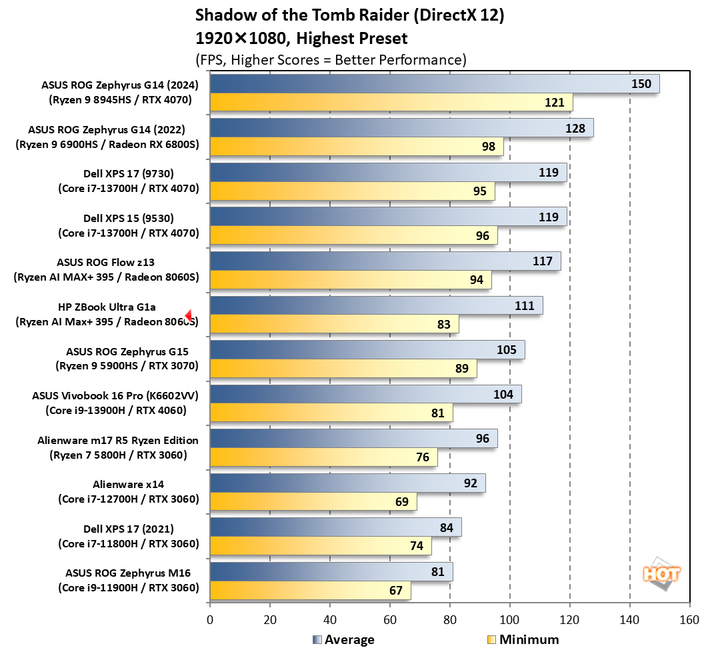
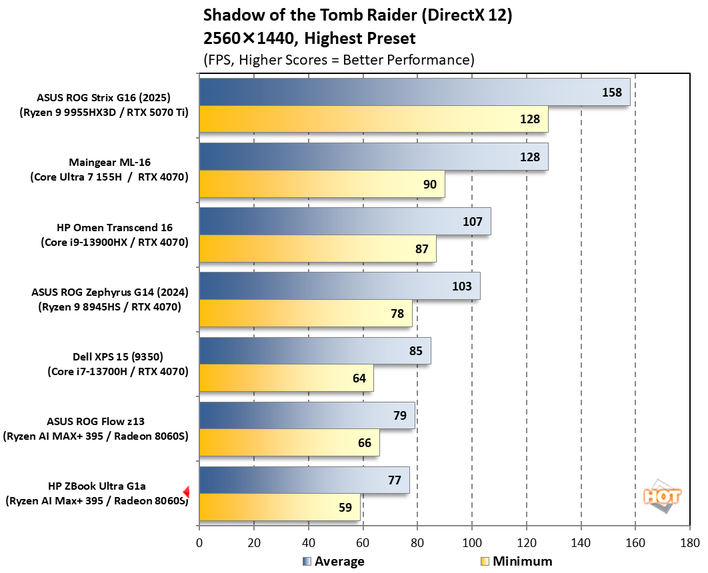
Once again 1080p is exceptionally smooth on the ZBook, and 1440p is where we start to see it work hard. However, unlike Shadow of War, we'd probably cap it out at 1440p here. The low frame rate was right below the 60 fps line, and the average was pushing 80. It's right in line with the ROG Flow z13 and not terribly far off the pace of the Dell XPS 15 (9350) with its discrete GeForce RTX 4070 at the higher resolution. All things considered, it's pretty outstanding to see performance like this from an integrated GPU with a shared memory bus.
Marvel's Guardians of the Galaxy Benchmarks
Marvel's Guardians of the Galaxy is an action-adventure game where you play as Star-Lord and lead the rest of the Guardians through various missions in a wide variety of galactic locales. The game’s minimum requirements call for a Radeon RX 570 or GeForce GTX 1060-class GPU, but it also supports some of the latest graphics technologies, including DXR and DLSS.
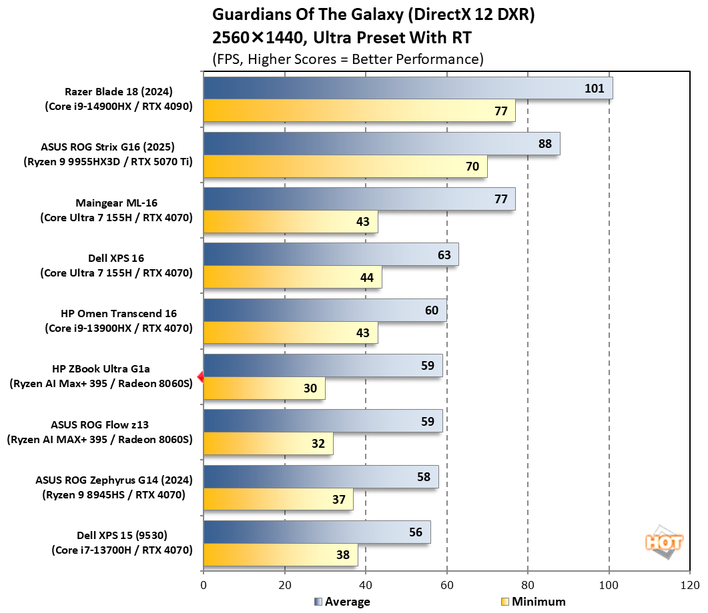
We've finally hit a title where 1440p isn't really an optimal experience, but that's not the fault of the ZBook itself. The average 59fps is pretty solid, all told, but a 30 fps minimum isn't what you'd like to see. And honestly, the 31 fps we saw in 1080p isn't much better. The game seems to suffer from inopportune disk access or some other cause of the occasional stutter. For the most part our subjective opinion is that the benchmark runs pretty smoothly only to stumble in transition.
F1 24 Formula One Racing Benchmarks
The previous iteration of Codemasters' annual officially-licensed F1 racing game carries forward the gorgeous custom ray-traced global illumination (RTGI) solution from F1 23 while improving texture quality and performance across the board. Many environmental objects have had their detail improved, and the tracks look a lot more like their real-world versions in this release, especially after a major graphics patch back in December 2024.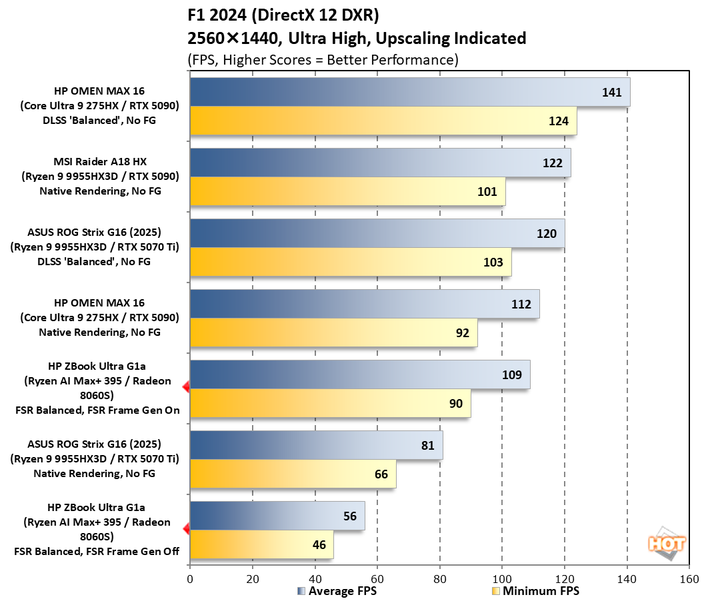
Without frame generation and upscaling, the ZBook Ultra G1a struggles to deliver a playable experience at 1440p in this game. However, with Balanced FSR enabled, the frame rate smooths out considerably and still looks pretty good. In our opinion, it's at a point where turning on frame generation doesn't cause it to feel unnaturally laggy. Everything else on this chart is playing with a discrete GPU, and so this might represent an unfair fight, but the ZBook Ultra G1a didn't back down, mostly because it's a PC and it does what I tell it to do. 56 fps without frame gen is fine, but 109 fps with it enabled both looks and feels smooth.
PC Mark Video Playback Battery Life
PCMark's video playback test is a good indicator of how long of a flight we can take without being bored to tears. We set the display's brightness to as close to 115 lux as possible, turned off all the automatic sleep features in Windows, and let it run until its untimely shutdown when the battery is depleted. It uses Microsoft's built-in TV and Movies app and makes full use of hardware acceleration._1-hp-zbook-ultra-g1a.png)
_2-hp-zbook-ultra-g1a.png)
Both from an absolute perspective (due to the 74.5 Whr battery) and a minutes-per-Watt-hour perspective (due to efficient hardware) the ZBook Ultra G1a impresses in terms of battery life. The ROG Flow z13 does last longer, but the hardware doesn't have to work as hard to draw its 2,560 x 1,600 desktop, either. 11 hours is solid performance, outlasting notebooks with discrete GPUs by at least two hours, in the case of the ASUS ROG Scar 18 and its 90 Whr battery. They're two VERY different notebooks, but this illustrates the battery savings one can achieve in a set up like this, and HP did well.
Next up let's tear this thing down, see how it keeps cool, and render our final verdict...