HP Elite Dragonfly Review: A Super Stylish 2-In-1 Laptop
|
HP has equipped the Elite Dragonfly with a super interesting hybrid SSD with 32 GB of Optane flash in the typical M.2 2280 form factor. This drive has four lanes of PCI Express connectivity. We tested the drive using ATTO's Disk Benchmark, which is a relatively quick and dirty test that reports maximum read and write speeds for a variety of block sizes.
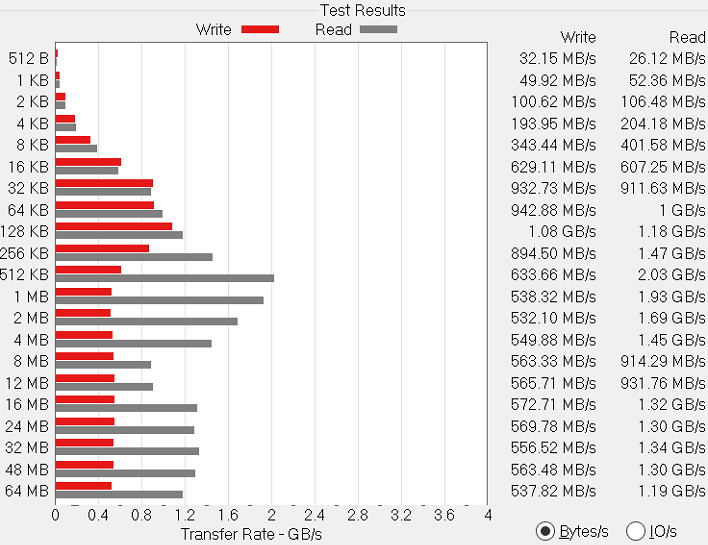
The results are mixed, and lower than anticipated. Since the Optane cache is so large, we expected that both reads and writes of the same chunks of data repeatedly would be a cinch for this drive. The result is more of a mixed bag, with performance actually regressing later in the run. Reads are plenty fast enough, but write performance of just 500 MB per second is far less than what we would have expected. Since the SSD and Optane cache are on the same gumstick, they're splitting the four lanes of PCIe connectivity they share, which halves the available bandwidth to memory pool.
|
We recently moved on to BrowserBench.org's Speedometer test, which takes a holistic look at web application performance. This test automatically loads and runs several sample webapps from ToDoMVC.com using the most popular web development frameworks around, including React, Angular, Ember.js, and even vanilla JavaScript. This test is a better example of how systems cope with real web applications, as opposed to a pure JavaScript compute test like JetStream. All tests were performed using the latest version of Chrome.
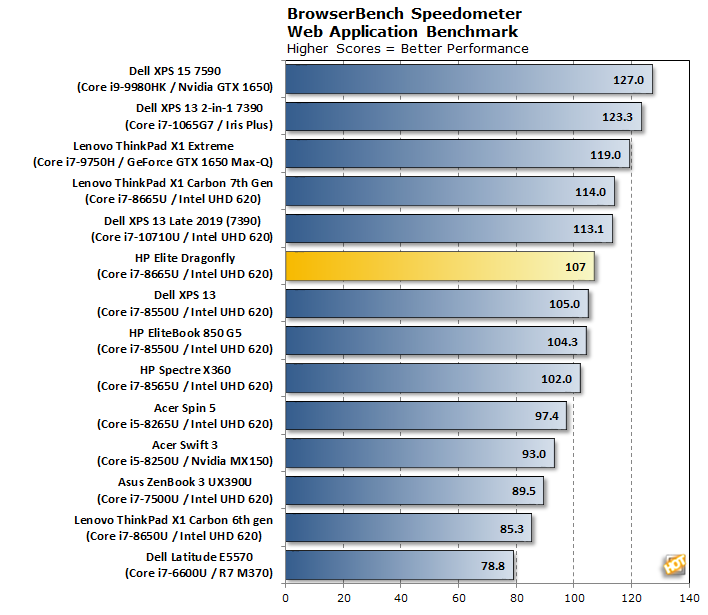
Much like most JavaScript browser-based performance tests, Speedometer is a lightly-threaded load that benefits from high IPC and high performance in lightly threaded loads. The Elite Dragonfly lands right where we'd expect it to be, towards the upper echelon of 8th-generation systems. The older chip with fewer hardware cores doesn't seem to hold the system back in this lightly-threaded load. The Elite Dragonfly also finds itself within arm's reach of the 10th-generation Ice Lake processor inside the XPS 13 2-in-1.
|
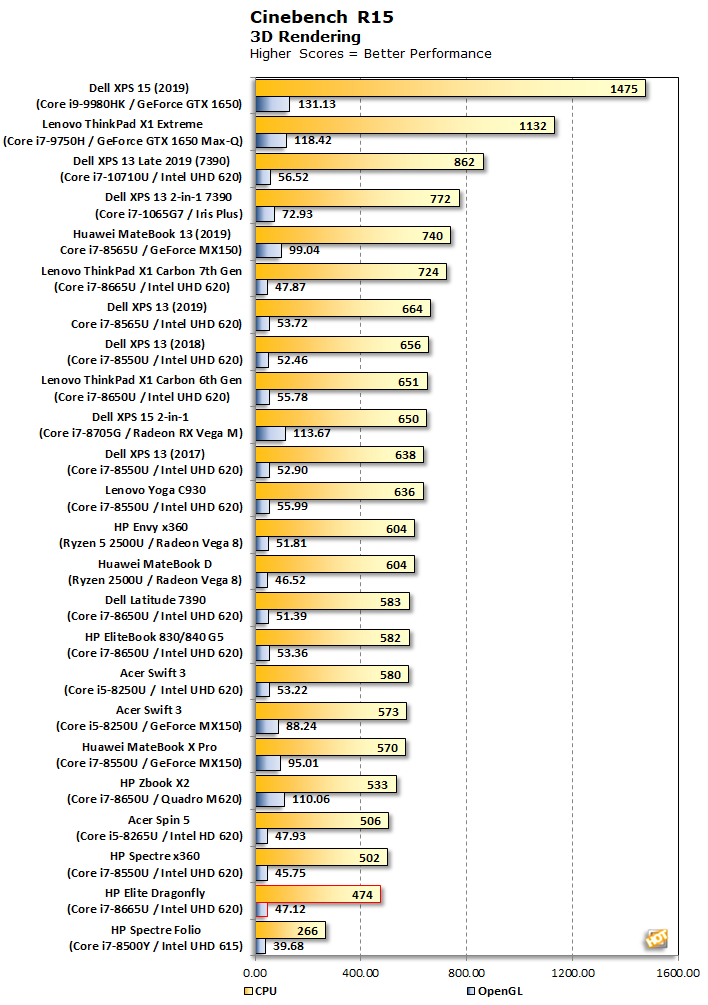
The CPU test of Cinebench R15 doesn't take all that long to finish even for the slower CPUs in this group. As a result the test rewards high maximum turbo speeds across as many cores as the CPU can muster. Unfortunately, the Elite Dragonfly seemingly stumbled in this benchmark, and finds itself near the very bottom of the pack, only beating out the dual-core HP Spectre Folio.
The OpenGL portion of the test is far less exciting, as the UHD 620 integrated GPU is a known quantity by the year 2020, and unfortunately its age is showing in a big way. the Elite Dragonfly slots in right where it should in the real-time rendering portion of this test, but unfortunately, that's clustered at the bottom with the rest of the systems with the aging graphics tech. Scoring lower than 50 frames per second doesn't cut it when Intel's newer GPU tech can add 50% to that frame rate.
The latest version of Maxon's rendering benchmark, Cinebench R20, takes longer to complete, so this is a better test of the Elite Dragonfly's cooling system. This release also drops the OpenGL test, making Cinebench a pure CPU benchmark this time. We tested both single-threaded and multi-threaded performance.
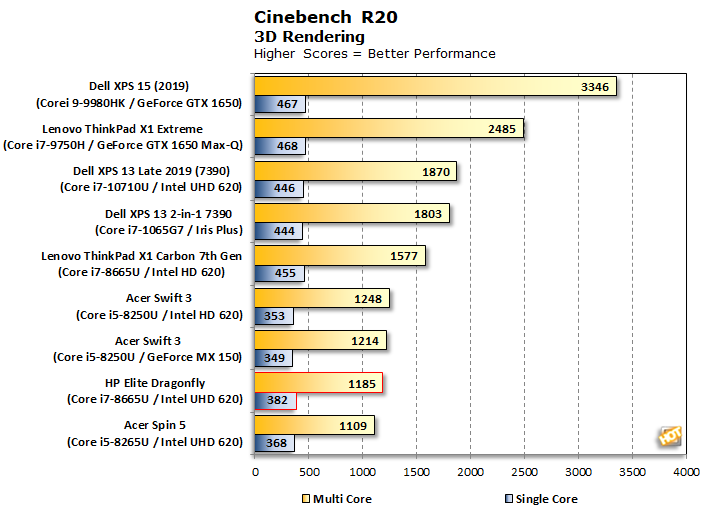
There's a very wide cross-section of CPUs in our results, and the Elite Dragonfly again didn't score particularly well. This time around, systems with 8th-gen Core i5s, which have lower overall maximum boost clocks and a bit less cache than our contender, scored higher. The ThinkPad X1 Carbon, which has the closest configuration of our group, beat the Elite Dragonfly by a whopping 33%. So far we're not off to a great start on multi-threaded tests, and we're starting to wonder if the Elite Dragonfly's lightweight cooling system is holding it back.
|
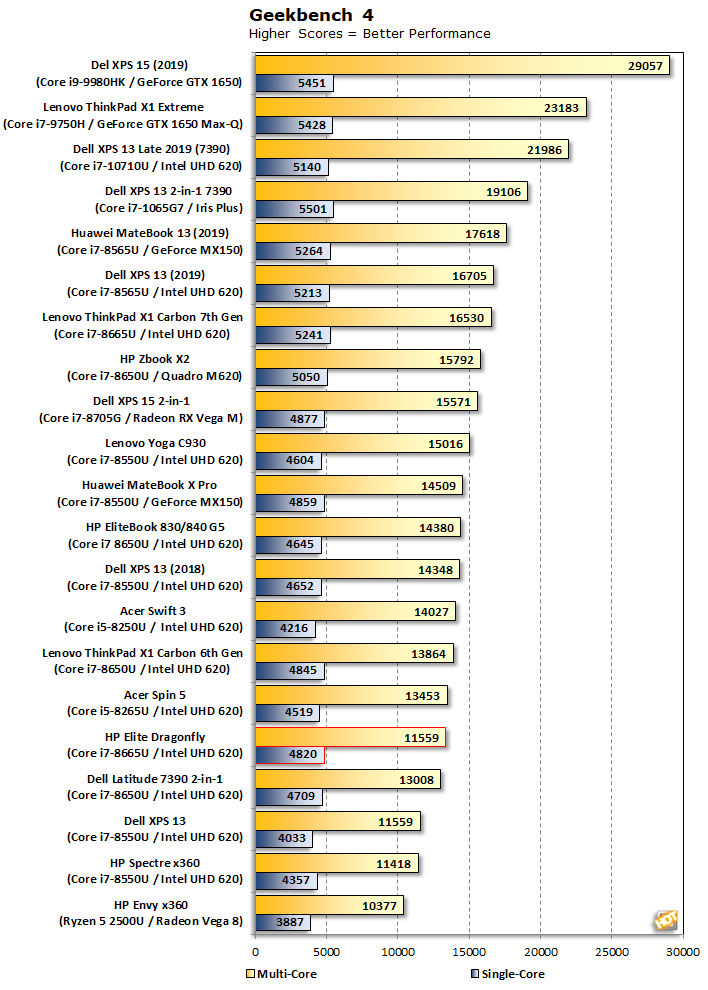
From a single-core perspective, the Elite Dragonfly's Core i7-8665U performed on par with similar systems in Geekbench. It lands just a few points below the ThinkPad X1 Carbon. On the multi-threaded side, performance isn't quite as rosy, as the Dragonfly trails the same ThinkPad by nearly a third once again. The HP system only scores a bit better than half as well as the XPS 13 2-in-1 with the Ice Lake-based Core i7-1065G7.
Geekbench 5 is the latest version of the Geekbench test suite which performs many of the same tests rewritten with the latest CPU architectures and features in mind. We've been slowly collecting these results over the last couple of months, and we finally have enough to share. Geekbench 5 results are not directly comparable with version 4 since the two apps use a different scale for their scores.
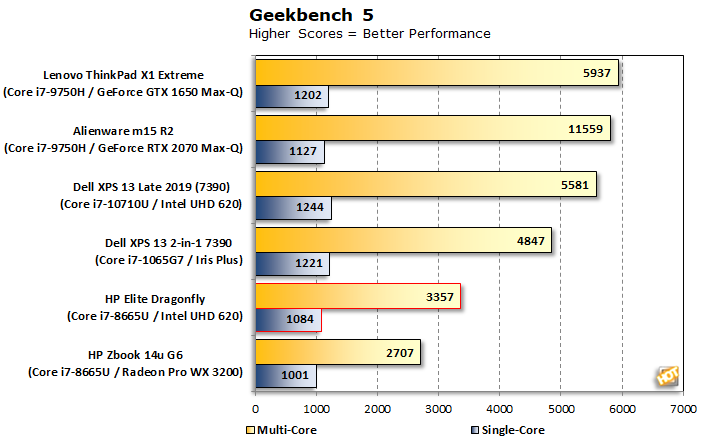
The Elite Dragonfly's older 8th-generation processor, lower TDP, and cooling systems again doesn't do it any favors. We haven't been keeping track of scores on the newer version of Geekbench long enough to have a lot of other 8th-generation systems on our list, but the next-best entrant is the XPS 13 2-in-1, which the Dragonfly trails in the single-threaded test by around 15%. The lands an even bigger win in the multi-threaded test, scoring half-again better than the HP.
|
Once again things are looking pretty rough for this HP system. Even the Acer Swift 3 and its Core i5-8250U takes home a win over the Elite Dragonfly, and that system lives in an entirely different price class altogether. The Elite Dragonfly is a pretty nice-looking system with tons of features, but for $2,000 we also expected much better performance than we've seen so far.
While the Elite Dragonfly is far from a gaming behemoth, we'll take a look at what traveling gamers will see in the comfort of their hotel rooms next...