Before running our benchmarks, we apply the latest Windows and driver updates to the system we are testing (in this case, the MSI GE76 Raider). Our system shipped with Windows 10 Home with the 20H2 update, but Windows Update never offered 21H1 for download. There was likely some component, driver or service that was blocking it, but we didn't force the issue due to time constraints. Other than that, we run all of our tests with out-of-the-box settings. Our goal is to test the system as it ships, but after auto-updating, to accurately reflect what buyers can expect from a retail experience. The big comparison here to watch is with the Alienware m15 R4, which has the same GPU, but an older 10th gen Intel Core processor
 |
| ATTO Disk Benchmark |
| Peak Sequential Storage Throughput |
|
The
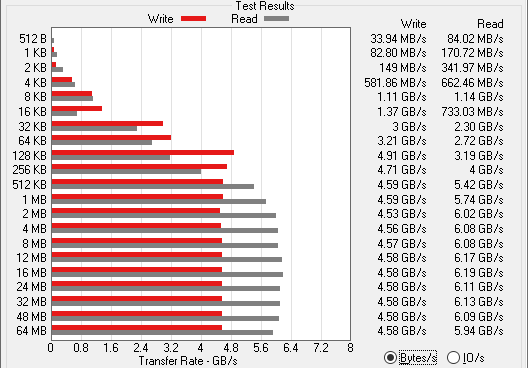
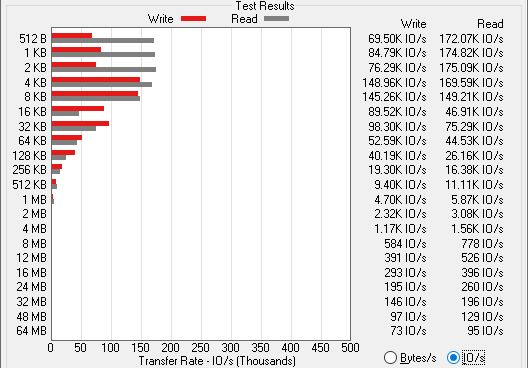
ATTO disk benchmark is a fairly quick and simple test which measures read/write bandwidth and IOPS across a range of different data sizes. While we don't typically compare these results across multiple machines, it's useful to gauge whether a particular notebook's storage subsystem is up to snuff.
The SSD in the GE76 Raider is a fast Samsung PM9A1 with 1TB of capacity riding the PCI Express 4.0 bus, with four lanes of connectivity. You can see we routinely eclipsed 6GB per second in reads once block sizes got up to 2 MB. Writing at 4.5 GB per second is also well into PCIe 4.0 territory, beating out the theoretical bandwidth afforded by PCIe 3.0 x4. The IOPs were just as impressive, hitting up over 170k per second on smaller block sizes. This kind of performance holds a lot of potential once games start using DX 12 Ultimate's Direct Storage API.
 |
| Speedometer Web Application Benchmark |
| Browser Performance |
|
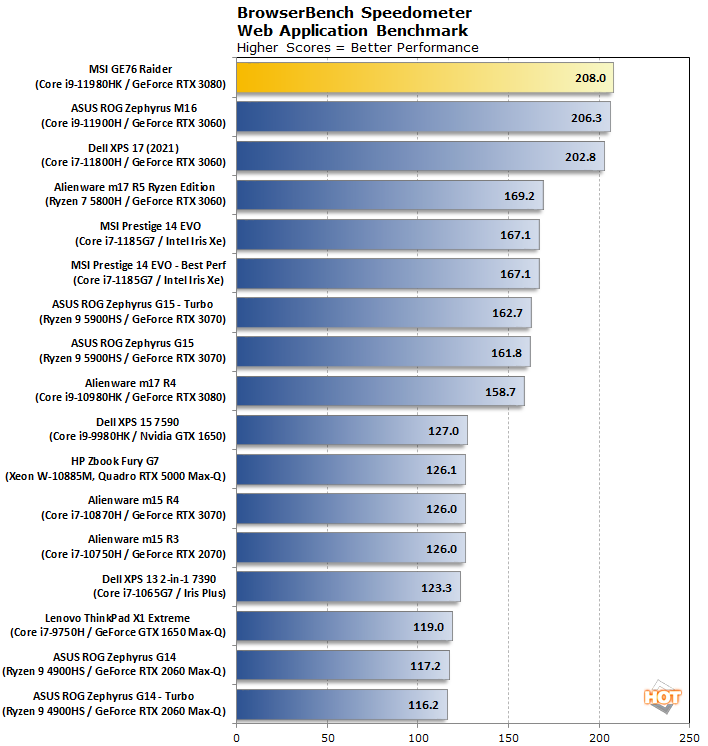
We use BrowserBench.org's
Speedometer test to gauge our web experiences, which takes a holistic look at web application performance. This test automatically loads and runs several sample web apps from ToDoMVC.com using the most popular web development frameworks around, including React, Angular, Ember.js, and even vanilla JavaScript. This test is a better example of how systems cope with real web applications, as opposed to a pure JavaScript compute test like JetStream. All tests were performed using the latest version of Chrome.
We're off to the races as the MSI GE76 turns in the fastest result we've ever captured in Speedometer. It doesn't win by a whole lot over the
ASUS ROG Zephyrus M16, but it's just enough to elbow its way to the top. The Core i9-11980HK has a maximum turbo clock of 5GHz, something that likely comes into play in a lightly-threaded loads like most web applications tend to be. It nearly doubles up on the fourth-gen Ryzen notebooks as well as laptops with Intel's own 9th-gen CPUs, though please keep in mind, there have been numerous browser and driver updates since we've tested some of the older machines, which would likely affect their scores.
|
|
Cinebench R23 |
| 3D Rendering Performance |
|
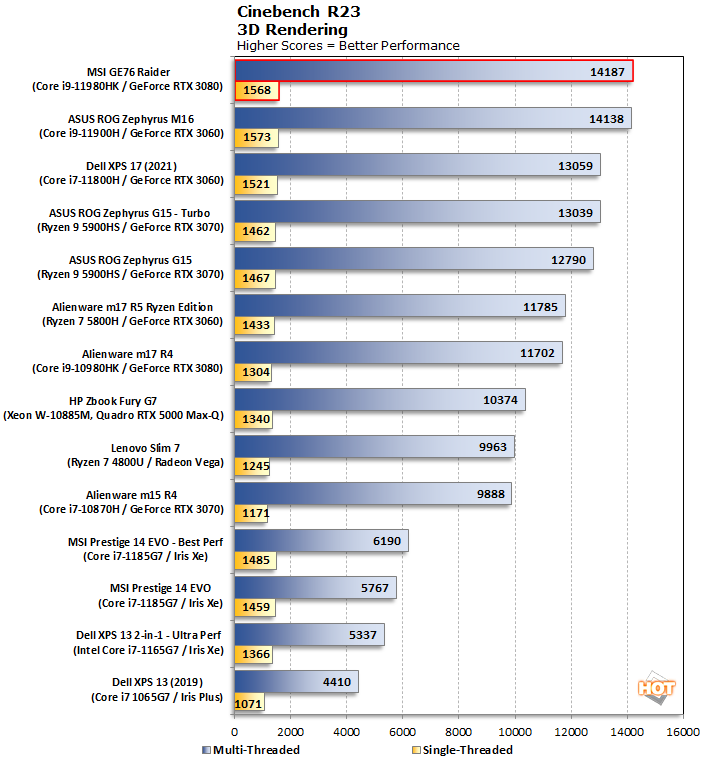
By now we've got enough results in the current version of Cinebench R23 that we feel the previous version, R20, is a bit redundant -- so we didn't run it here. This is the latest 3D rendering benchmark from Maxon, based on the Cinema 4D R23 rendering engine. We tested both single-threaded and multi-threaded performance while rendering the sample scene of an office with hardwood floors and a lot of glass in the windows.
The GE76 Raider makes short work of this test, once again just barely edging out the ASUS M16. The 2021 version of the
Dell XPS 17 9710 leads the next tier down, falling behind by around 7%. The MSI notebook is a world-beater so far, but rendering isn't the sort of thing we'd do with a laptop, versus a desktop with a higher TDP and hopefully more performance. It'll be very exciting to see how it performs once we get into typical laptop loads like productivity and gaming.
|
| Geekbench 5 |
|
Single and Multi-Core Performance |
|
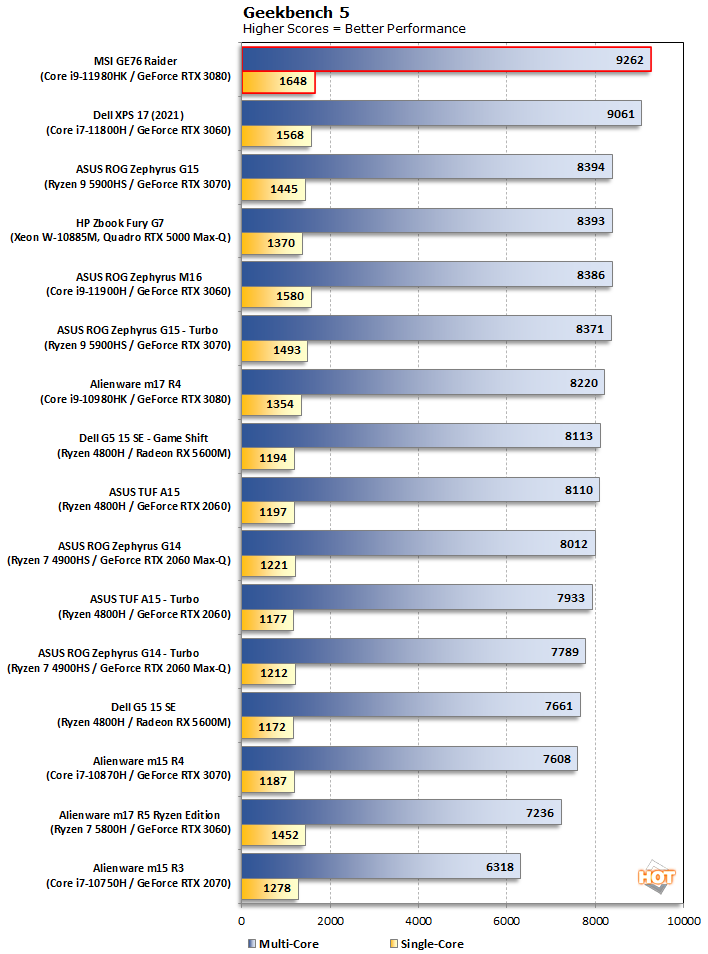
Geekbench is a cross-platform benchmark that simulates real world processing workloads in image processing and particle physics scenarios. We tested the notebooks featured here in Geekbench's single and multi-core workloads. It measures single-threaded performance allowing a single core to stretch its legs, and multi-threaded throughput to put all cores under a heavy load.
MSI's GE76 Raider once again, with the fastest Tiger Lake-H CPU around, sets some land-speed records in this synthetic benchmark. Make note of Tiger Lake-H's dominance here, as the competition from AMD including the
ASUS ROG Zephyrus G15 and its Ryzen 9 5900HS drop back around seven percentage points. That's not huge, but it's consistent.
|
| PCMark 10 |
|
Productivity and System-level Benchmarking |
|
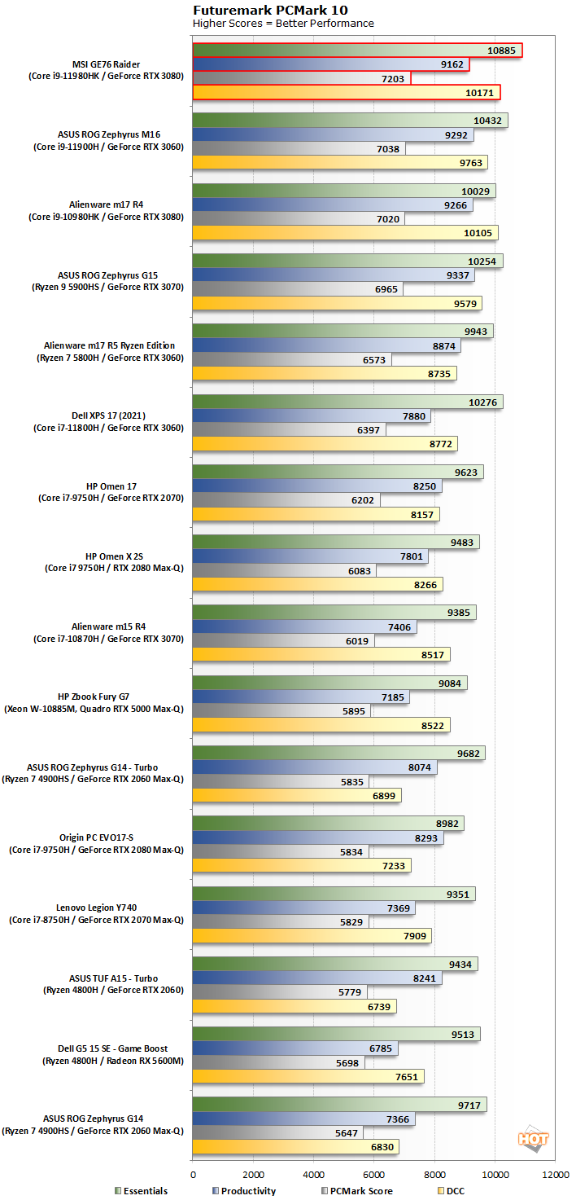
PCMark 10 uses a mix of real-world applications and simulated workloads to establish how well a given system performs productivity tasks, including image and video editing, web browsing, and OpenOffice document editing. While these scores appear to be all over the place, the systems are sorted by their overall PCMark score, which is the third (gray) bar in each cluster.
Actual productivity tests are also no problem for our test subject. We're once again setting records in PCMark's tests. The Digital Content Creation score for the GE76 Raider isn't the first time we've ever seen more than 10,000 in that particular subtest, though. That honor goes to the
Alienware m17 R4 with the Core i9-10980HK, although this MSI machine beats it out there by a smidge.
|
| 3DMark Benchmarks |
| 3D Performance |
|
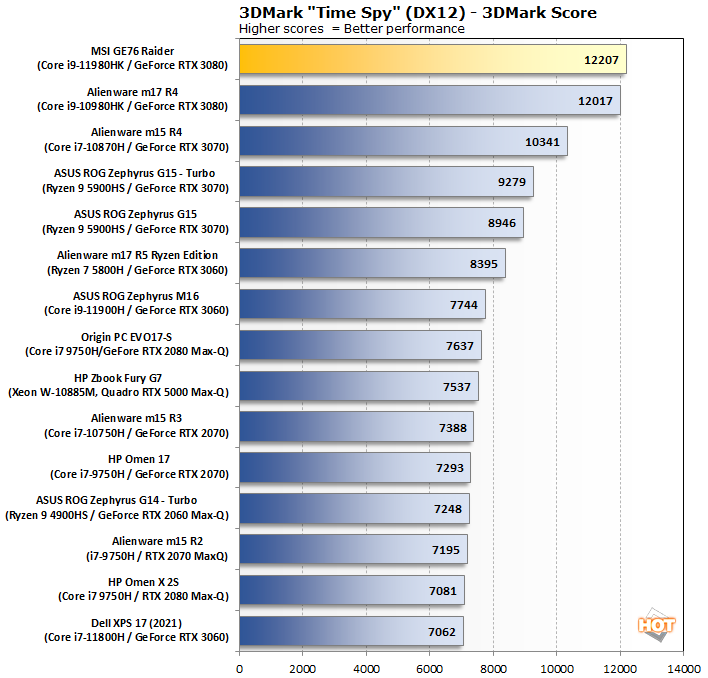
3DMark has several different graphics tests which focus on different types of systems. We start with Time Spy, which is 3DMark's headline benchmark. This test presents a pretty significant challenge for the system's CPU and GPU using DirectX 12's API...
Here, the
GeForce RTX 3080 inside the GE76 makes its presence known. Not only does it beat the m17 R4, but it also eclipses anything with a lower-tier GPU, like the Alienware m15 R4 with its GeForce RTX 3070. That's not at all unexpected; having the fastest GPU is a big leg up in gaming performance, but with all of the confusion surrounding mobile GPU TDPs, it's good to see MSI getting the most out of its implementation.
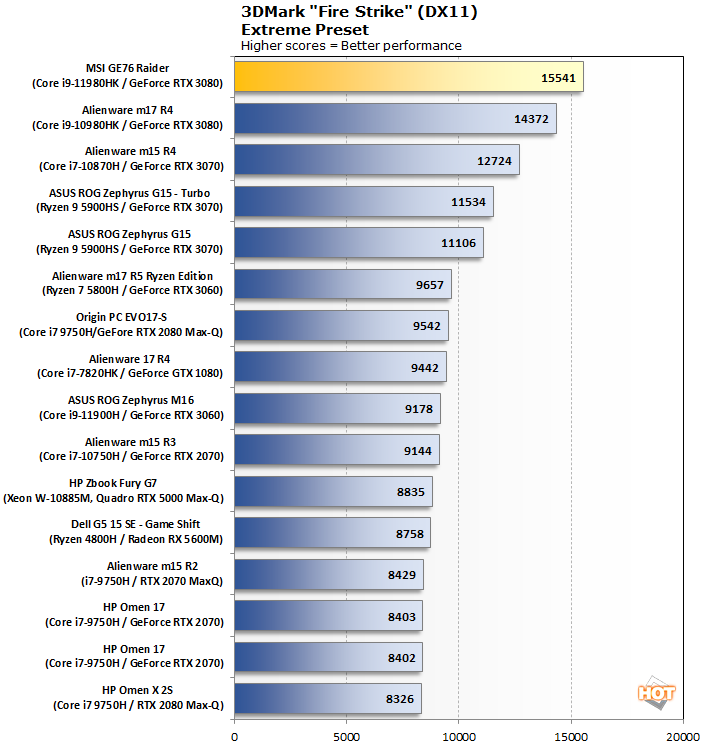
Next up, let's take a look at the Extreme preset for the punishing 3DMark Fire Strike test. This DirectX 11 test has been around for a while, but it's still pretty challenging.
Fire Strike Ultra is a pretty punishing test, but the GE76 Raider handles it with no problems. There are several big steps down at the top of our charts, and by the time we get to the
Alienware m15 R5 Ryzen Edition, the notebooks bunch up much more tightly. The MSI GE76 Raider is nearly 50% faster than that particular notebook, and pushes up to 80% faster than some of our older notebooks from a couple years ago.
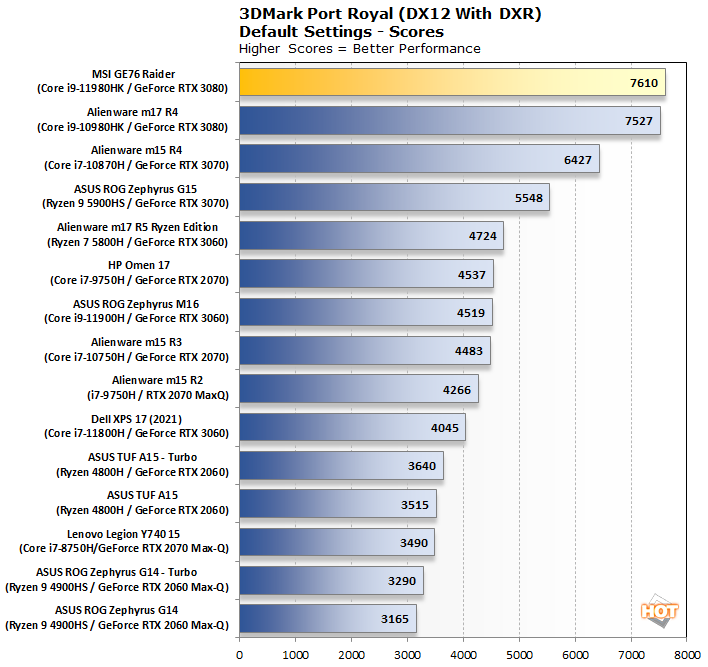
Lastly, the Port Royal test uses DirectX
Ray Tracing (DXR) to illuminate a scene...
DXR hardware is a prerequisite for this test, so the field is a little smaller. Still, the GE76 and its GeForce RTX 3080 lead the way. The test relies on the GPU for the vast majority of its work, so this Tiger Lake notebook doesn't really separate itself from the m17 R4. Both are ridiculously fast, and bury the rest of the competition though.
|
| Far Cry 5 |
| Gaming Performance |
|
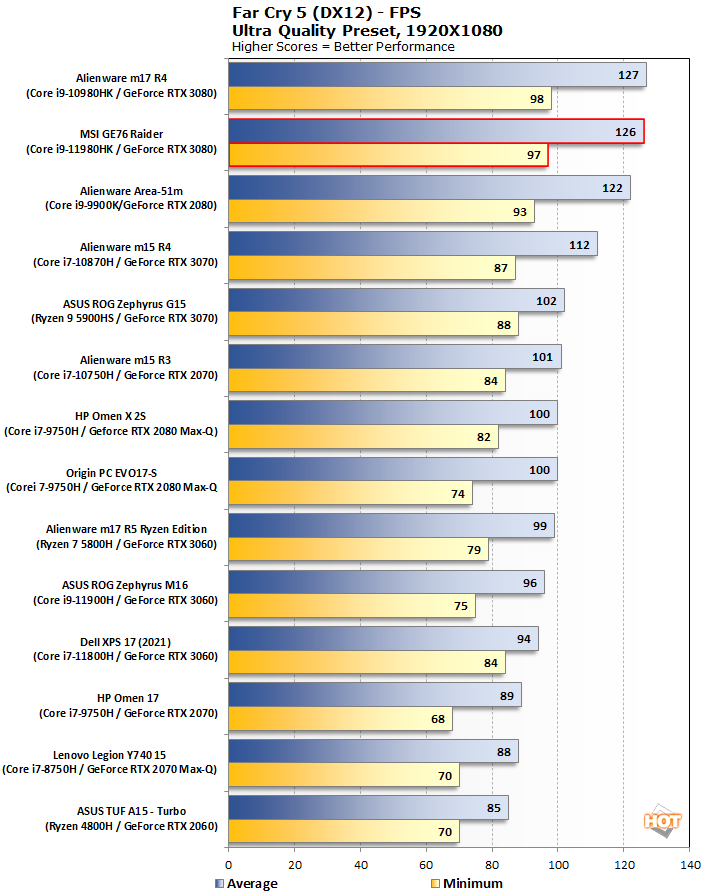
It's time for actual games, and we start with the latest current instance of a classic Ubisoft franchise. Far Cry 5 takes the franchise to Montana with lush environments and incredible graphics fidelity. We ran this laptop through the built-in benchmarks with Ultra Quality settings.
The GE76 loses out in the Far Cry 5 benchmark by a single frame per second to the Alienware m17 R4 on both the average and minimum frame rate. That's really nothing to fret, though. 120+ fps and very rarely dropping below 100 is pretty smooth by any definition and this game is known to be CPU limited on high-end GPUs.
|
| Gears 5 |
| Gaming Performance |
|
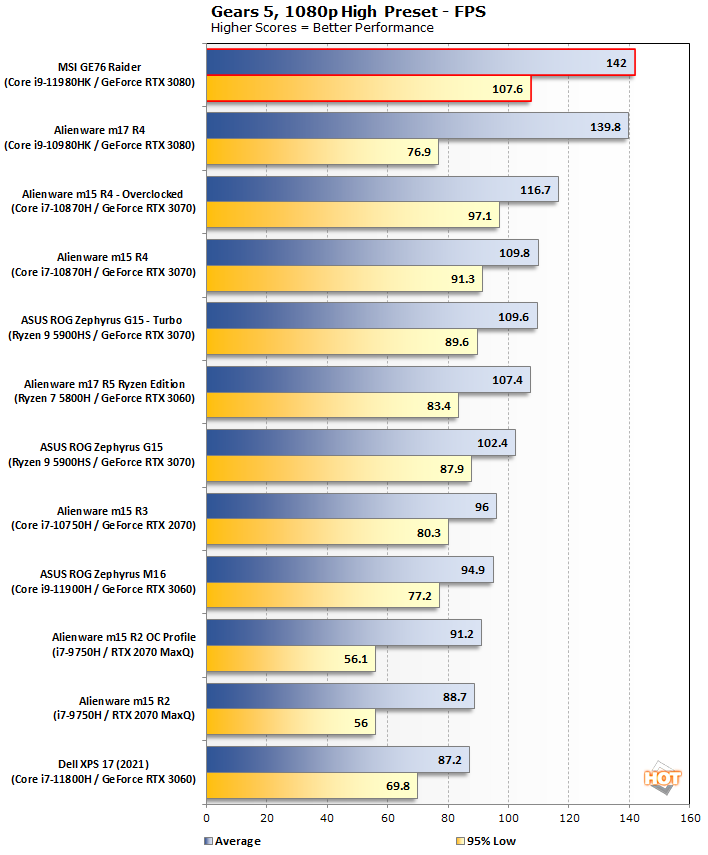
Gears 5 is a tremendously popular title on the Xbox and PC alike, and on top of looking great, it's a blast to play. Due to the relative newness of the game, we don't have a ton of notebooks represented, so we intermingled some desktop GPU results for reference. We used the High preset at 1920x1080, same as before, to test this game.
In
Gears 5, the GE76 Raider comes roaring back to take a win, especially a big 95% low win, over the Alienware and every other notebook here. A low frame rate of up over 100 fps is excellent, and Gears 5 just feels great to play on this system with its high-refresh display.
|
| Middle Earth: Shadow of War |
| Gaming Performance |
|
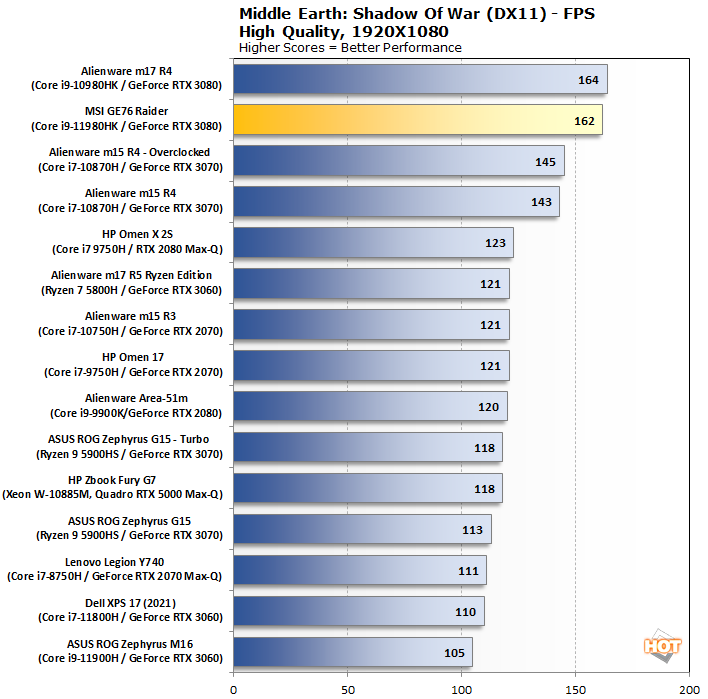
Middle Earth: Shadow of War is a fun and and beautiful title set in Tolkien's Lord of the Rings universe. To test the game's performance relative to other systems, we set the resolution to 1920x1080 and turned the visuals up to the High preset. The frame rates here are the average reported by the built-in benchmark.
Once again, Shadow of War sees the GE76 near the top. It does, however, lose out to the m17 R4. The GPU is the real performance limiter here, as we can clearly see tiers of performance, with the m15 R4 down a step and then the HP Omen X 2S down another step. There's not much to say other than performance is fantastic.
|
| Shadow of the Tomb Raider |
| Gaming Performance |
|
The finale in the rebooted
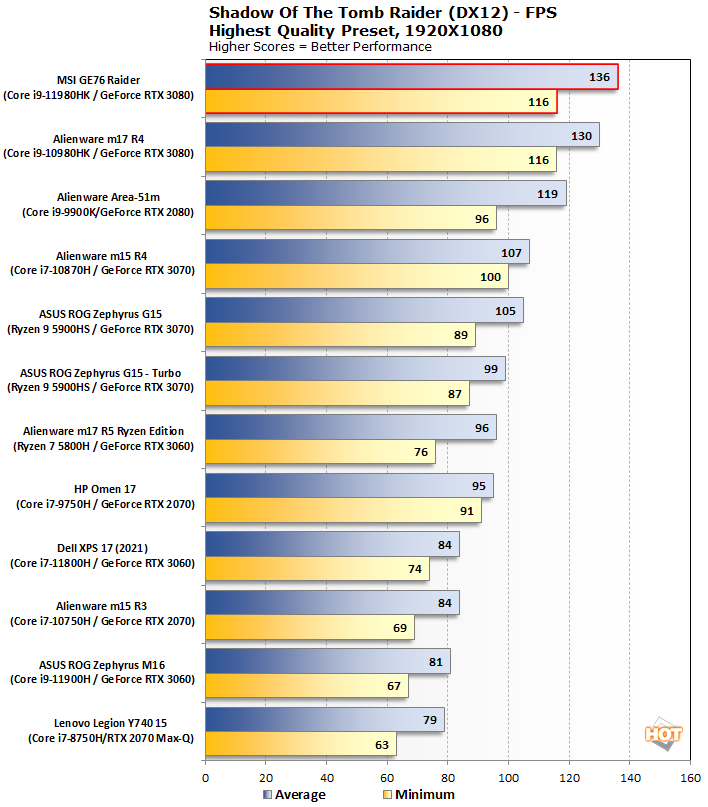
Tomb Raider trilogy, Shadow of the Tomb Raider is easily the best-looking of the bunch. It's also brimming with Tobii eye-tracking hardware support, and leading edge graphics technologies. To test this game out, we again turned the visuals up to High and tested at the Full-HD resolution of 1920x1080.
The conclusion of our gaming tests (and the conclusion of the
Tomb Raider trilogy) wind up with the GE76 once again in the pole position. The 116 fps minimum frame rate beats out the average of all but three of these notebooks, which is pretty astounding.
|
| Battery Performance |
|
Gaming and Video Playback Performance |
|
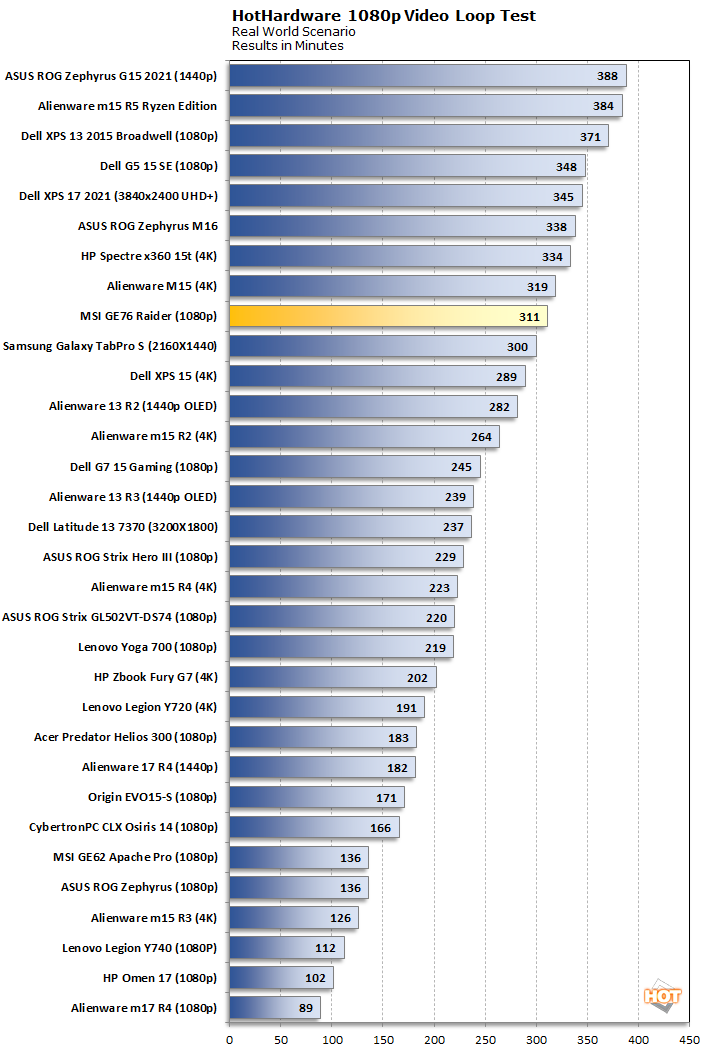
We run a custom 1080p HD video loop test developed in-house, to prove out battery life with our test group of machines. In all tests, Windows 10 Quiet Hours has been enabled and the displays are calibrated with lux meters on pure white screens to as close to 115 lux as possible. For the average laptop this is somewhere between a 40-60 percent brightness setting.
Video playback battery life on the GE76 is fairly good, but it trails many of its contemporaries by around 10% or more. 310 minutes works out to just over five hours, which is a decent time for a machine with this kind of horsepower, but the GPU should be sitting idle and the system has a 99.9 Whr battery. That's as big as it gets in a laptop that can still get on an airplane thanks to FAA regulations, so there's nothing more to squeeze out of it.
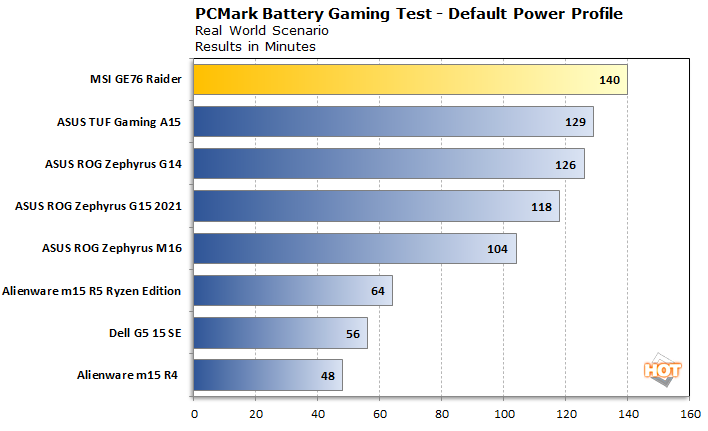
Let's see how it handles gaming battery life via PCMark's Gaming test.
While performing this test, we noticed that the MSI GE76 locks the Fire Strike graphics portion of this benchmark in at exactly 30 frames per second when the system is running on battery power. Like other gaming notebooks, that means the system is severely limiting performance to conserve juice, and it seems to have paid off with an hour and 40 minutes of runtime, right on the nose. After the test was over, we recharged the system and fired up
Gears 5 to run its benchmark. Sure enough, performance was also locked to exactly 30 fps. The same was true for
Far Cry 5.
Obviously 30 frames per second is not the ideal framerate all the time, but it's definitely playable when there are no dips below that. It seems like MSI made the decision to tune the default power and performance profile to frame rates rather than a specific power limit under battery load. That's a useful way to extend battery life as long as possible without negatively impacting the experience much. Most gamers aren't going to be playing a lot of sessions away from the included 250 Watt charger or a wall outlet, so this seems like a good strategy. The result is that the fastest laptop in our test suite also happened to have the best gaming battery life, which is truly the best of both worlds.
Next up, let's tear this puppy down to see how it keeps cool, and then render our final verdict.