Core Ultra 9 285K And Ultra 5 245K Review: Intel Arrow Lake Tested
When the Windows installation was complete, we installed all of the drivers necessary for our components, disabled auto-updating and OneDrive, and installed all of our benchmarking software. When that process was done, we performed a disk clean-up, cleared any temp and prefetch data, processed idle tasks, and optimized all of the SSDs using Windows' built-in tools. Finally, we enabled Windows Focus Assist to minimize any potential interruptions and let the systems reach an idle state before invoking any tests.
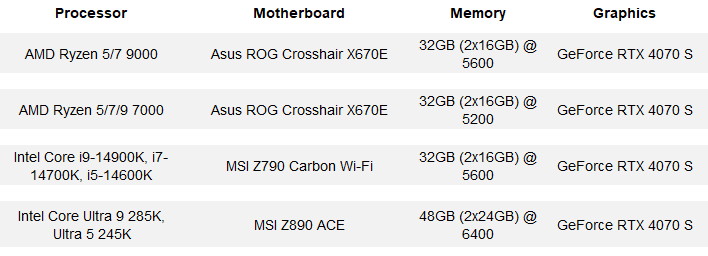
HotHardware's Test Systems:
SiSoft SANDRA 2023 Benchmarks
We began our testing with the latest version of SiSoftware's SANDRA 2021, the System ANalyzer, Diagnostic and Reporting Assistant. We ran a couple of the built-in sub-system tests that partially comprise the suite with the new Intel Core Ultra 200S series processors (CPU Arithmetic and Multimedia). All of the scores reported below were taken with the CPUs running at their default settings, with 48GB of DDR5 CUDIMMs running at an effective 6,400MHz, in dual-channel mode, on the MSI MEG Z890 Ace motherboard.
SiSoft SANDRA hasn't been updated in a while, and doesn't properly support Arrow Lake, so we didn't run our usual array of tests with it. The utility didn't populate reference data properly and the memory bandwidth test failed to run with CU-DIMMs installed in the system. As such, we're only showing the CPU related tests here. The Core Ultra 5 245K achieved over 977GIPS and 358.2GLOPS in the arithmetic test, while the Ultra 9 surpassed 1573GIPS and 606GFLOPS. In the multimedia test, the Core Ultra 5 245K broke the 1066GPix/s mark, and the Ultra 9 245K 1692.7GPix/s.
 Core Ultra 5 245K Processor Arithmetic |
 Core Ultra 5 245K Multi-Media |
 Core Ultra 9 285K Processor Arithmetic |
 Core Ultra 9 285K Multi-Media |
SiSoft SANDRA hasn't been updated in a while, and doesn't properly support Arrow Lake, so we didn't run our usual array of tests with it. The utility didn't populate reference data properly and the memory bandwidth test failed to run with CU-DIMMs installed in the system. As such, we're only showing the CPU related tests here. The Core Ultra 5 245K achieved over 977GIPS and 358.2GLOPS in the arithmetic test, while the Ultra 9 surpassed 1573GIPS and 606GFLOPS. In the multimedia test, the Core Ultra 5 245K broke the 1066GPix/s mark, and the Ultra 9 245K 1692.7GPix/s.
AIDA64 Memory Bandwidth, Memory Latency & Cache Latency
AIDA64's CPU Cache and Memory benchmarks measure memory bandwidth during read, write and copy operations, in addition to memory latency, and cache bandwidth and latency.

Core Ultra 200S processors support slightly faster memory (DDR5-5600 or DDR5-6400 with CUDIMMs), which results in higher bandwidth all around according to AIDA64, when comparing over previous-gen counterparts. Read, write and copy bandwidth were improved across the board, which you'd expect with higher-clocked memory.
Memory latency is another story altogether, though. With this first wave of CUDIMMs, clocks are nice and high, but they feature relatively loose timings. When configured with their default timings at the standard 6400MT/s, memory latency is measurably higher with the Core Ultra 200S processors we tested relative to every other platform.
L1 latency with the Core Ultra 200S series is roughly the same as the previous generation according to AIDA, but L2 and L3 latency is somewhat higher. Combine the high memory and L2 + L3 latency together, and the Core Ultra 200S series may not achieve the same level of responsiveness as Raptor Lake with some workloads that are particularly latency sensitive.
Memory latency is another story altogether, though. With this first wave of CUDIMMs, clocks are nice and high, but they feature relatively loose timings. When configured with their default timings at the standard 6400MT/s, memory latency is measurably higher with the Core Ultra 200S processors we tested relative to every other platform.
Geekbench v6.3 CPU Benchmark
The GeekBench CPU tests stress only the processor cores in a system (not the graphics card/GPU), with both single and multi-threaded workloads. The tests are comprised of encryption processing, image compression, HTML5 parsing, physics calculations and other general purpose compute processing workloads.
Intel's new Core Ultra 5 245K and Ultra 9 285K performed particularly well in Geekbench. The Ultra 9 takes the top spot with the best multi-threaded score we've ever recorded alongside a highly-competitive single-thread score that's right alongside AMD's best. The Ultra 5 245K also dispatched the previous-gen Core i5 and nearly caught the Ryzen 9 7950X.
UL PCMark 10 Applications Benchmarks
Next, up we have some full-system testing with PCMark. We're reporting all test results from the PCMark 10 Applications benchmark suite, which uses actual Microsoft Office applications, in addition to the Microsoft Edge browser. The workloads are specific to each Office application (Word, Excel, and PowerPoint), and the Edge tests simulates real-world web browsing.That relatively high memory and cache latency, coupled with support for fewer overall threads, pushes the Core Ultra 5 245K and Ultra 9 285K down the stack in PCMark 10.The Ultra 5 ended up trailing all of the other processors we tested, while the Ultra 9 landed just behind the Ryzen 9 9900X. Of course, all of these processors are more than capable of running Office applications, but the benchmark tool reveals the performance differences between the platforms.
Bapco Crossmark Benchmark
Crossmark is a cross-platform benchmark from Bapco that's available for Windows, Android, iOS and MacOS. Like PCMark, Crossmark measures overall system performance and using real-world applications. It provides an overall score based on the results of its Creativity and Productivity benchmarks and system responsiveness tests.The Core Ultra 5 245K and Ultra 9 285K fared much better in Crossmark, but were unable to catch their previous-gen counterparts. The deltas separating the platforms were quite small, though -- we suspect re-running this one with lower-latency memory would tip the scales in the Core Ultra's favor.
Browser & Web App Benchmarks: Jetstream 2.2 And Speedometer 3
Next up, we have some numbers from the Speedometer 2.0 and Jetstream 2 tests available at Browserbench.org. The Speedometer Benchmark Suite uses a wide array of latency and throughput benchmarks to evaluate web application performance, while Jetstream evaluates Javascript and WebAssembly performance; both tests take all of their individual results and tabulate them into a final score.
These benchmarks measure performance of an array of browser-based technologies used on modern, rich web applications. Scores in these benchmark are an indicator of the performance users would see when browsing the web and running advanced web apps. All of the systems were tested using the latest version of Google Chrome, with default browser settings, on a clean, fully-updated install of Windows 11.
The Core Ultra 5 245K and Ultra 9 285K were once again able to overtake their previous-gen counterparts in the Speedometer test, and put up competitive numbers. In the more focused Jetstream test, the Ultra 9 gives way to the Core i9-14900K, but the Ultra 5 ekes out a victory against its own predecessor.
These benchmarks measure performance of an array of browser-based technologies used on modern, rich web applications. Scores in these benchmark are an indicator of the performance users would see when browsing the web and running advanced web apps. All of the systems were tested using the latest version of Google Chrome, with default browser settings, on a clean, fully-updated install of Windows 11.
7-Zip Data Compression / Decompression Tests
The 7-Zip benchmark measures compression and decompression performance using the LZMA method, which leverages the Lempel–Ziv–Markov chain algorithm to perform lossless data compression. The benchmark produces a final rating in GIPS (giga instructions per second).
With fewer threads at their disposal, the Core Ultra 5 245K and Ultra 9 285K trail somewhat in the highly-threaded 7-Zip compression and decompression tests. Performance is still good, and competitive in their respective classes, but the Core Ultra 5 245K and Ultra 9 285K don't offer the same kind of throughput here.
With fewer threads at their disposal, the Core Ultra 5 245K and Ultra 9 285K trail somewhat in the highly-threaded 7-Zip compression and decompression tests. Performance is still good, and competitive in their respective classes, but the Core Ultra 5 245K and Ultra 9 285K don't offer the same kind of throughput here.