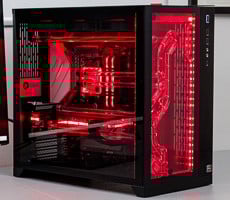
Dell XPS 630 Gaming Desktop System
|
POV-Ray, or the Persistence of Vision Ray-Tracer, is an open source tool for creating realistically lit 3D graphics artwork. We tested with POV-Ray's standard included benchmarking model on all of our test machines and recorded the scores reported for each. Results are measured in pixels-per-second (PPS)throughput.

This benchmark has options for testing a single CPU, or All CPUs, of which we chose the latter to show the benefits of a Dual or Quad Core processor. As the Core 2 Quad has double the number of cores than our Core 2 Duo, we would expect that the rendering output would also be double and that's almost exactly what we got.
|
Cinebench R10 is an OpenGL 3D rendering performance test based on Cinema 4D. Cinema 4D from Maxon is a 3D rendering and animation tool suite used by 3D animation houses and producers like Sony Animation and many others. It's very demanding of system processor resources and is an excellent gauge of pure computational throughput. This is a multi-threaded, multi-processor aware benchmark that renders a single 3D scene and tracks the length of the entire process. The time it took each test system to render the entire scene is represented in the graph below, listed in seconds.

By the same token, Cinebench R10 can put all cores to use when rendering its own images, and we expected the same results that we received with POV-Ray. The single CPU tests were very close, with the 2.4 GHz Q6600 just slipping by the 2.33GHz E6550. Multi-threaded testing didn't exactly double the score for the XPS 630, but it was close enough.


