Dell XPS 15 9500 Review: A Case Study In Laptop Excellence
|
We will start our benchmarking with a heavy content-creation workload to see how the XPS 15 9500's eight-core Intel Core i7-10875H stacks up. The latest version of Maxon's rendering benchmark, Cinebench R20, takes some time to complete, so this is a good test of the XPS 15's cooling system as well. This release also drops the OpenGL test, making Cinebench purely a CPU benchmark. We tested both single-threaded and multi-threaded performance here.
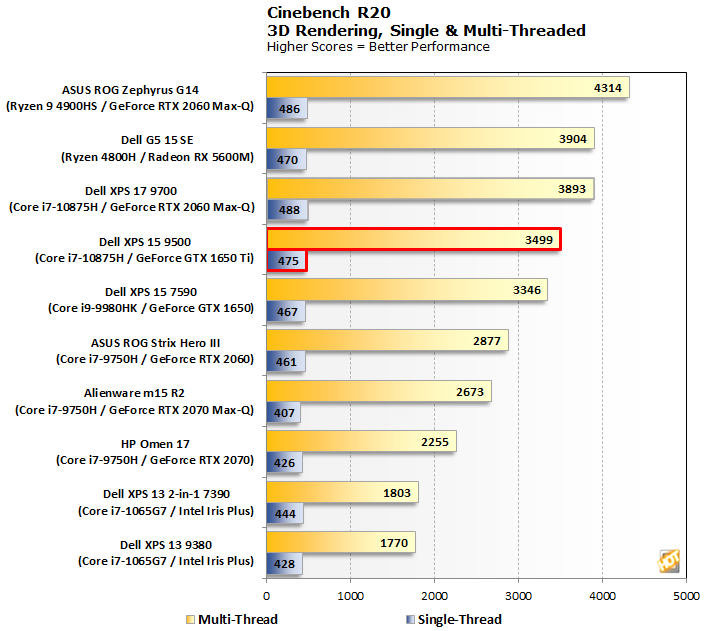
The XPS 15 9500 positioned itself roughly where we anticipated it would land, with a single-core score of 475 and a multi-core score of 3,499. However, it fell behind the larger XPS 17 9700 with the same processor, and we suspect it is because the bigger form factor offers a slight advantage in cooling. It did not take long for the XPS 15 to throttle the CPU, and at about three-quarters of the way through the multi-core test, the Core i7-10875H was running only a few hundred megahertz faster than its base clock.
Interestingly enough, the top two spots belong to AMD and its latest generation Ryzen 4000 mobile series. Whereas Dell's XPS 17 9700 with a Core i7-10875H and G5 15 SE with a Ryzen 7 4800H were nearly tied with one another in the multi-core portion of Cinebench R20, the XPS 15 9500 lagged just a little behind.
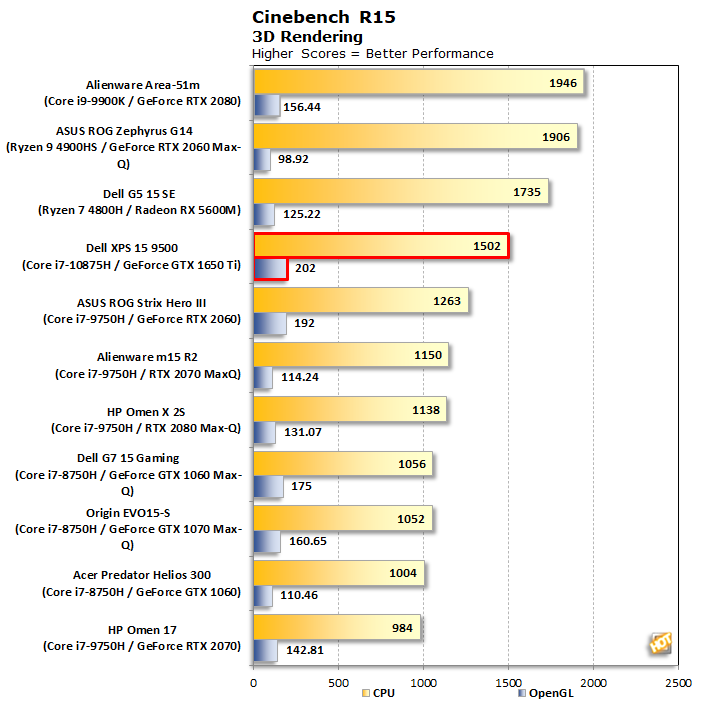
We also ran Cinebench's older R15 benchmark just for good measure. In this one, the XPS 15 9500 slotted in accordingly, outpacing previous generation laptops with a Core i7-9750H, but not quite catching the G5 15 SE with its Ryzen 7 4800H.
|
We also stepped through Geekbench 5 for another look at CPU performance. Geekbench 5 is a cross-platform benchmark that simulates real world processing workloads in image processing and particle physics scenarios. We tested the Dell XPS 15 with Geekbench 5’s single and multi-core test workloads.
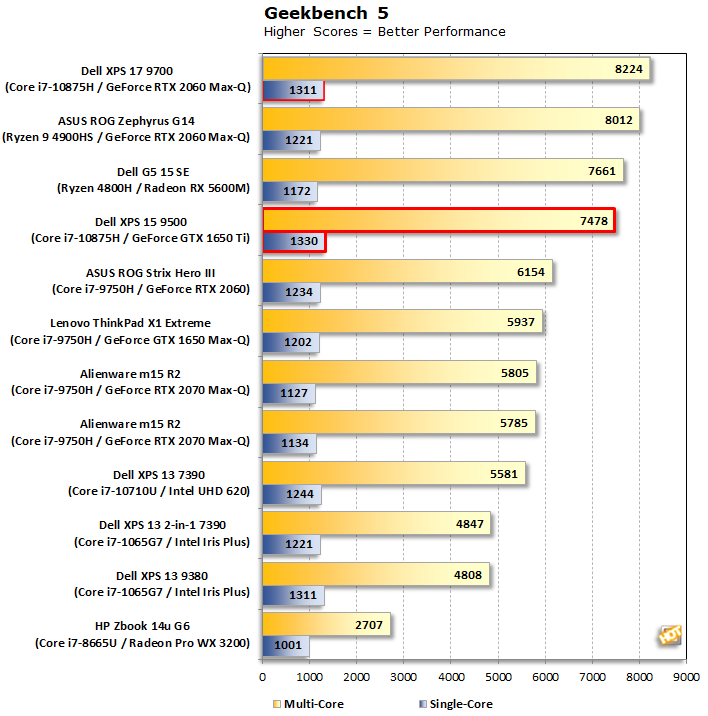
Geekbench 5 painted the same general picture as Cinebench. We see strong single-core performance from the XPS 15 9500, with it having the highest score of the bunch, but it again comes up short of catching the XPS 17 9700 that has the same CPU. These are still strong performance metrics we are looking at, just that the trade off for a smaller form factor is thermal management and the small performance hit that comes with it.
|
Running ATTO allows us to gauge the speed of the storage drive in the XPS 15 9500, which is sporting a 512GB SK Hynix PC611 NVMe M.2 solid state drive. It is a fairly quick and simple test that measures read/write bandwidth and IOPS across a range of different data sizes. While we don't typically compare these results across multiple machines, it is useful to gauge whether a particular notebook's storage subsystem can handle being put under pressure.
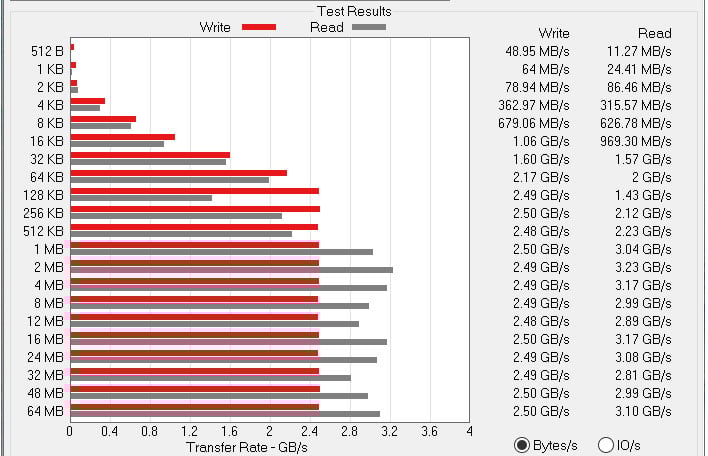
The SK Hynix PC611 is a speedy drive, as evidenced by its run in ATTO. Sequential read performance peaked at 3.23GB/s (3,230MB/s), while write performance climbed to 2.5GB/s (2,500MB/s). There are faster PCIe 3.0 SSDs on the market, but these are very good metrics overall, with reads that are around five and a half times faster than a typical high performance SATA SSD, and writes that are around four and a half times faster.
|
PCMark 10 uses a mix of real-world applications and simulated workloads to establish how well a given system performs productivity tasks, including image and video editing, web browsing, and OpenOffice document editing. While these scores appear to be all over the place, the systems are sorted by their overall PCMark score, which is the third (gray) bar in each cluster.
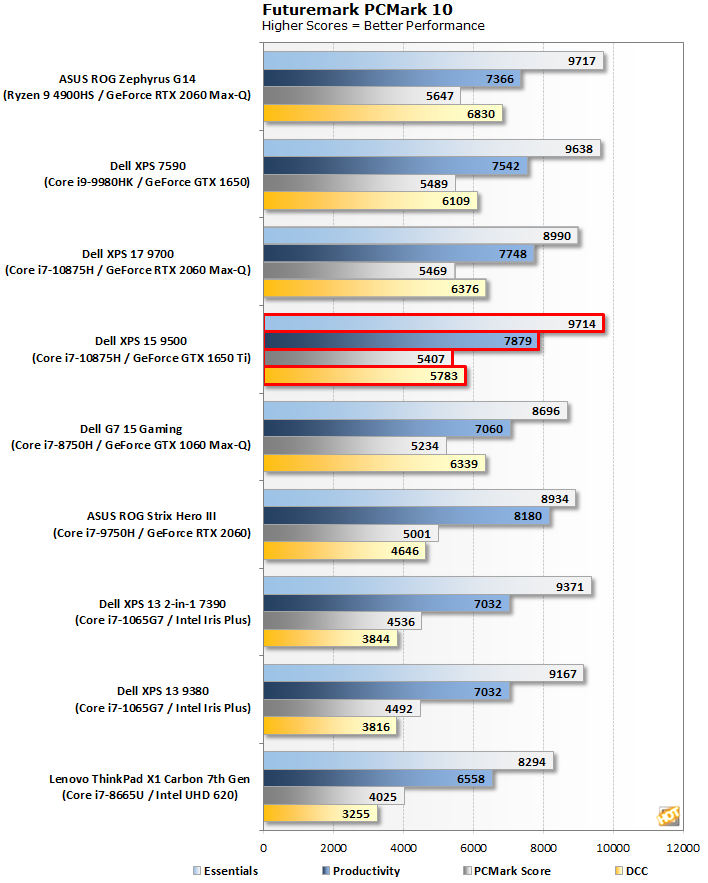
The XPS 15 and XPS 17 performed almost identically to one another in PCMark 10, placing around the upper-middle of our pack here. It performed particularly well in the Essentials test, where it virtually tied the ASUS Zephyrus G14, which has a meatier CPU and GPU.
Now we will turn our attention to the XPS 15’s graphics performance...


