Dell XPS 13 (2026) Review: Intel Wildcat Lake Challenges Apple Efficiency
by
Marco Chiappetta
—
Wednesday, September 16, 2026, 02:00 PM EDT
Dell XPS 13 - Image: HotHardware
To evaluate the Dell XPS 13 (2026)’s real-world capabilities, we ran our usual mix of browser, productivity, content creation, AI, graphics, gaming and battery benchmarks, and compared the system's performance to an array of machines we've recently tested (or re-tested), including a MacBook Neo where possible. Not all tests are cross-platform, so it's not possible run every benchmark you can run on a Windows machine on Macs.
ATTO Disk Benchmark Results For The Dell XPS 13 (2026)
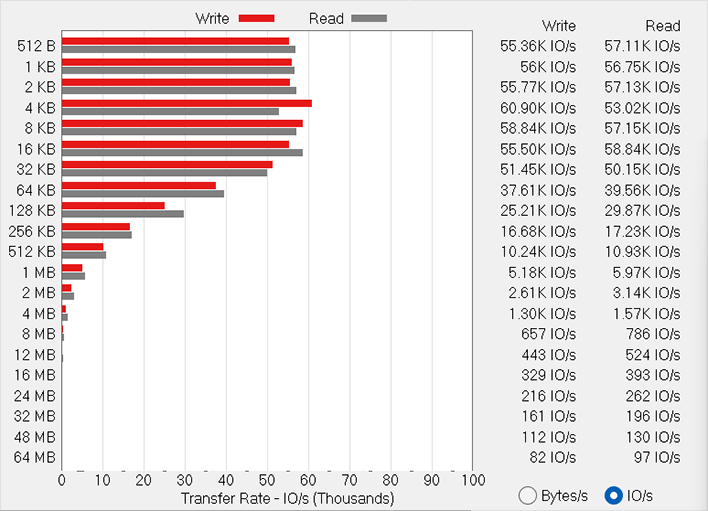
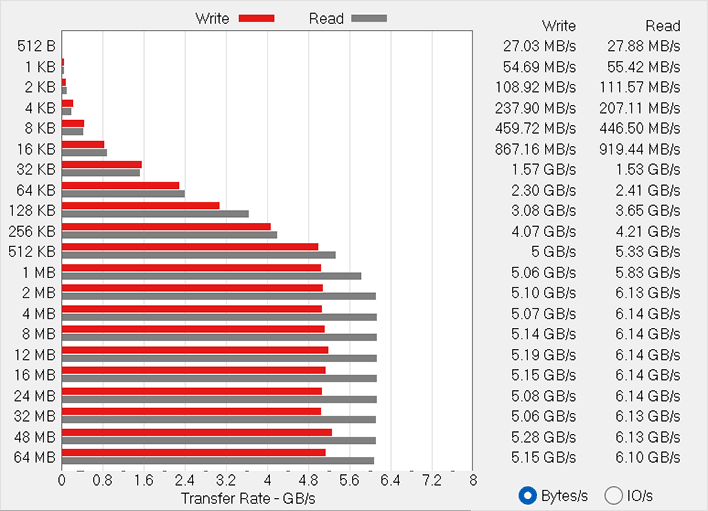
We'll start off with ATTO, a quick and dirty test that measures read/write bandwidth and IOPS across a range of different data transfer sizes. While we don't typically compare these results across multiple machines, it's useful to gauge whether a particular notebook's storage subsystem is up to snuff.
ATTO Disk Benchmark Dell XPS 13 - Image: HotHardware ATTO Disk Benchmark Dell XPS 13 - Image: HotHardware
The Wildcat Lake-powered Dell XPS 13 we tested features a Gen 4 SK Hynix NVMe SSD that consistently performed well, peaking at over 6GB/s in the read tests and over 5GB/s in the write test. This SSD seems well suited for everyday computing tasks and general use, and it's likely quite power efficient too--as you'll see when we get to the battery life benchmarks.
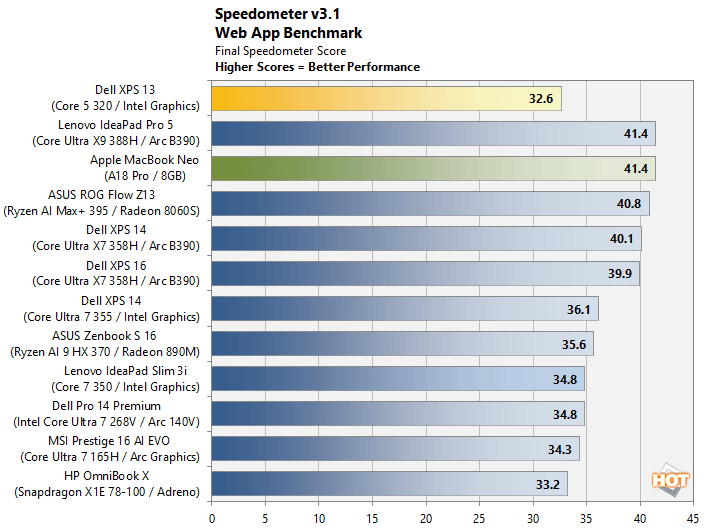
We use BrowserBench.org's Speedometer test to take a holistic look at web application performance. This test automatically loads and runs a variety of sample web apps using the most popular web development frameworks around, including React, Angular, Ember.js, and even simple JavaScript. This test is an example of how systems cope with real-world, modern web apps. All tests were performed using the latest version of Chrome.
The Dell XPS 13 trailed all of the other systems we tested in this browser-based benchmark, including the Wildcat Lake-based Lenovo IdeaPad Slim 3i. The IdeaPad, however, features a slightly higher clocked chip (Core 7 350 vs. Core 5 320), which helps with the short, bursty single-threaded workloads in this test. The Dell XPS 13's score isn't bad---web browsing is absolutely no problem on this machine--it's just not as fast as the other platforms, including the MacBook Neo.
Geekbench v6.5 CPU Benchmark
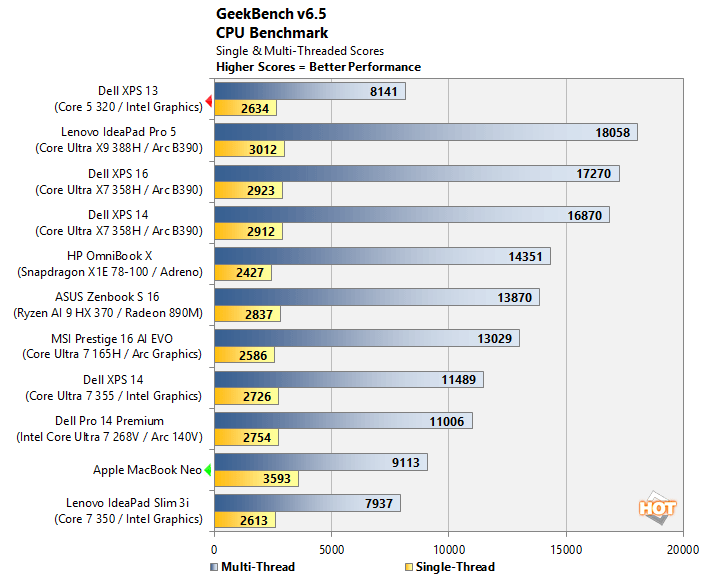
The Geekbench CPU tests stress only the processor cores in a system (not the graphics card/GPU), with both single and multi-threaded workloads. The tests are comprised of encryption processing, image compression, HTML5 parsing, physics calculations and other general purpose compute processing workloads.
The Dell XPS 13 trailed most of the pack in GeekBench as well, but there was an interesting role reversal. The Lenovo IdeaPad Slim 3i should have outpaced the XPS 13 here, but didn't. We suspect the superior cooling solution and some additional tuning by Dell helped nudge the XPS 13 ahead.
Cinebench 2026 Benchmark Results With The Dell XPS 13 (2026)
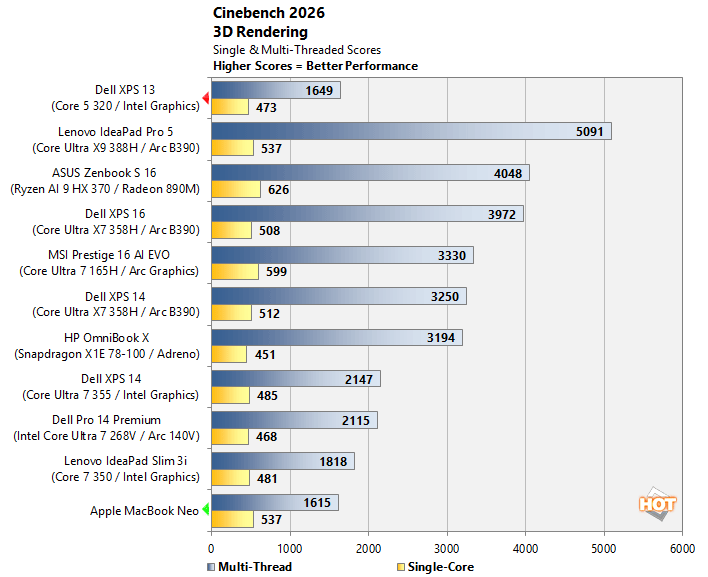
Next up is the latest-generation 3D rendering benchmark from Maxon, based on the Cinema 4D rendering engine. We ran the CPU-based test that doesn't make use of the graphics processor or NPU at all, which scales very well with additional CPU cores. We ran both single- and multi-threaded tests on all of the machines in the charts.
The Dell XPS 13 trailed most of the pack in Cinebench as well, which is to be expected. That said, If we focus on the multi-threaded benchmark, the Dell XPS 13 slots in just behind the Lenovo IdeaPad Slim 3i, but ahead of the MacBook Neo. The Neo, however, put up the superior single thread score.
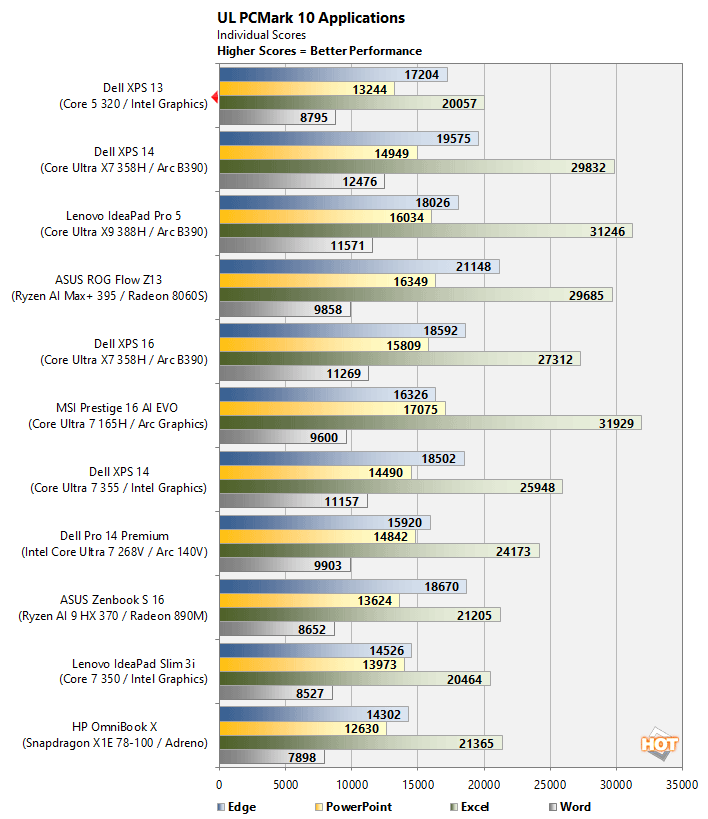
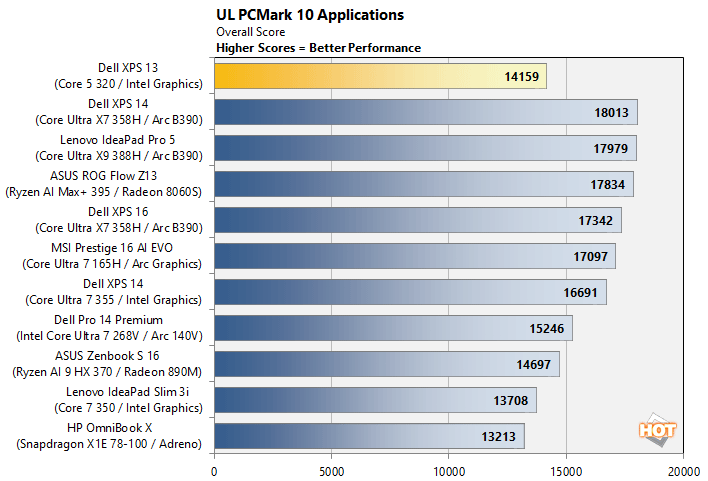
The PCMark 10 Applications benchmark measures performance in the Microsoft Office suite, as well as in the Edge browser, offering native instruction set-compatible versions of the apps for optimal performance across a wide variety of workloads in tools office workers, students and home users utilize every day. The following results should show a view of performance with a best foot forward from all systems tested.
The Dell XPS 13 put up a surprisingly strong score in the PCMark Applications test. Once again we see the machine pulling ahead of the Lenovo IdeaPad Slim 3i, presumably thanks to its superior SSD and better cooling.
Puget Bench For Creators: Davinci Resolve
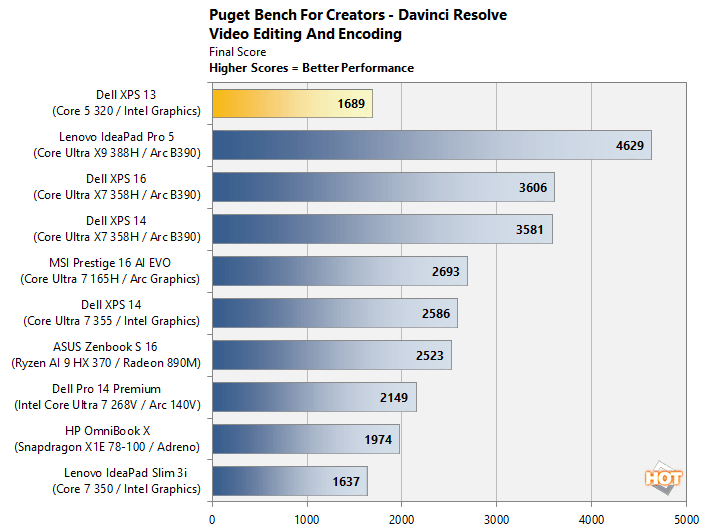
Next up we have some video editing and encoding using the Puget Bench for Creators and Davinci Resolve. Puget Systems has been developing benchmarks that leverage real-world applications and workloads for a number of years now, which are highly regarded by creators using popular Adobe applications and Davinci Resolve. Here, we used the free version of Davinci Resolve (not the Studio edition) that features less hardware acceleration and relies heavily on CPU, GPU and memory performance.
Once again, despite being powered by a lower bin SoC, the Wildcat Lake powered Dell XPS 13 with its Core 5 320 is able to outrun the Lenovo IdeaPad Slim 3i in this video editing, creator-focused workload. It trails the more powerful (and more expensive) platforms, however.
UL Procyon AI Computer Vision Benchmark
The idea of "edge AI", or running AI workloads natively on your local devices, instead of in the cloud, is only just emerging on mainstream PCs. As such, repeatable, reliable benchmarks for these workloads aren't exactly prolific. Fortunately, UL has already built a few into its Procyon benchmark suite. The following is a look at how a few machines do in this benchmark suite's AI Computer Vision benchmark, which exercises the test subject's ability to handle machine vision workloads, which you'll find in everyday tasks like webcam background blur, subject tracking, eye gaze correction and other effects, for example.
Puget Bench For Creators, Dell XPS 13 - Image: HotHardware
The Intel Core Series 3 processor in the XPS 13 features a basic NPU with peak compute performance of 17 TOPS. In this computer vision benchmark, the XPS 13 manages to outrun the Lenovo IdeaPad Slim 3i once again, but trails the higher powered systems.
UL 3DMark Gaming Benchmarks
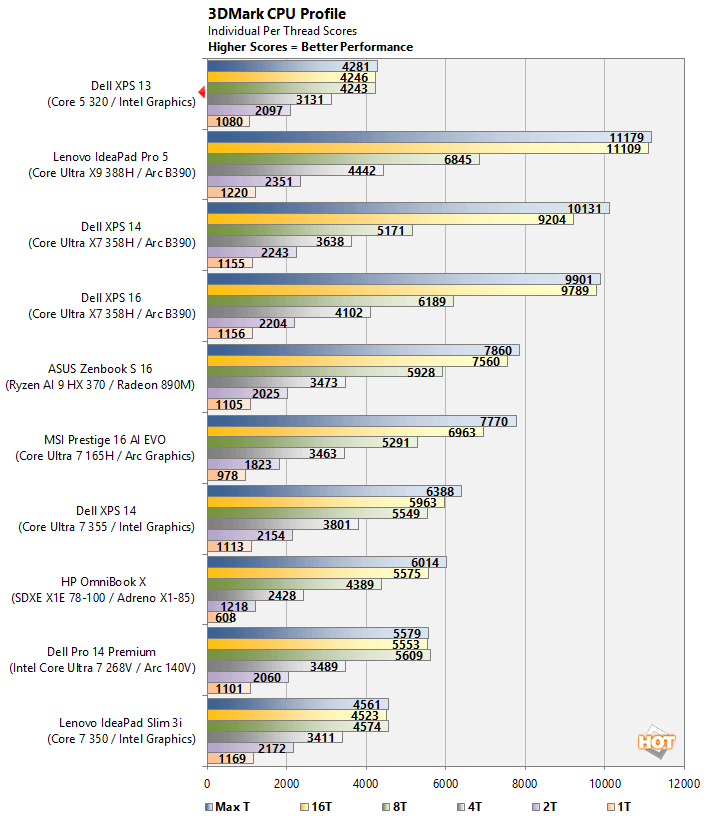
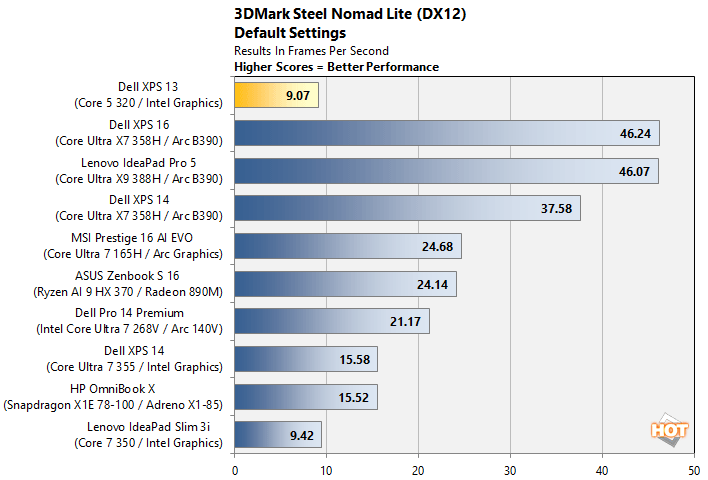
3DMark has a wide variety of graphics and gaming related tests available. For these tests, we chose to run the 3DMark CPU Profile benchmark, which steps through an array of physics calculations with a varying number of CPU threads, and Steel Nomad Lite, a modern DirectX 12 graphics test specifically designed for lower-power GPUs and integrated graphics engines.
3DMark CPU Benchmark, Dell XPS 13 - Image: HotHardware
The Core 5 320 inside the XPS 13 we tested is the lowered powered processor in this group of notebooks. As such, it trails all of the systems in this benchmark, which is solely focused on CPU physics calculations.
The basic 2-core GPU in Intel's Core Series 3 processor isn't designed for gaming or taxing graphics workloads, as evidenced by the 3DMark Steel Nomad Lite scores here.
Game Benchmarks With F1 25 & The Talos Principle II
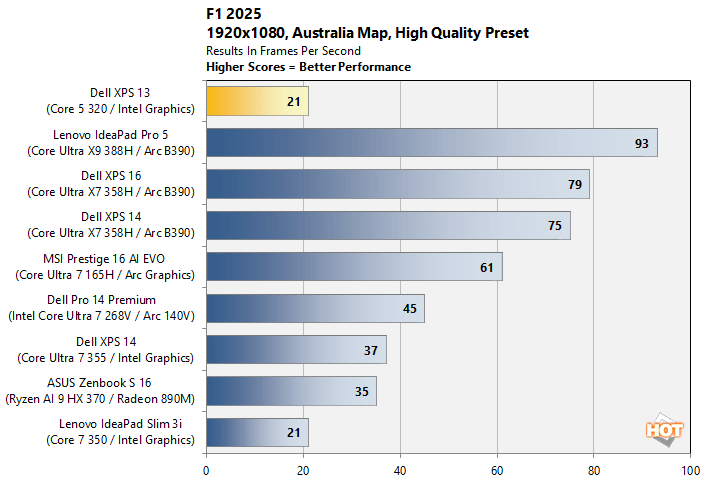
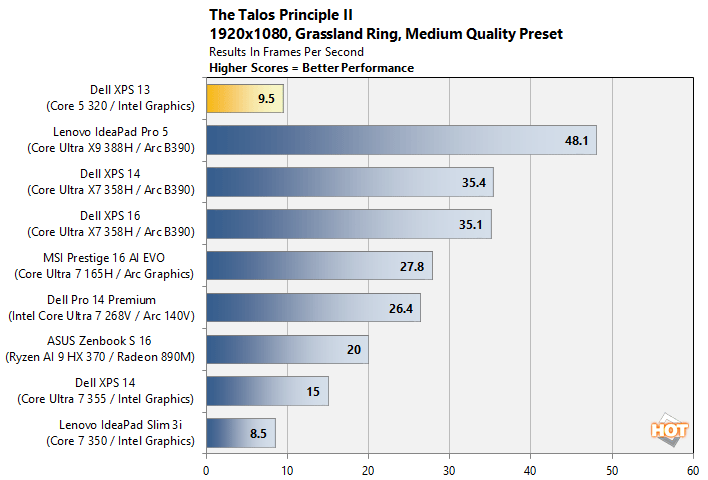
We also ran some fairly taxing gaming workloads on the laptops represented in this review, using F1 25 and The Talos Principle II at a 1080p resolution. With F1 25 we used the game's "High" image quality preset, which uses high-quality graphics settings, without ray tracing. And for The Talos Principle II, we used the game's "Medium" quality preset. Resolution scaling was disabled in both games, to show the native framerate across all platforms and iGPUs.
F1 25 Benchmark, Dell XPS 13 - Image: HotHardware
Talos Principle II Benchmark, Dell XPS 13 - Image: HotHardware
The XPS 13 put up single-digit framerates in both games when running at 1080p, with no resolution scaling. Its score tied the Lenovo IdeaPad Slim 3i in F1 25, but the Dell machine actually pulled ahead of the Lenovo system by 1 FPS in The Talos Principle II. If we dropped F1 25 to the 'medium' graphics preset, performance on the XPS 13 improved to a somewhat playable 28 FPS and enabling XeSS in Talos boosted the framerate to 19.3 FPS. The Core Series 3 powering the XPS 13 is never going to be a graphics benchmark barn-burner, but if you're willing to lower the image quality settings and use resolution scaling, some casual gaming is definitely possible on the platform.
Benchmarks On Battery (DC) Power With The Dell XPS 13 (2026)
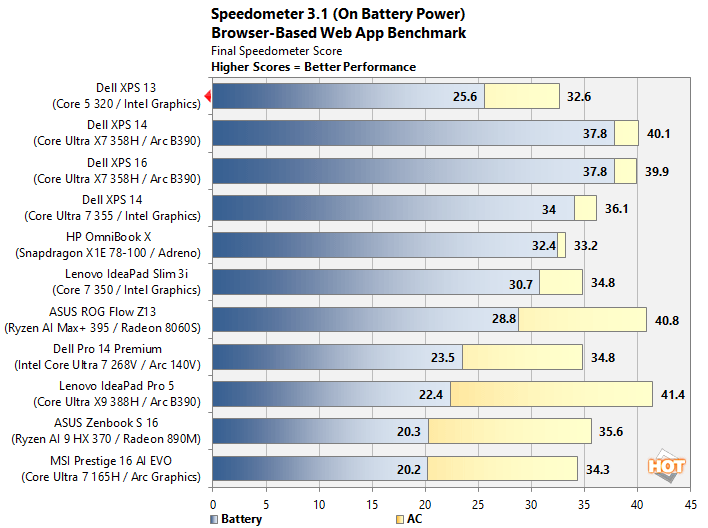
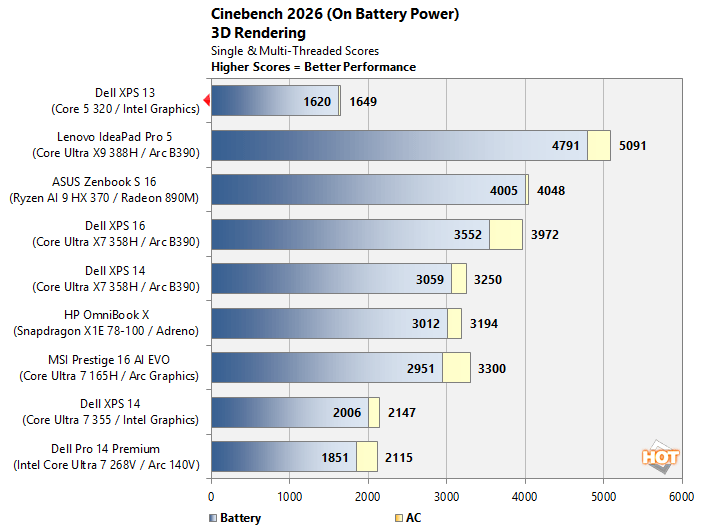
Although uses often keep their laptops and notebooks plugged into AC power, they are designed to be used while mobile, on battery power. Many systems, however, offer vastly different performance profiles when running on AC (plugged in) or DC (battery) power. With that in mind, we re-ran a couple of tests to see how much performance the Dell XPS 13 (2026) lost--if any--while utilizing its battery.
Speedometer Benchmark On DC Power, Dell XPS 13 - Image: HotHardware
Cinebench 2026 Benchmark On DC Power, Dell XPS 13 - Image: HotHardware
We ran two tests on battery power, at opposite ends of the spectrum. Speedometer is lightly-threaded and heavily influenced by CPU frequency and latency, while Cinebench 26's multi-thread test is all about raw, peak processor throughput. Speedometer showed a sharp drop off on battery power, but the XPS 13's Cinebench score barely changed, which speaks well for creativity on the go.
Marco's interest in computing and technology dates all the way back to his early childhood. Even before being exposed to the Commodore P.E.T. and later the Commodore 64 in the early ‘80s, he was interested in electricity and electronics, and he still has the modded AFX cars and shop-worn soldering irons to prove it. Once he got his hands on his own Commodore 64, however, computing became Marco's passion. Throughout his academic and professional lives, Marco has worked with virtually every major platform from the TRS-80 and Amiga, to today's high end, multi-core servers. Over the years, he has worked in many fields related to technology and computing, including system design, assembly and sales, professional quality assurance testing, and technical writing. In addition to being the Managing Editor here at HotHardware for close to 15 years, Marco is also a freelance writer whose work has been published in a number of PC and technology related print publications and he is a regular fixture on HotHardware’s own Two and a Half Geeks webcast. - Contact: marco(at)hothardware(dot)com