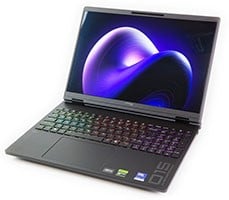
HP Omnibook Ultra 16 Review: An All-Aluminum RTX Spark Portable AI Powerhouse
by
Zak Killian
—
Friday, October 16, 2026, 11:15 AM EDT
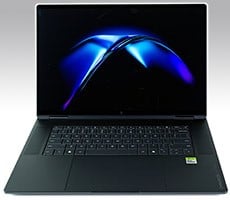
HP OmniBook Ultra 16 - Image:HotHardware
The HP OmniBook Ultra 16 powered by the NVIDIA RTX Spark N1X felt quick and responsive throughout testing. From juggling dozens of browser tabs and various applications to editing photos and working with AI-assisted tools, the system never felt sluggish or constrained. Beyond our initial impressions, however, we also ran a slew of benchmarks. We ran a mix of browser, productivity, content creation, AI, graphics, gaming and battery benchmarks, and compared the system's performance to an array of machines we have evaluated in the past.
CrystalDiskMark Benchmark Results For The HP OmniBook Ultra 16
We usually start off with ATTO to measure read/write bandwidth and IOPS across a range of different data transfer sizes, but ATTO offer an Arm64 native version and we didn't want Prism emulation to artificially hurt storage benchmark performance. Instead, we used Crystal Dew World's venerable CrystalDiskMark utility (which does have an Arm version) to get an idea of the SSD's performance. We don't typically compare these results across multiple machines, but it's useful to gauge whether a particular notebook's storage subsystem is up to snuff.
Crystal Disk Mark benchmark result - Image: HotHardware/Crystal Dew World
CrystalDiskMark isn't as thorough as ATTO, but the Sandisk SN8050S in this machine is clearly no slouch. With sequential read speeds over 14 GB/second and random performance over 1.4 GB/second at the higher queue depth, this drive is a real speed demon. Even with a single thread and a single queue, it puts up over 9,300 IOPS. Very nice for a consumer NAND drive.
HP OmniBook Ultra 16 Speedometer Browser Benchmarks
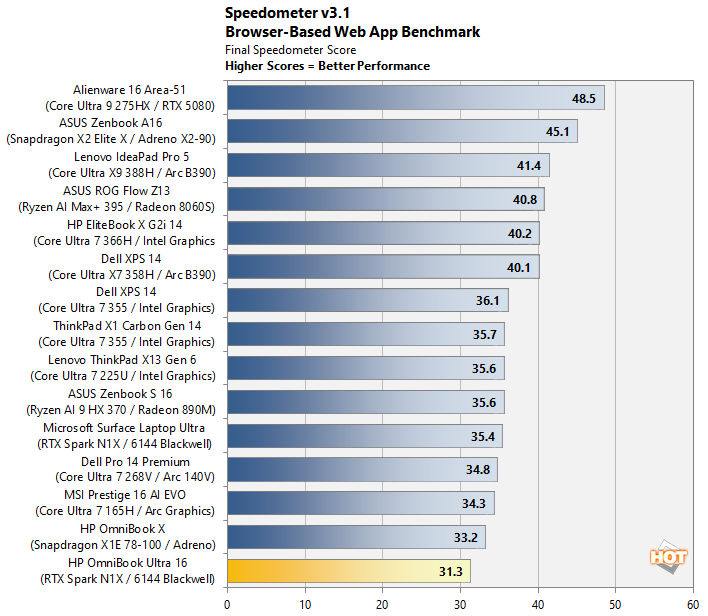
We use BrowserBench.org's Speedometer test to take a holistic look at web application performance. This test automatically loads and runs a variety of sample web apps using the most popular web development frameworks around, including React, Angular, Ember.js, and even simple JavaScript. This test is an example of how systems cope with real-world, modern web apps. All tests were performed using the latest version of Chrome.
Browserbench Speedometer 3.1 benchmark result - Image: HotHardware
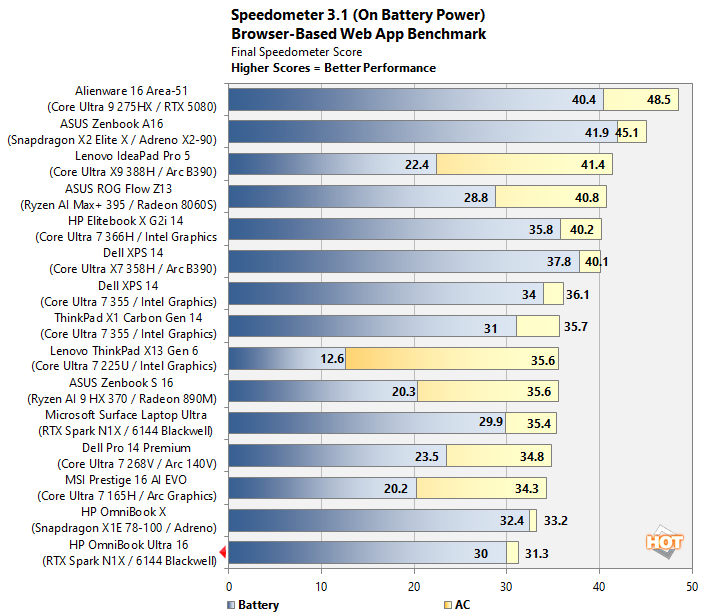
This was not a great result for the HP OmniBook Ultra 16 and its RTX Spark processor. The off-the-shelf Arm cores in the Mediatek-designed CPU portion of the Superchip aren't slow by any means, but they definitely trail behind the latest chips from competitors in web app performance, for both architectural reasons and because they don't boost to frequencies as high as competitive platforms. This could also be a scheduling issue in WIndows; if the workloads runs on an efficiency core, it won't be as as fast as a performance core.
MAXON Cinebench 2026 3D Rendering On The HP OmniBook Ultra 16
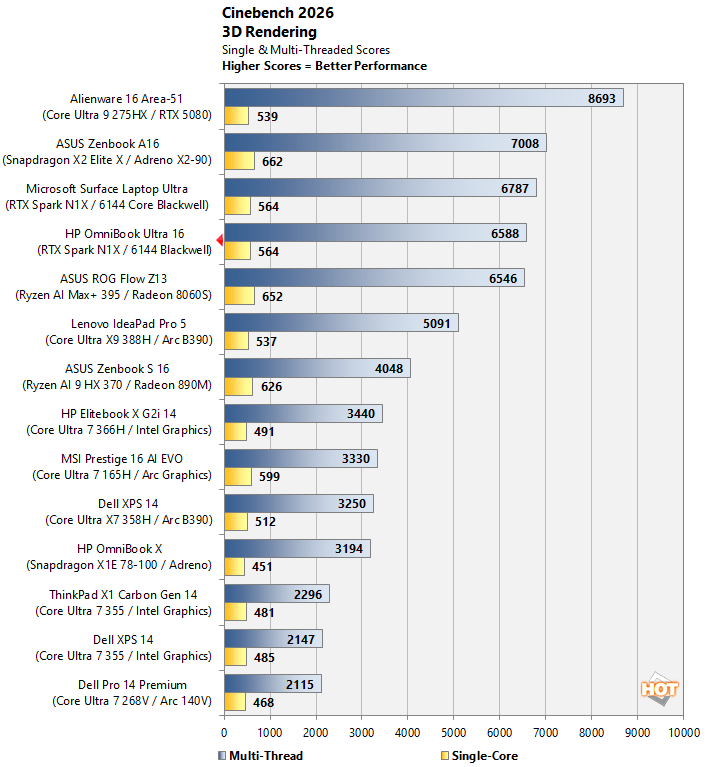
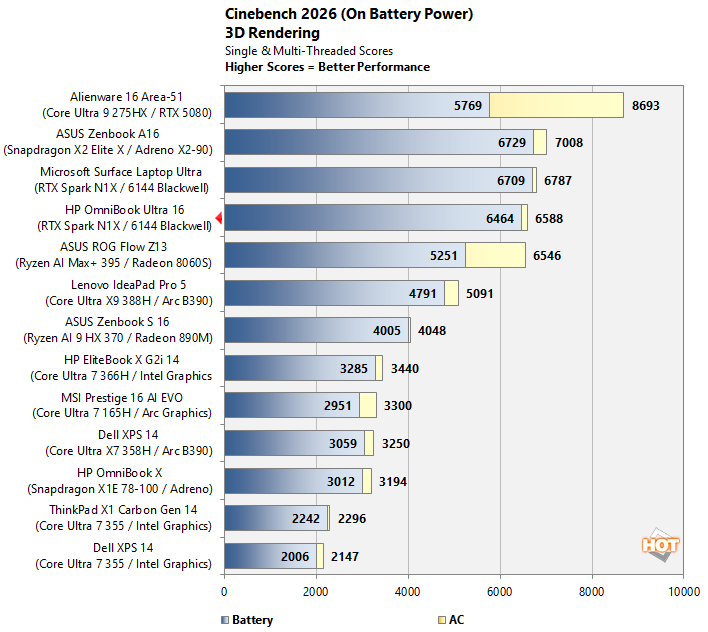
Next up is the latest-generation 3D rendering benchmark from Maxon, based on the Cinema 4D rendering engine. It's a purely CPU-based test that doesn't make use of the graphics processor or NPU, and it scales very well with additional CPU cores. We ran both single- and multi-threaded tests on all of the machines in the charts, and also tested these laptops on battery power as well.
Cinebench 2026 benchmark result - Image: HotHardware
A much more respectable showing in Cinebench, with the OmniBook Ultra 16 putting up the exact same single-threaded score as the Surface Laptop Ultra while lagging slightly in multi-core. Personally, I'm chalking up that small but consistent lag behind the Surface to the amount of preinstalled software on the OmniBook Ultra.
Battery-powered Cinebench 2026 benchmark result - Image: HotHardware
Like other latest-generation machines, including both Intel and AMD systems as well as Snapdragon, this machine loses very little performance on battery. Impressive stuff!
HP OmniBook Ultra 16 PCMark 10 Applications Benchmarks
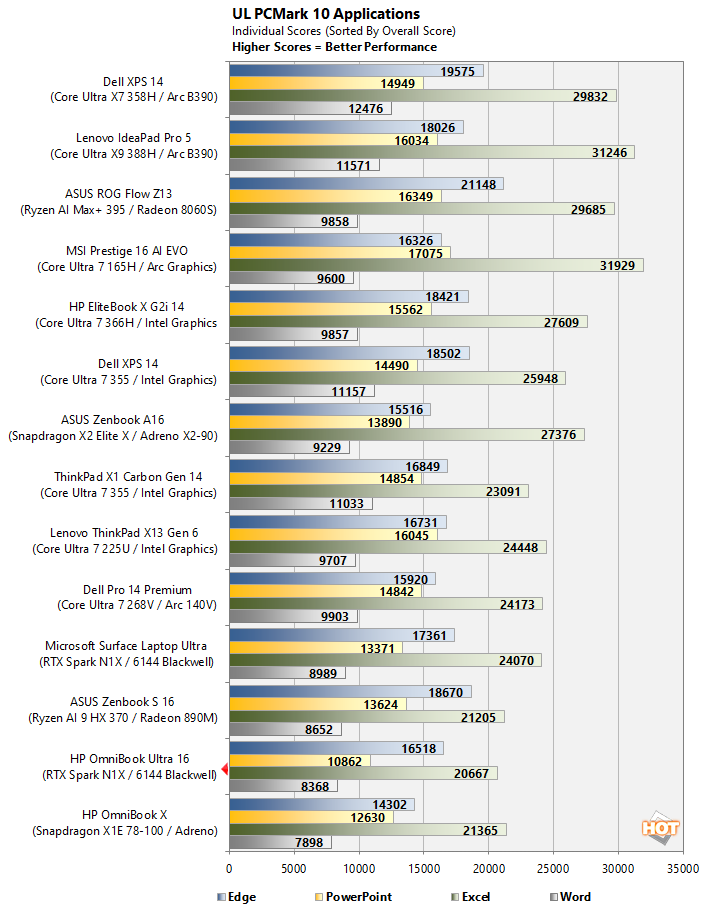
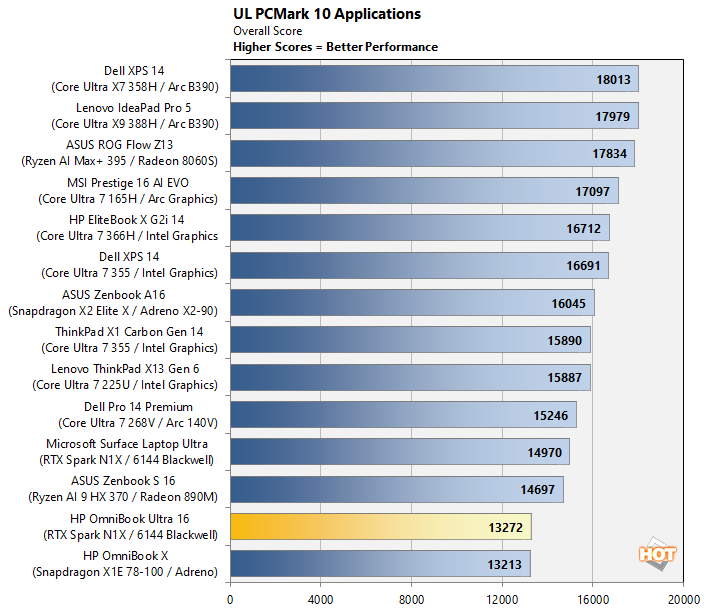
The PCMark 10 Applications benchmark measures performance in the Microsoft Office suite, as well as in the Edge browser, offering native instruction set-compatible versions of the apps for optimal performance across a wide variety of workloads in tools office workers, students and home users utilize every day. The following results should show a view of performance with a best foot forward from all systems tested.
PCMark 10 Applications benchmark result - Image: HotHardware
In the absolute sense, application performance on the RTX Spark is still very good, but in a relative sense, it does trail the competition with light-duty applications like Microsoft Office. In native applications, the system feels perfectly responsive, though that can change in emulated x86 apps, like Steam.
Geekbench CPU Benchmark Results
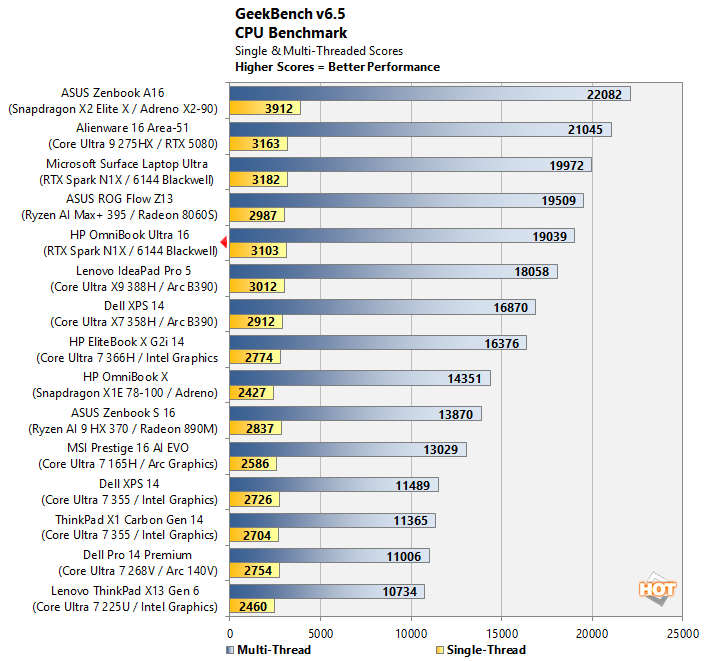
The Geekbench CPU tests stress only the processor cores in a system (not the graphics card/GPU), with both single and multi-threaded workloads. The tests are comprised of encryption processing, image compression, HTML5 parsing, physics calculations and other general purpose compute workloads. This test has a native Arm version, so that's the one we used.
Geekbench 6 benchmark result - Image: HotHardware
An excellent result here, with the OmniBook Ultra 16 competing well against the ROG Flow Z13, probably the most direct comparison. In fact, they're creeping up close to the desktop-class Core Ultra HX part in the Alienware machine. Not bad.
UL Procyon AI Text Generation Benchmarks
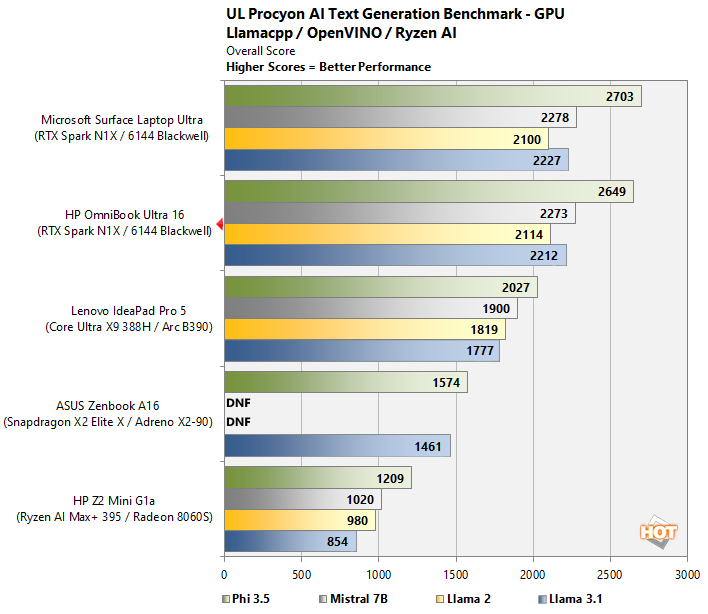
The Procyon AI Text Generation Benchmark is a tool developed by UL Solutions to evaluate the performance of large language models (LLMs) on Windows PCs. It features real-world use cases and uses seven prompts with both Retrieval-Augmented Generation (RAG) and non-RAG queries. It tests various AI models like Phi-3.5-mini, Mistral-7B, Llama-3.1-8B, and Llama-2-13B.
UL Procyon AI Text Generation benchmark result - Image: HotHardware
Unsurprisingly, in the dedicated AI tests, the RTX Spark brutalizes the competition. Intel's part puts up a remarkable showing, though, considering how much smaller its Arc B390 GPU is. Notably, while the benchmark is Arm native, the frontend and installer are Java-based, and it took over an hour to install Procyon on this machine.
UL Procyon AI Computer Vision 2.0 Benchmark
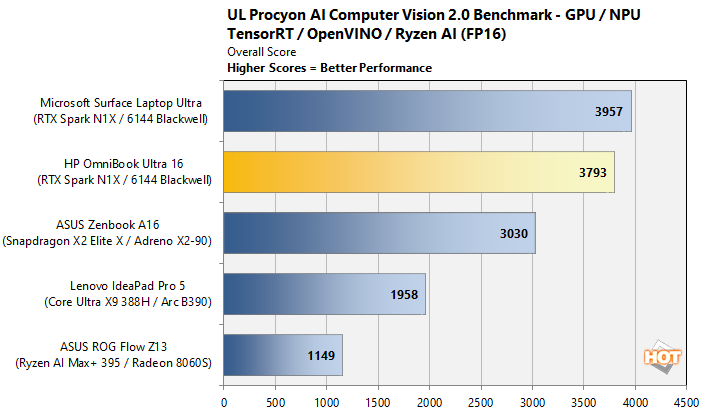
The idea of "edge AI", or running AI workloads natively on your local devices, instead of in the cloud, is only just emerging on mainstream PCs. As such, benchmarks for these workloads aren't exactly prolific. Fortunately, UL has already built a few into its Procyon benchmark suite. The following is a look at how a few machines do in this benchmark suite's AI Computer Vision benchmark, which exercises the test subject's ability to handle machine vision workloads, which you'll find in everyday tasks like webcam background blur, subject tracking, eye gaze correction and other effects, for example.
UL Procyon AI Computer Vision 2.0 benchmark result - Image: HotHardware
In the AI Computer vision test, Intel takes a backseat to Qualcomm, but both are demolished by NVIDIA. AMD is in another time zone with this one.
MLPerf Client Agentic And Image-Gen Benchmarks
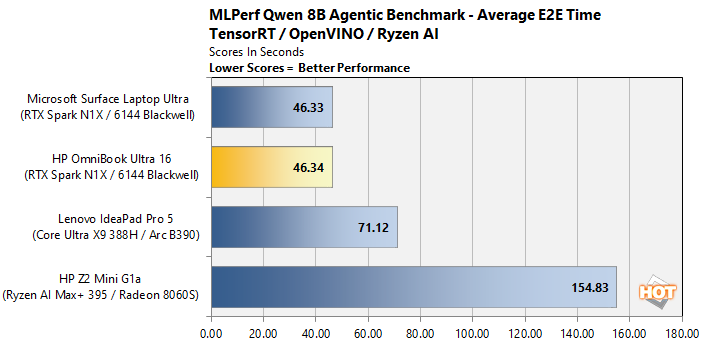
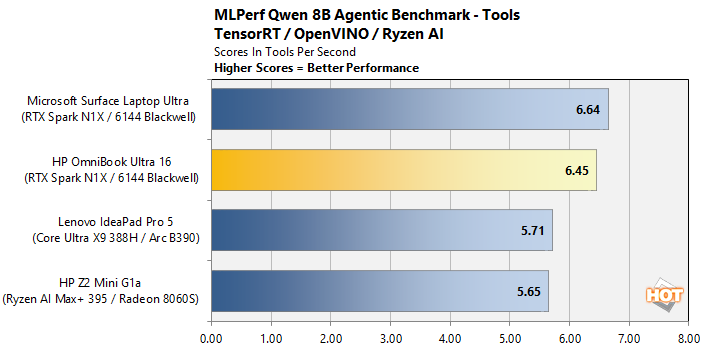
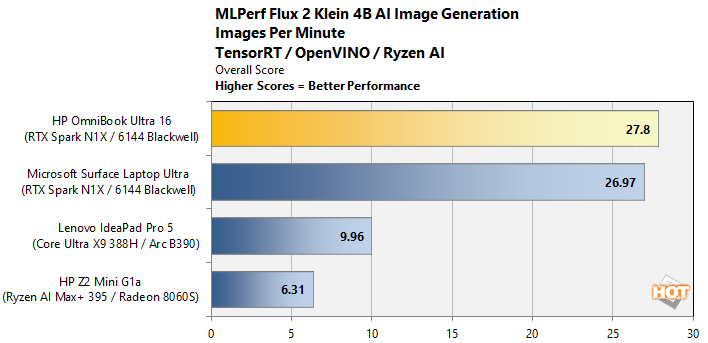
The MLPerf Client benchmark was designed by MLCommons to evaluate machine learning inference tasks on PCs. It focuses on client form factors and aims to measure how well different hardware and software configurations handle different AI workloads with various models targeting LLM, Agentic, and Image Generation use cases. MLCommons also optimizes the models and benchmark configuration for specific hardware, to ensure realistic real-world results, that must also meet strict guidelines for accuracy.
MLPerf Qwen 3 8B E2E time benchmark result - Image: HotHardware
MLPerf Qwen 3 8B Tools benchmark result - Image: HotHardware
This benchmark is pretty informative; the Tools results are fairly similar, meaning that calling and executing tools is around the same speed on most of the machines and the difference there is likely down to software and frameworks. However, NVIDIA completely runs away with the E2E metric, suggesting that it's really dominating in the inference part of the agentic workload.
MLPerf Flux 2 Klein 4B Images/minute benchmark result - Image: HotHardware
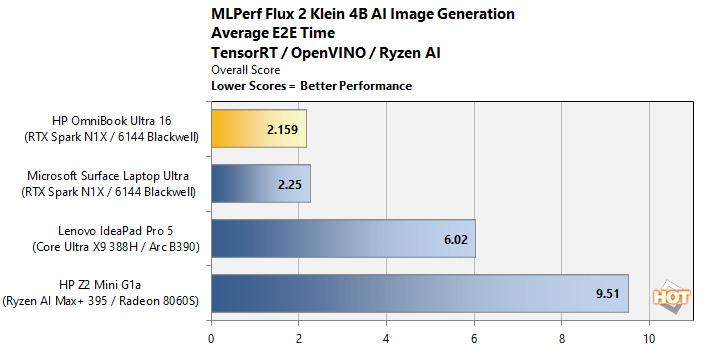
MLPerf Flux 2 Klein 4B E2E time benchmark result - Image: HotHardware
For image generation, the bulk of the task is the image generation workload, so the two charts are really kind of representing the same thing. Surprisingly the OmniBook Ultra 16 actually beats the Surface Laptop Ultra here by a hair. Of course, the hardware in both is identical so this could be down to run-to-run variance.
HP OmniBook Ultra 16 UL 3DMark Graphics Benchmarks
3DMark has a wide variety of graphics and gaming-related tests available. For these next tests, we use the most taxing DirectX 12 Speedway benchmark with ray tracing, which is ideally suited to powerful discrete GPUs, and the more modest Steel Nomad Lite, which will run on many more mobile platforms.
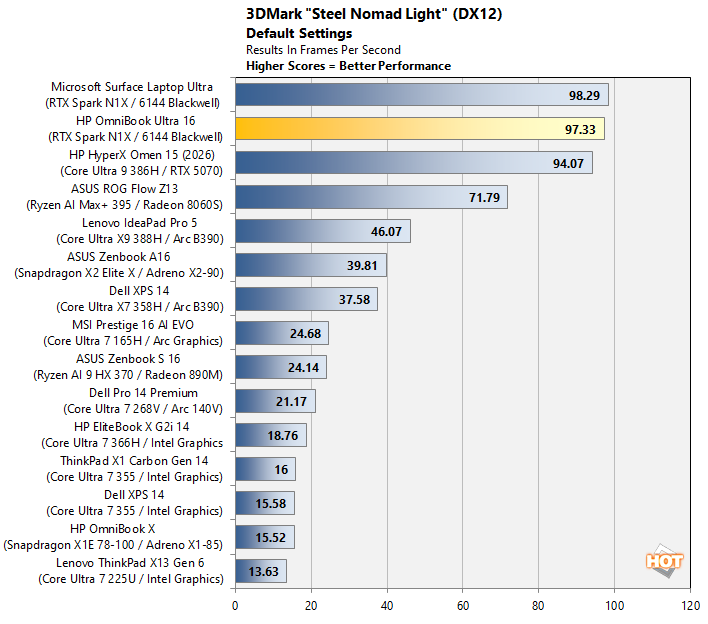
UL 3DMark Steel Nomad Light benchmark result - Image: HotHardware
The RTX Spark does amazingly well on Steel Nomad Light, destroying not only the Radeon 8060S in the Ryzen AI Max+ 395 but also even beating a discrete GeForce RTX 5070 Laptop just slightly. That chip only has 36 SMs versus the 48 in the RTX Spark, of course, but it also isn't sharing its memory bus with the CPU. This is a very impressive result.
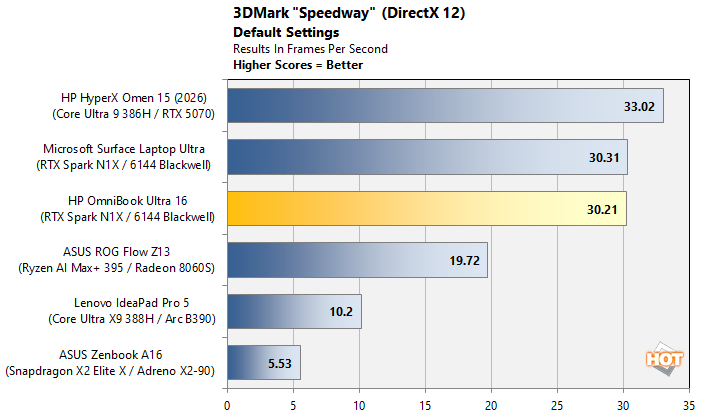
UL 3DMark Speedway benchmark result - Image: HotHardware
In the RT-heavy Speed Way benchmark, everyone else sits down while NVIDIA does its thing. Because ray-tracing requires so much more memory bandwidth than standard rendering, the Arc B390 is forced to fall back, and the GeForce RTX 5070 Laptop GPU with its 8GB of GDDR7 memory is able to sneak past the RTX Spark systems.
HP OmniBook Ultra 16 Gaming With Cyberpunk & The Talos Principle II
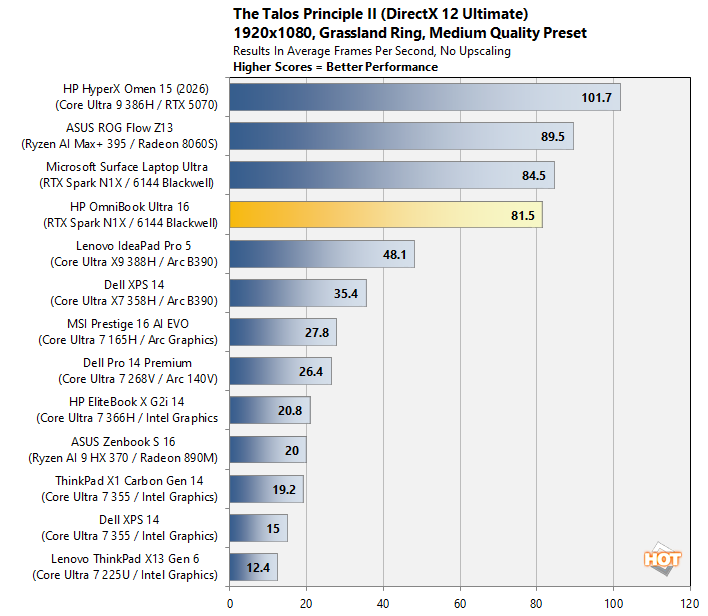
We also ran some fairly taxing gaming workloads on the laptops with Cyberpunk 2077 and The Talos Principle II at a 1080p resolution. With Cyberpunk we used the game's "Ray Tracing - Low" image quality preset, which uses high-quality graphics settings along with ray traced shadows. Meanwhile, on the Unreal Engine 5-powered The Talos Principle II, we used the game's "Medium" quality preset. Resolution scaling was disabled in both games to make sure we are presenting an apples-to-apples comparison.
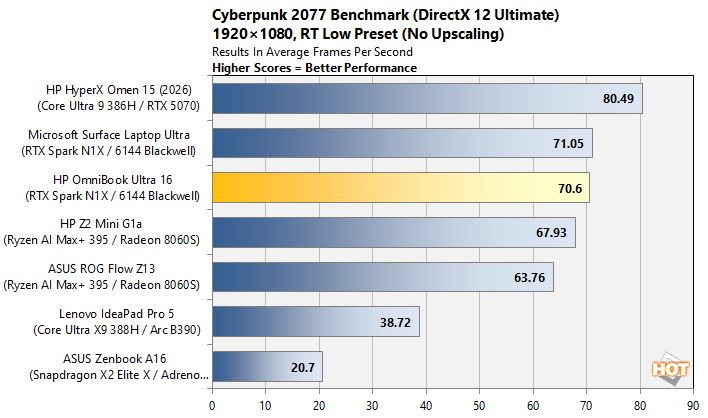
Cyberpunk 2077 game benchmark result - Image: HotHardware
AMD catches up considerably in this real game test, while the discrete GPU gaming laptop skips out ahead. Still, this is an easy workload for everything besides the Arc B390; throw on some DLSS, FSR, or XeSS, and you could enjoy the game quite nicely on any of these systems save perhaps the Zenbook.
The Talos Principle II game benchmark result - Image: HotHardware
AMD actually takes the lead among the integrated graphics machines in this test, while the discrete GPU gaming system blazes past even the ROG tablet. Still, 81.5 FPS in this test is nothing to sneeze at; The Talos Principle II is a very demanding game using the Unreal Engine.
With the performance picture planted firmly in mind, let's move on to thermals and noise before wrapping it all up with our conclusions.
A 30-year PC building veteran, Zak is a modern-day Renaissance man who may not be an expert on anything, but knows just a little about nearly everything.