NVIDIA GeForce RTX 3090 Review: BFGPU Benchmarks Unleashed
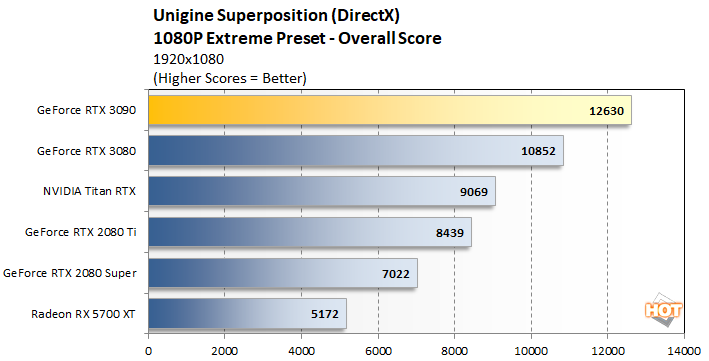
Superposition is a relatively new benchmark from Unigine, powered by the UNIGINE 2 Engine. It offers an array of benchmark modes, targeting gaming workloads as well as VR, with both DirectX and OpenGL code paths.
|
|
|


Unigine Superposition
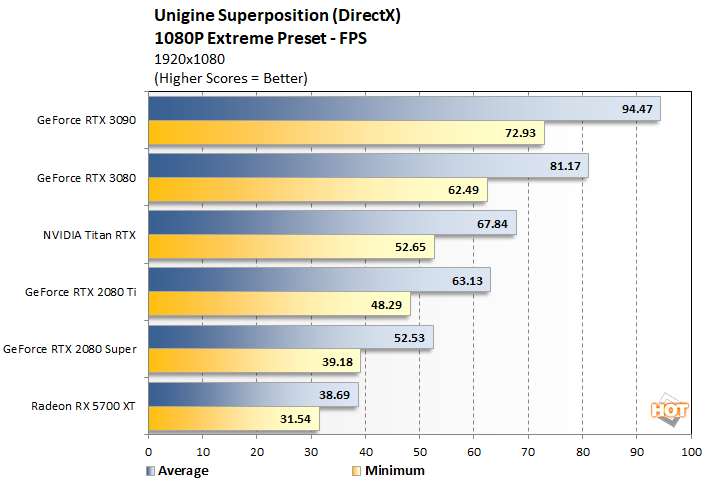
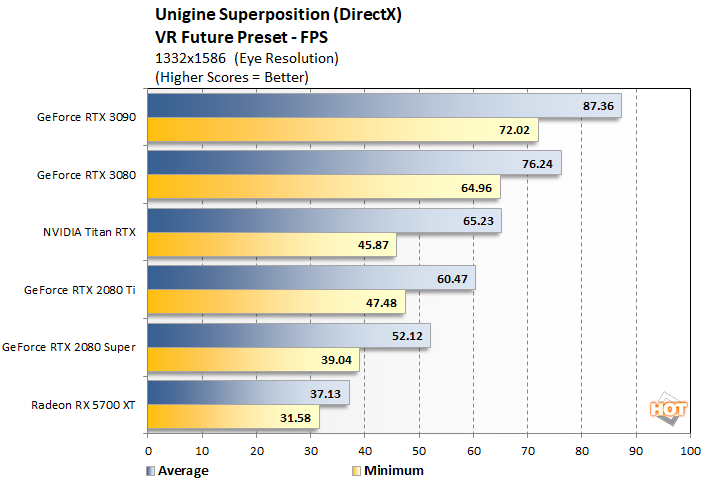
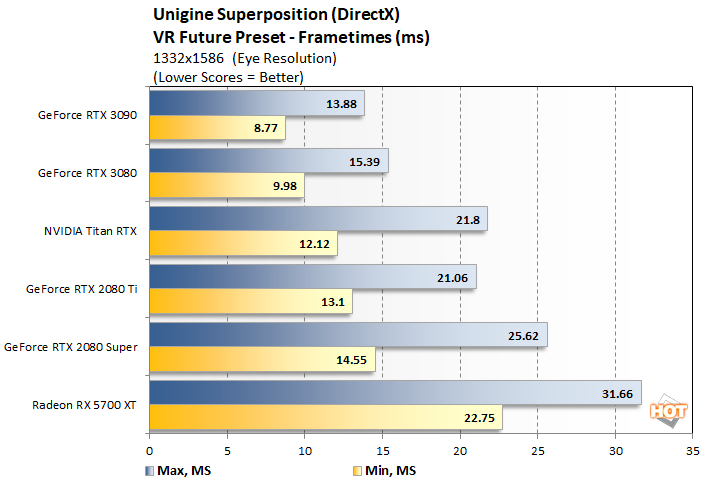
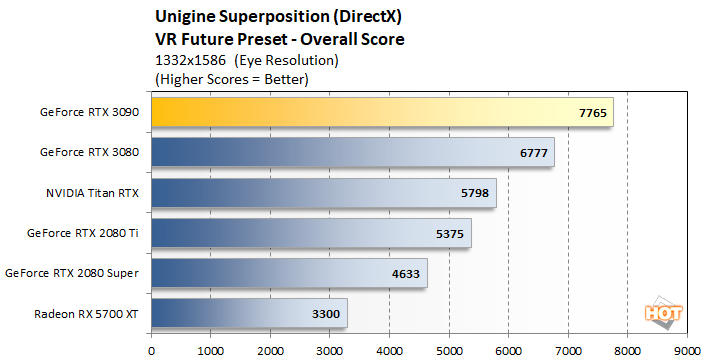
The overall performance trend remains the same with Superposition's VR Future test, but the deltas separating the cards shrink somewhat. Here, the GeForce RTX 3090 is only about 14.5% faster than the RTX 3080. It is still much faster than the Titan RTX, or anything else below it for that matter.
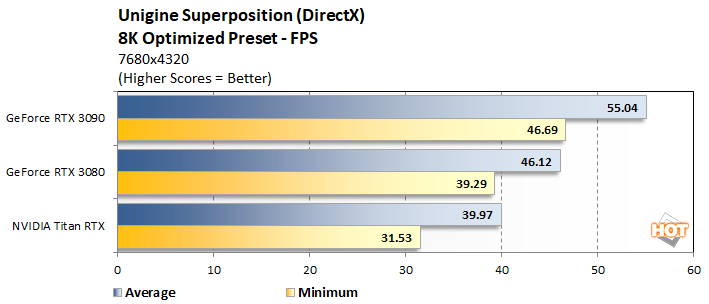

If we crank things up to 8K resolution (at least virtually -- the benchmark uses resolution scaling to evaluate 8K in lieu of an actually monitor capable of displaying the resolution), the GeForce RTX 3090's leads over the RTX 3080 and Titan RTX jump back up to over 19% and 37%, respectively.
|

UL VRMark
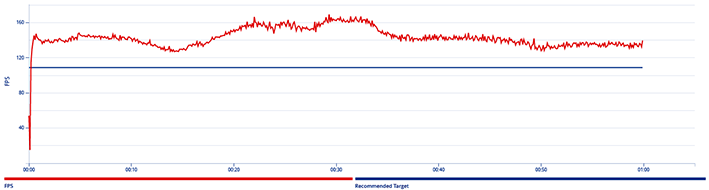
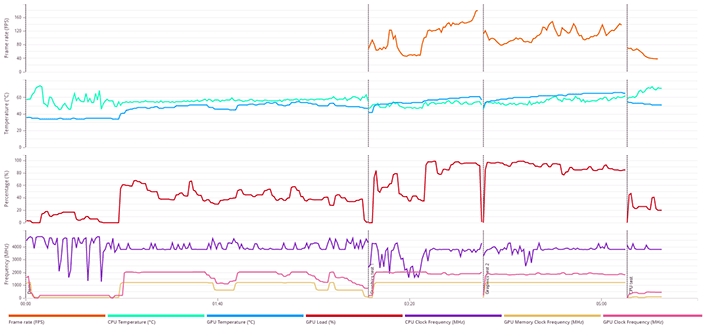
GeForce RTX 3090 VRMark Details
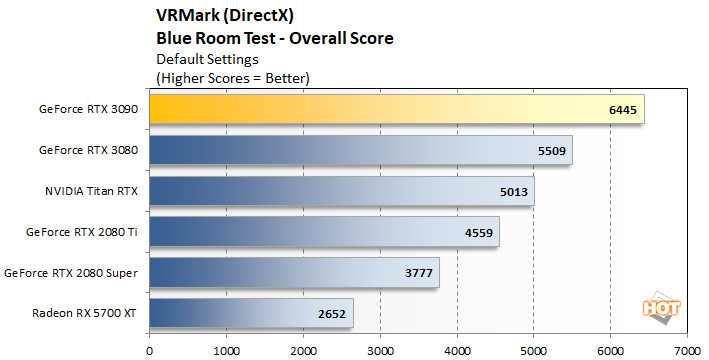
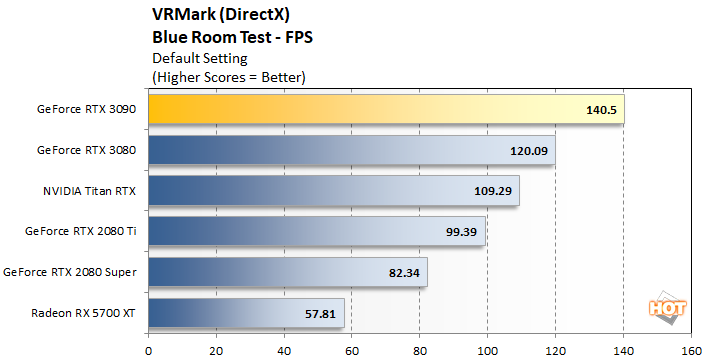
We saw more of the same with VRMark's "Blue Room" test, where the GeForce RTX 3090 outpaced the 3080 by 17% and the Titan RTX by nearly 29%.
|
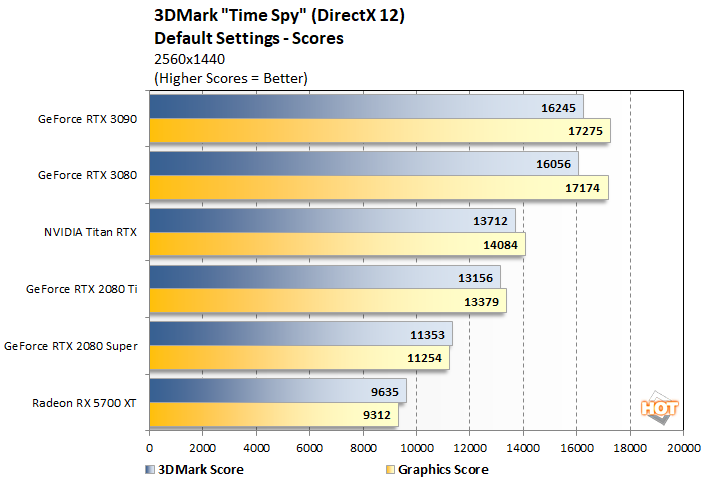
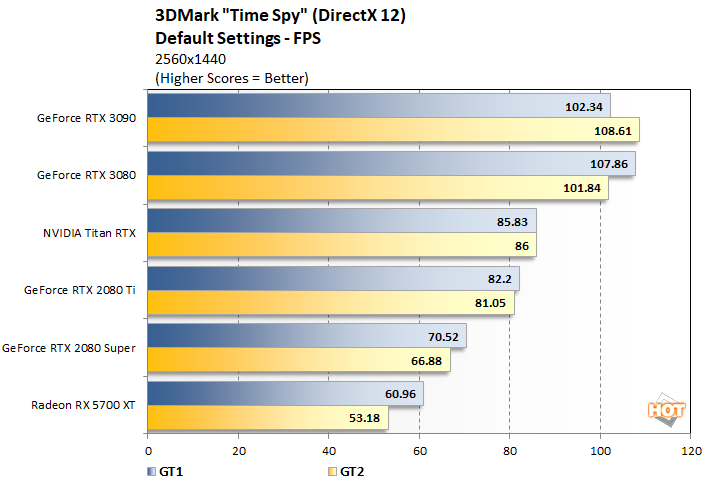
3DMark Time Spy is a synthetic DirectX benchmark test from Futuremark. It features a DirectX 12 engine built from the ground up to support bleeding-edge features like asynchronous compute, explicit multi-adapter, and multithreading. Time Spy is designed to test the DirectX 12 performance of the latest graphics cards using a variety of techniques and varied visual sequences. This benchmark was developed with input from AMD, Intel, Microsoft, NVIDIA, and the other members of the Futuremark Benchmark Development Program, to showcase the performance and visual potential of graphics cards and other system resources driven by close-to-the-metal, low-overhead APIs.

3DMark Time Spy
GeForce RTX 3090 Time Spy Details
|
|
|
3DMark Fire Strike

GeForce RTX 3090 Fire Strike Ultra Details

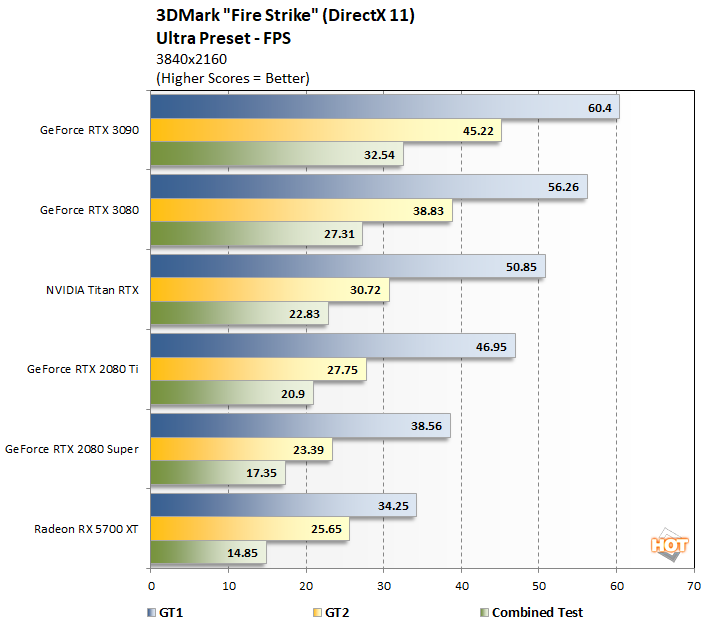
Our results in the DX11-based Fire Strike benchmark have the GeForce RTX 3090 finishing in the overall lead yet again, with scores 13% and 34% better than the GeForce RTX 3080 and Titan RTX, respectively, and nearly double the Radeon RX 5700 XT.
|
Port Royal was released around the same time Turing hit the market, as an update to UL’s popular 3DMark suite. It is designed to test real-time ray tracing performance of graphics cards that support Microsoft DirectX Ray Tracing, or DXR. Although DXR is technically compatible with all DX12-class GPUs, the graphics card must have drivers that enable DXR, and NVIDIA is the only company to have done so at this point, hence the lack of Radeons in the chart. Hopefully, that changes soon when RDNA2-based Radeons are announced late next month.

3DMark Port Royal
GeForce RTX 3090 Port Royal Details
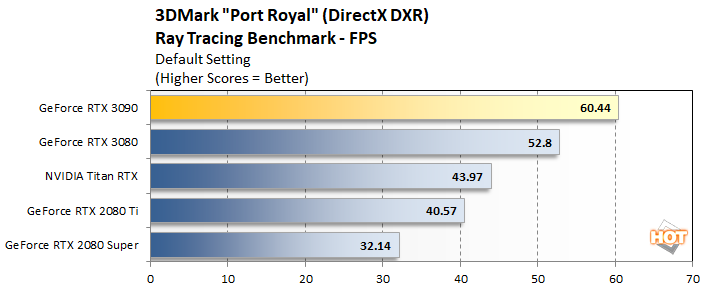
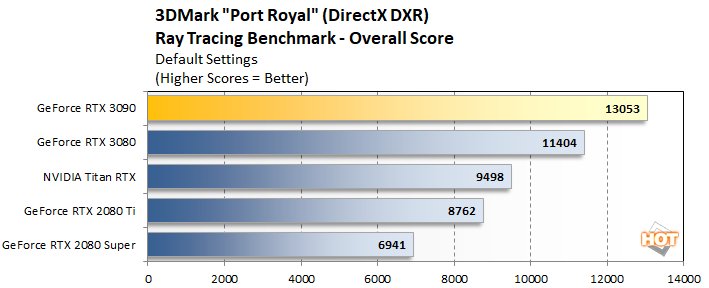
By this point, we must be sounding like a broken record, but the numbers are what they are. With 3DMark's Port Royal ray tracing test, we see the GeForce RTX 3090 finishing in the lead yet again, out in front of the GeForce RTX 3080 by roughly 14.4%.
|
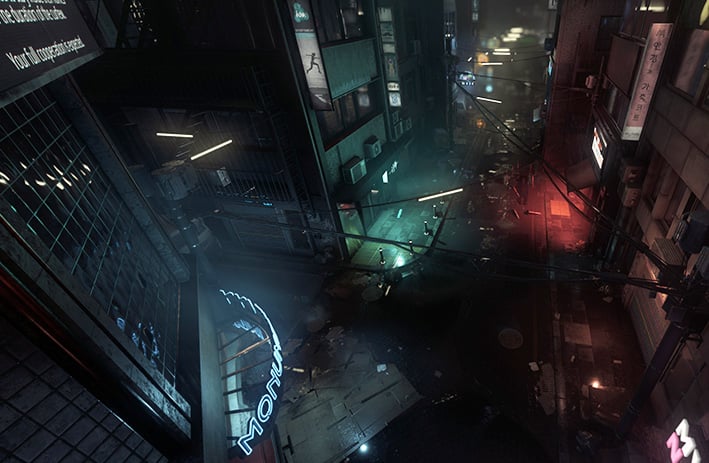
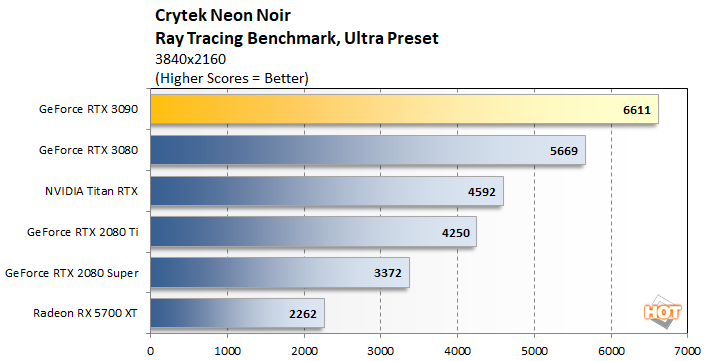
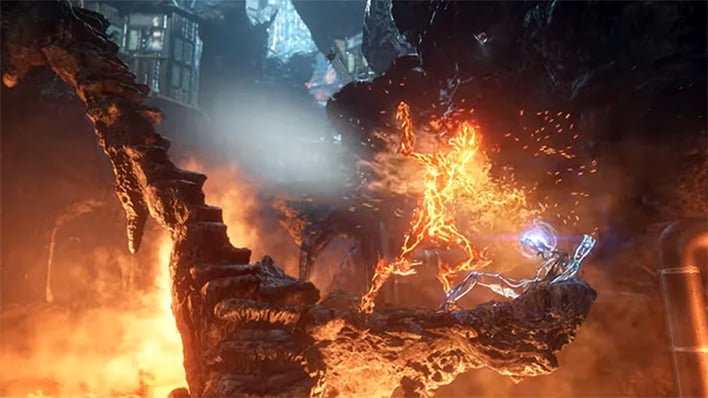
Crytek’s Neon Noir demo was created with an advanced version of CRYENGINE’s Total Illumination technology, which will be used in the upcoming Crysis Remastered to enhance the game’s visuals. Neon Noir was developed on a customized version of CRYENGINE 5.5., and is both API and hardware agnostic. It enables ray tracing to run on virtually any modern GPU, however, future integration of the technology will be optimized for the latest GPUs and APIs like Vulkan and DX12.
Crytek Neon Noir