Dell XPS 17 9700 Review: The 17-Inch Laptop Gold Standard
|
We will start our benchmarking with a heavy content-creation workload to see how its eight-core Intel Core i7-108750H stacks up. The latest version of Maxon's rendering benchmark, Cinebench R20, takes some time complete, so this is a good test of the XPS 17's cooling system. This release also drops the OpenGL test, making Cinebench a pure CPU benchmark this time. We tested both single-threaded and multi-threaded performance here.
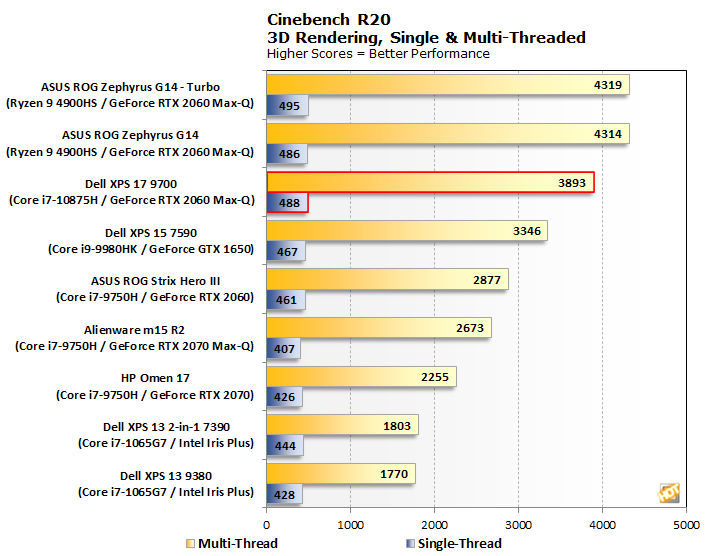
This processor wipes the floor with every other Intel chip we have tested. However, it stops short of taking the performance crown away from AMD’s Ryzen 9 4900HS. The Ryzen 9 processor outstrips the Core i7-10875H in both multi- and single-threaded workloads - at least with turbo engaged. Most notably, the XPS 17 doubles the performance of the XPS 13 9380 we tested.
|
We also stepped through Geekbench 5 for another look at CPU performance. Geekbench 5 is a cross-platform benchmark that simulates real world processing workloads in image processing and particle physics scenarios. We tested the Dell XPS 17 with Geekbench 5’s single and multi-core test workloads.
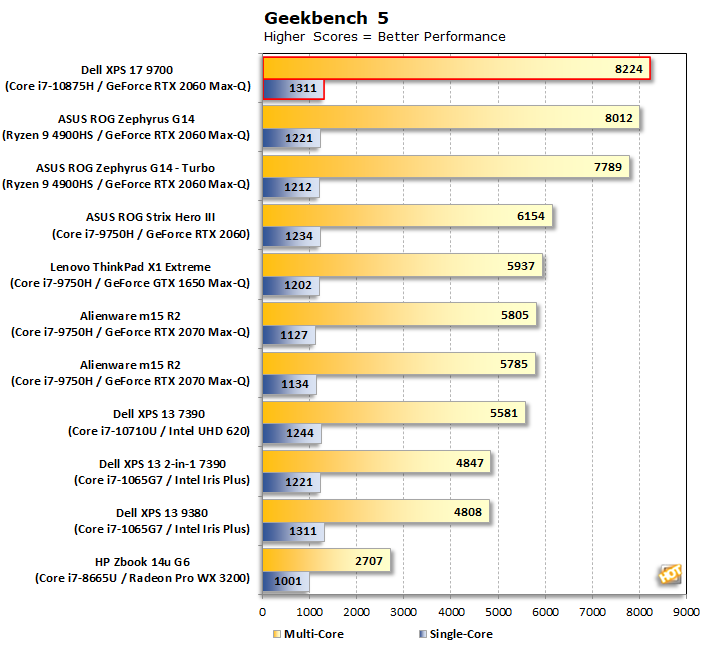
The Dell XPS 17 topples the Ryzen-powered ROG Zephyrus G14’s multi-threaded throne here. This test is less thermally demanding than Cinebench, so it may not be a clean win for the XPS 17 here. Honestly, we would be hard-pressed to notice a difference in real-world workloads, but a win is a win, nonetheless.
|
Before moving on, we want to quickly detour to check storage performance. The ATTO disk benchmark is a fairly quick and simple test which measures read/write bandwidth and IOPS across a range of different data sizes. While we don't typically compare these results across multiple machines, it's useful to gauge whether a particular notebook's storage subsystem can handle being put under pressure.
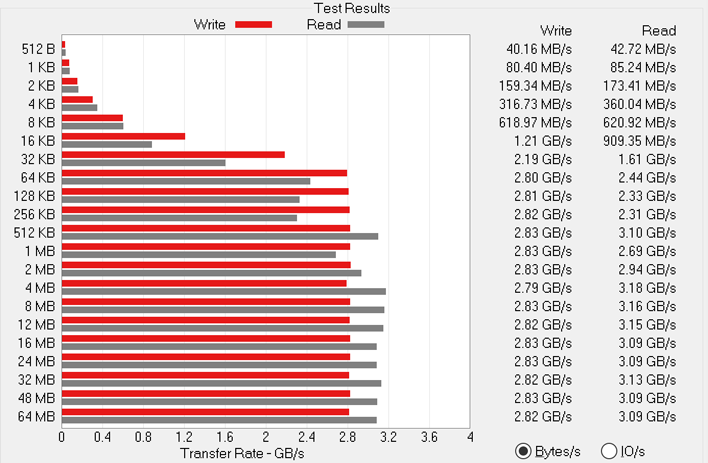
The XPS 17 9700's Samsung PM981 NVMe drive delivers strong performance across all transfer sizes. Both read and write speeds hover around 3 GB/s beyond a transfer size of 64KB.
|
PCMark 10 uses a mix of real-world applications and simulated workloads to establish how well a given system performs productivity tasks, including image and video editing, web browsing, and OpenOffice document editing. While these scores appear to be all over the place, the systems are sorted by their overall PCMark score, which is the third (gray) bar in each cluster.
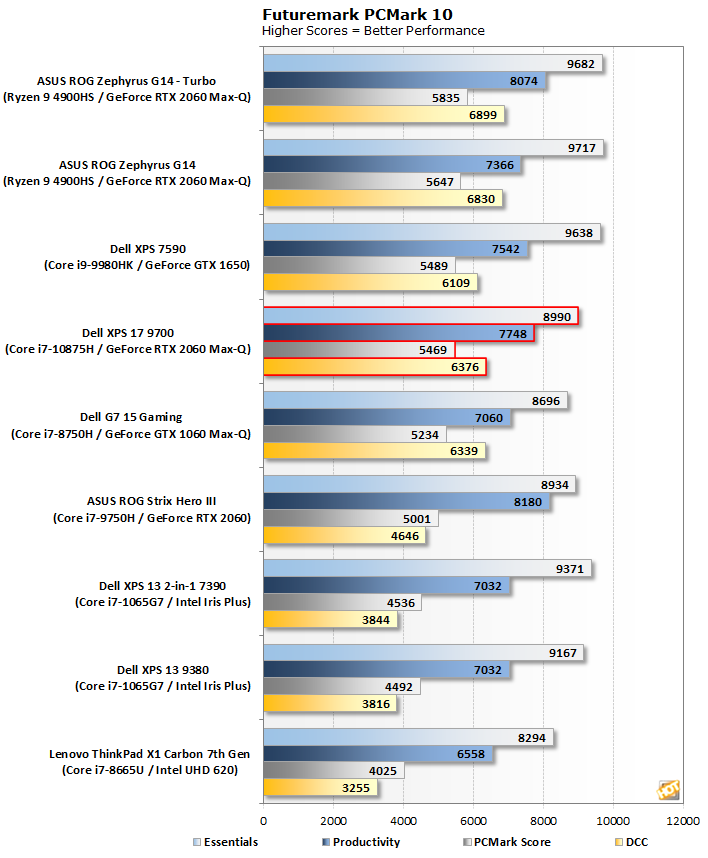
The XPS 17 performs in the upper-middle of our pack here. It is not particularly strong in any one sub-test, though PCMark 10 tends to have a good deal of run-to-run volatility. We will note the similarly configured ROG Strix Hero III put up scores in the same ballpark, though with a much lower Digital Content Creation result.
Now we will turn our attention to the XPS 17’s graphical performance...


