Dell XPS 16 Review: Beautiful, Polarizing Full-Featured Laptop

ATTO Disk Benchmark
In order to test the XPS 16’s 1TB PCIe 4 NVMe 3500 Micro SSD, we ran a quick sanity check with the ATTO Disk Benchmark, which measures sequential read/write bandwidth over a series of different data sizes. We don’t typically compare the results against other systems with this test, but rather want to see how the drive generally performs. The SSD is rated for a 7,000MB/s sequential read performance and a 6,900MB/s sequential write performance.
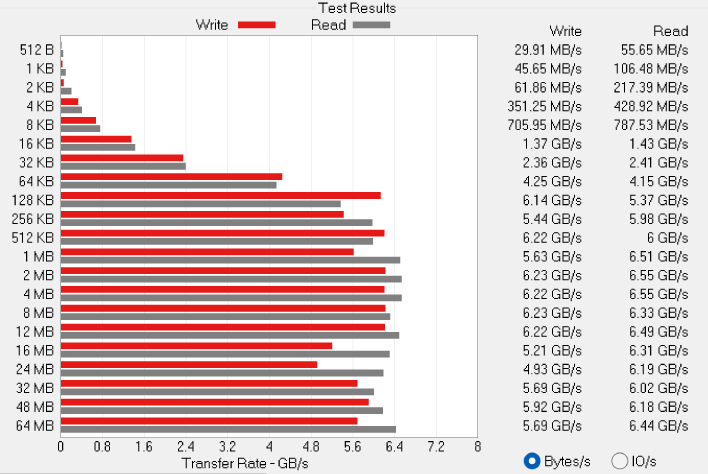
The test results were withinin swinging distance of this SSD's estimated performance, with a sequential reads topping out at 6.55GB/s (6,550MB/s) and a peak sequential write speed of 6.23GB/s (6,230MB/s).
Speedometer 2.0 Browser Benchmark
We spend a lot of time working on laptops. And when we're not working or gaming, we're typically browsing the web. In order to see how the XPS 16 holds up against real web applications we ran BrowserBench.org’s Speedometer test on the latest version of Google Chrome. It loads and runs a few sample web apps from ToDoMVC.com which uses popular web development frameworks such as Ember.js, Angular, React and JavaScript.
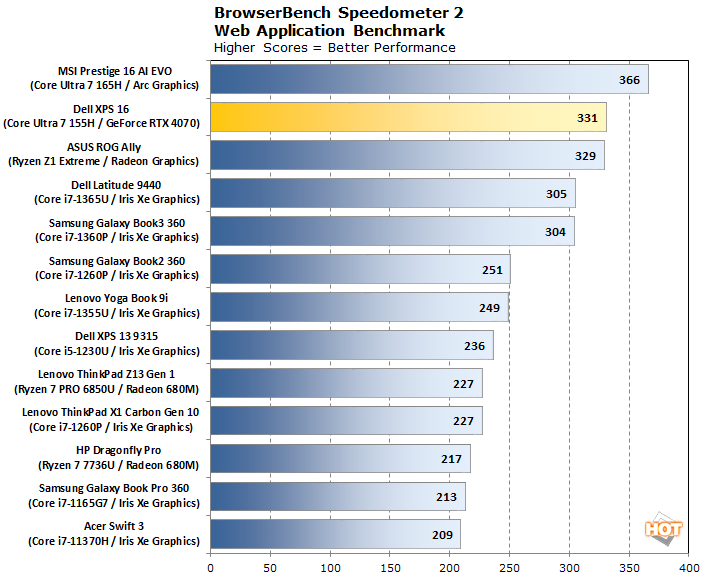
The XPS 16 landed in second place with a score of 331, placing it right behind the MSI Prestige 16 AI Evo (366), which is based on a slightly faster Intel Core Ultra 7 165H CPU.
Cinebench R23 Rendering Benchmark
Based on the Cinema 4D R23 rendering engine, the Cinebench R23 is the latest 3D rendering benchmark from Maxon. For this test, we ran both single and multi-threaded on every laptop listed in the graph.
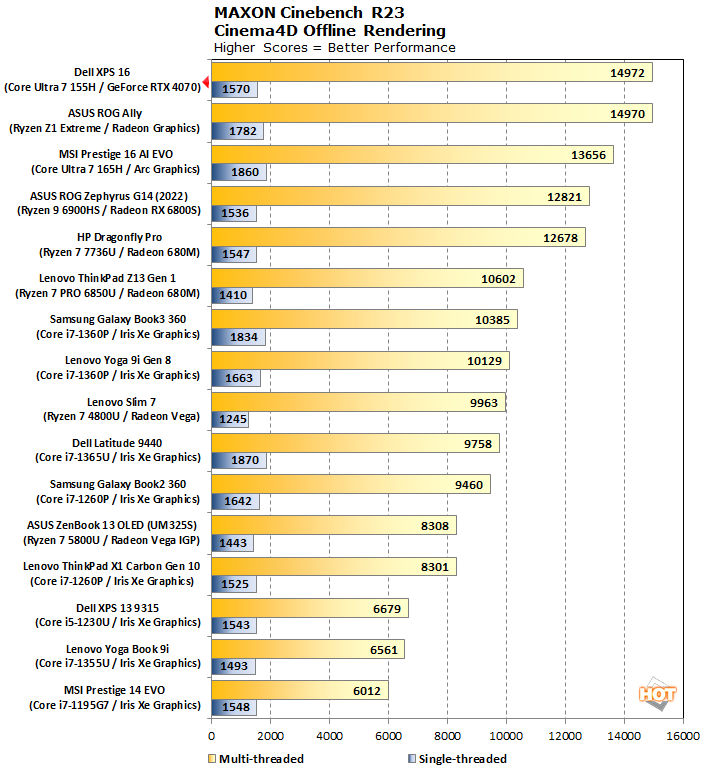
The XPS 16’s 4.8-GHz Intel Core Ultra 7 155H processor held its own during both instances of this benchmark. With a single-thread result of 1,570, the Dell landed in the upper echelon of the results, sandwiched between the Samsung Galaxy Book2 360 (1,642) and the MSI Prestige 14 EVO (1,548). The Dell ruled the roost on the multi-threaded portion of the test, however, with a score of 14,972.
Geekbench 5 Tests
Next up is Geekbench 5 , a CPU-centric, cross-platform performance benchmark that mimics real world processing workloads in image processing and particle physics situations, among other things. Both single and multi-threaded workloads were tested on every notebook.

The XPS 16 delivered a solid performance on Geekbench 5 with a result of 1,676 on the single-thread test and 13,169 on the multi-thread benchmark, placing the laptop in third and second place, respectively.
PCMark 10 Whole System Benchmarks
To simulate how well a notebook handles productivity tasks, we run PCMark 10. It’s a test that utilizes different tasks such as web browsing, OpenOffice document editing as well as image and video editing to simulate real world workloads. While the scores look a bit haphazardly put together, they’re in order of overall PCMark score, which is denoted by the yellow bar at the top of each entry.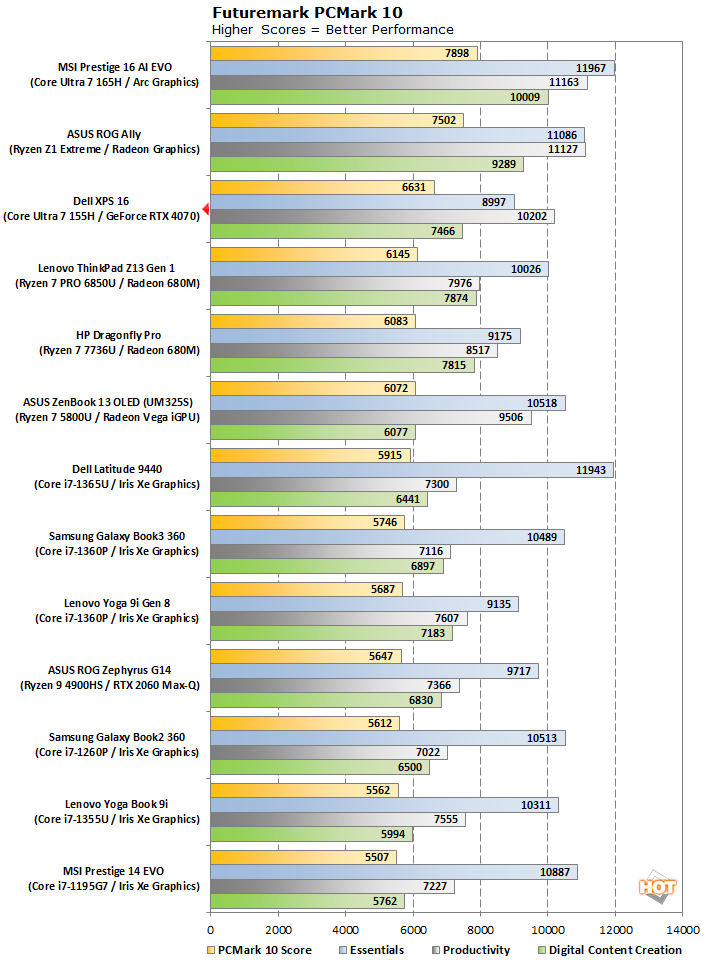
The Dell XPS 16 managed to notch 6,631 overall, which is good enough to land it in third place between the Asus ROG Ally (7,502) and the Lenovo ThinkPad 13 Gen 1 (6,145).
3DMark Graphics And GPU Tests
The Dell XPS 16 is a jack-of-all-trades kind of laptop, met to straddle the lines between productivity, gaming, entertainment and content creation. As such, it’s only right that Dell outfitted the XPS 16 with a formidable Nvidia GeForce RTX 4070 GPU with 8GB of VRAM. The middle child in Nvidia’s 4000 series mobile chips, you can expect higher-end performance than most other mobile GPUs currently on the market. To test this out, we ran a number of benchmarks, starting with 3DMark...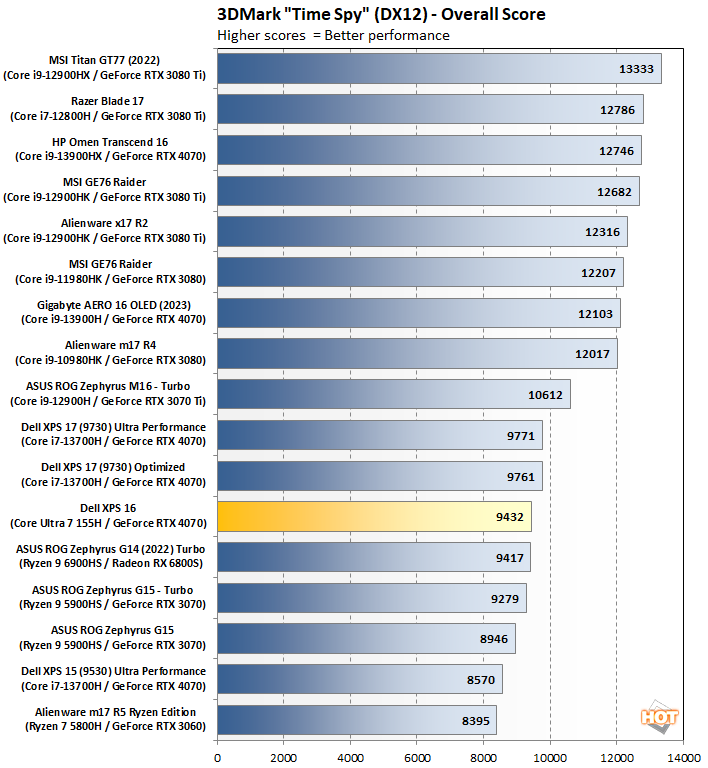
Our journey starts with the Time Spy test which is designed to test the CPU and GPU using the DirectX 12 API. The XPS 16 turned in a score of 9,432, placing it between the Asus ROG Zephyrus G14 and the Dell XPS 17 (9730).
The new Dell XPS 16 performed right on-par with its older (and larger) sibling, the XPS 17, which was also packing an RTX 4070, but outran the RoG Zephyrus M16 with an RTX 3070 Ti.
Middle Earth: Shadow Of War Tests
Beautiful and brutal, Middle Earth: Shadow of War lets you live all out your Tolkien fantasies in this epic take of the Lord of the Ring franchise. It’s fun, engrossing and a great way to test out the XPS 16’s gaming performance. For this test, the resolution was set to 1920 x 1080 as well as 2560 x 1440 with the visuals cranked to High. Each test was run three times and from there, we took the average of those scores.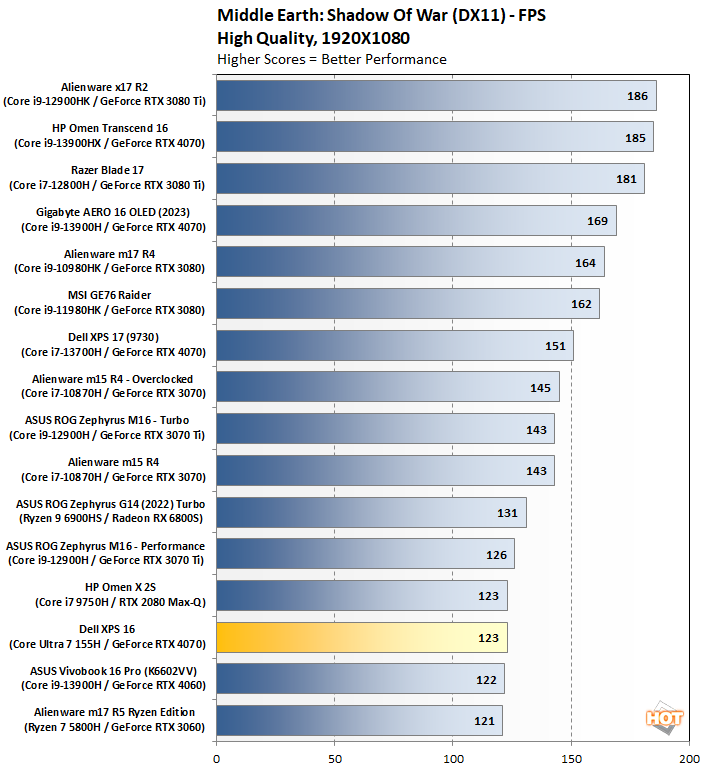
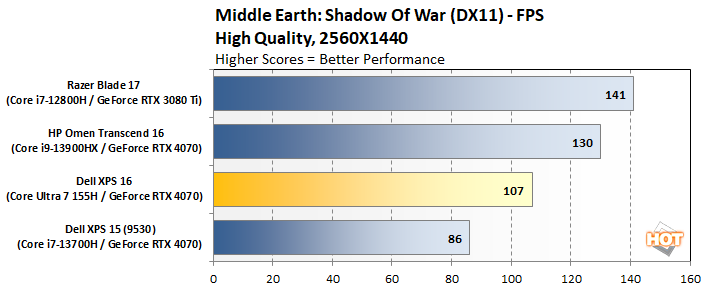
It was the same when I switched the resolution to 1440p and the XPS 16 produced a frame rate of 107 fps. Again, this is a great result for most laptops, gaming or otherwise. It’s just that the sleek Dell XPS 16 is up against some heavy hitters here.
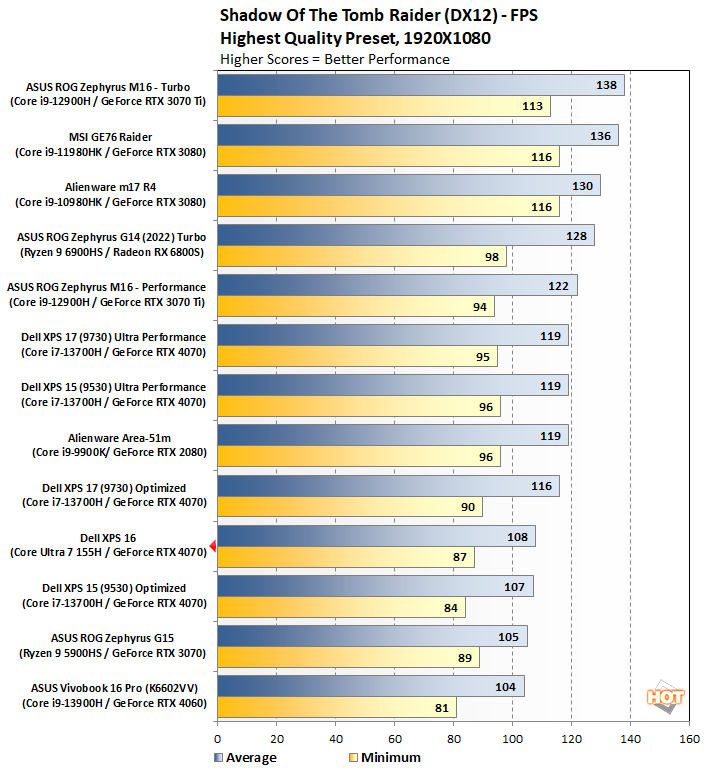
Shadow Of The Tomb Raider Benchmarks
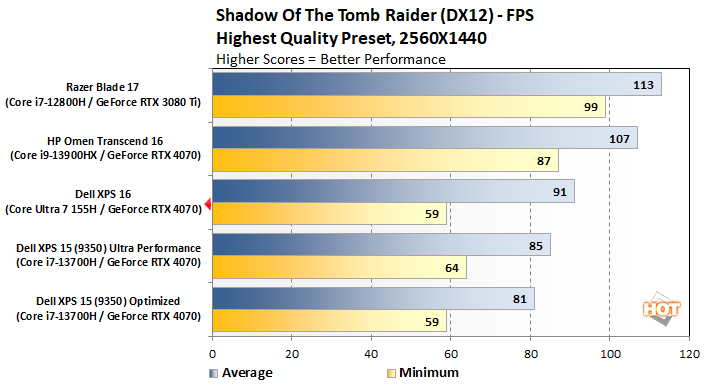
Cranking things up to 1440p, we saw a result of 91 fps which is sandwiched between the HP Omen Transcend 16 (107 fps) and XPS 15 (85 fps).
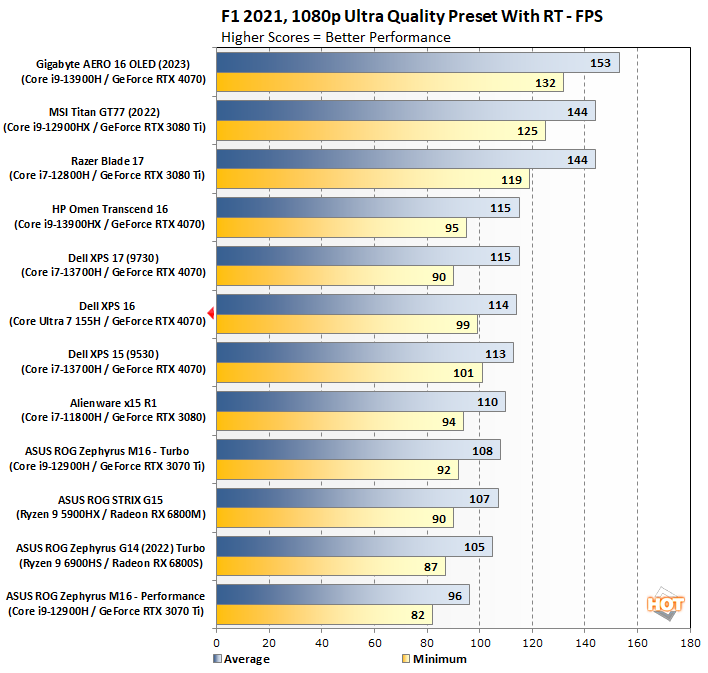
F1 2021 Benchmarks
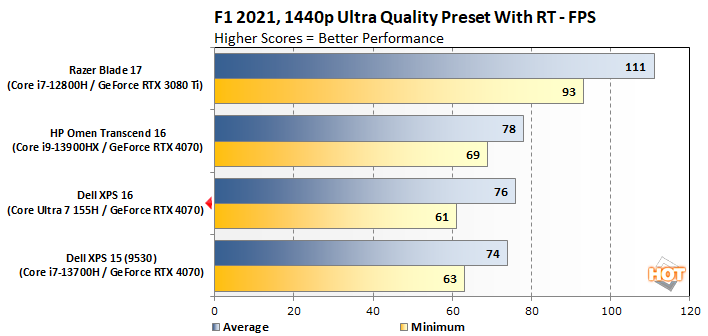
When we bumped up the resolution to 1440p, the XPS 16 got 76 fps, placing between the Omen Transcend 16 (78 fps) and XPS 15 (74 fps).
Marvel's Guardians Of The Galaxy
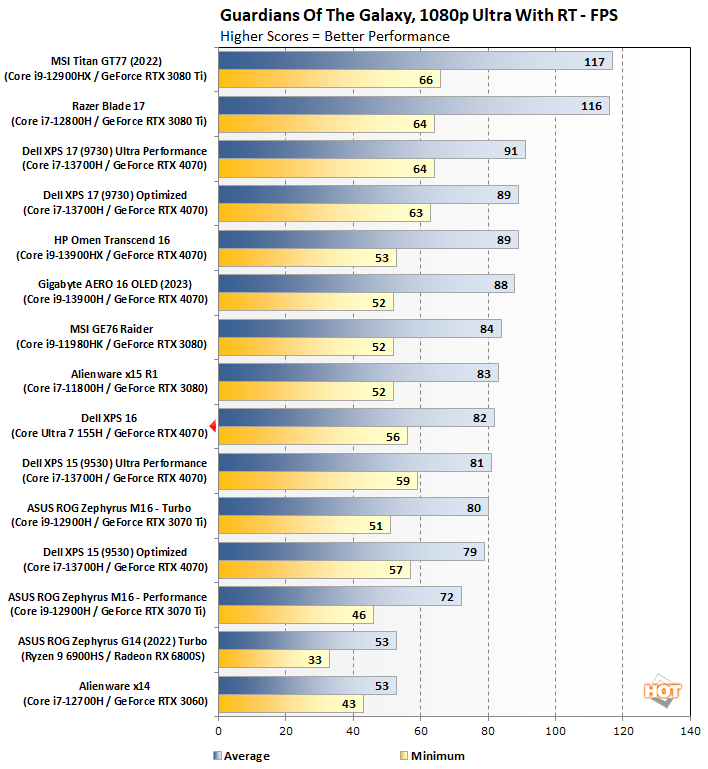
During the 1080p runs, we got an average of 82 fps with the new XPS 16, which put it about in the middle of the pack, just above the XPS 15’s 81 fps.
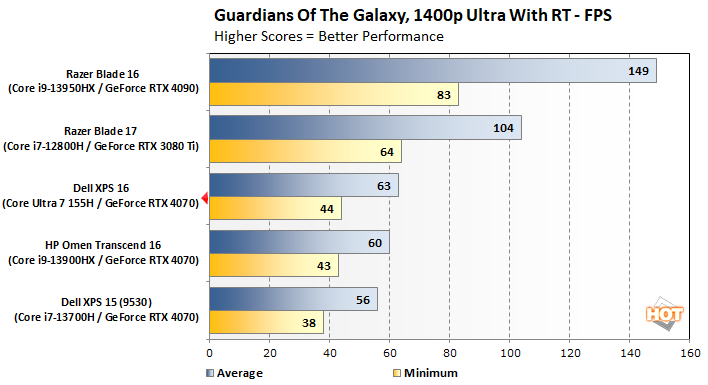
Of course, the frame rate fell when we pushed the resolution to 1440p, but the XPS 16 still kep the game perfectly playable at 63 fps, which again, puts it around the middle of the pack, but above the Omen Transcend 16 and the Dell XPS 15 which reached 60 and 56 fps, respectively.