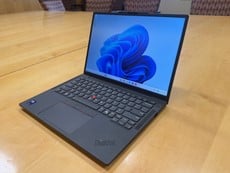


Lenovo ThinkPad X13 Gen 6 Review: An Ultralight Laptop Built For Business


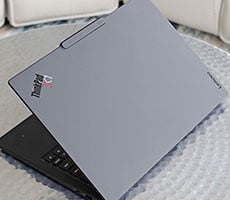
Lenovo ThinkPad X13 Gen Wide Open Hinge (Image: Lenovo)
ATTO Disk Benchmark Results For The ThinkPad X13
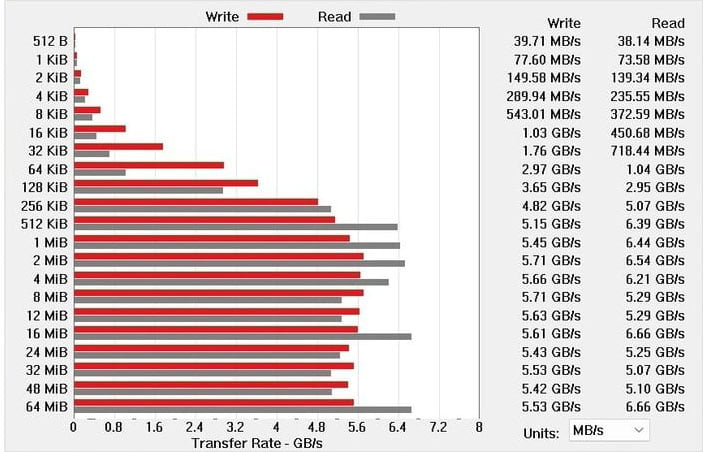
The Lenovo ThinkPad X13 Gen 6 features a Gen 4 NVMe SSD that offers good performance. Reads peaked at over 6.6GB/s and writes averaged about 5.5GB/s once the drive hit its stride. These numbers aren't in-line with the top Gen 4 SSDs on the market, but they are plenty good for a thin and light, business-class laptop.
Web Performance: Speedometer 3
Speedometer 3 was run in the latest version of Google Chrome. The test measures browser responsiveness across simulated productivity web application workloads. Higher scores indicate better performance.
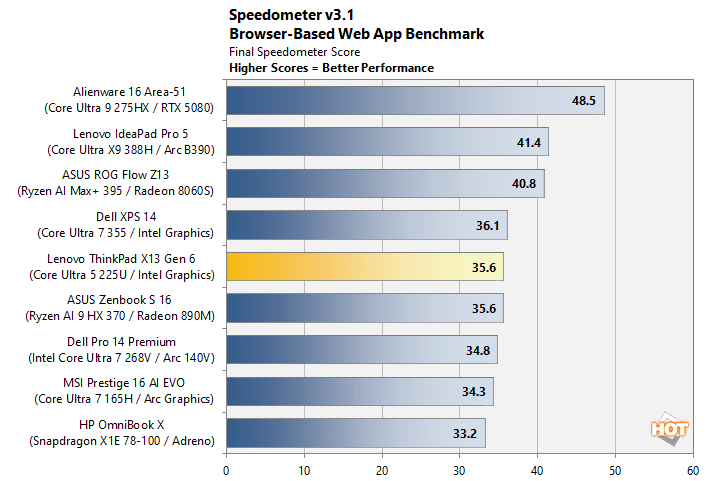
On AC power, the ThinkPad X13 Gen 6 scored 35.6, placing mid-field in the comparison group. That result is in line with what you would expect from a U-series chip — it keeps pace with similarly configured thin-and-light machines and does not fall significantly behind the Dell XPS 14 (36.1), which uses the higher-TDP Core Ultra 7 355. The gap between the two is narrow enough that it would not be noticeable in day-to-day browser use.
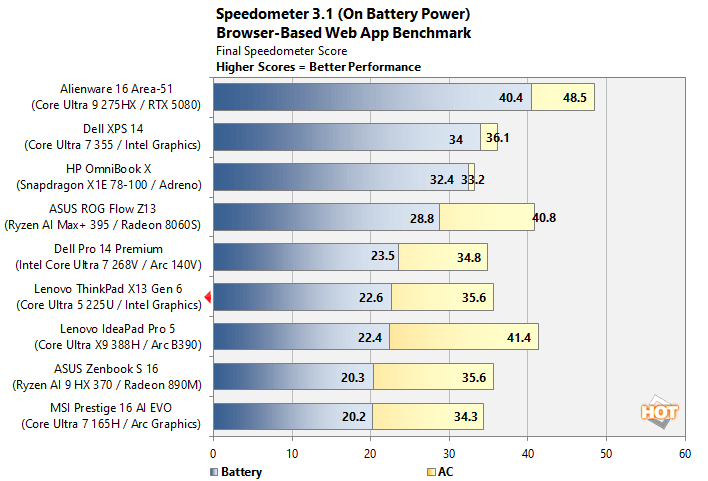
On battery, however, the score dropped sharply to 22.6, which was one of the largest on-battery declines in the test group. The Dell XPS 14 retained 34.0 on battery, and the HP OmniBook X held 32.4. Unlike those machines, the 225U's lower TDP ceiling appears to give Lenovo's power management less headroom to work with, resulting in more aggressive throttling when unplugged. For users who rely on browser-based tools or video conferencing away from a power source, expect somewhat lower performance when operating on DC / battery power.
Office Productivity: PCMark 10
PCMark 10 was run using the default benchmark settings. The test simulates real-work, office-type workloads across Microsoft Word, Excel, PowerPoint, and Edge. Higher scores indicate better performance.
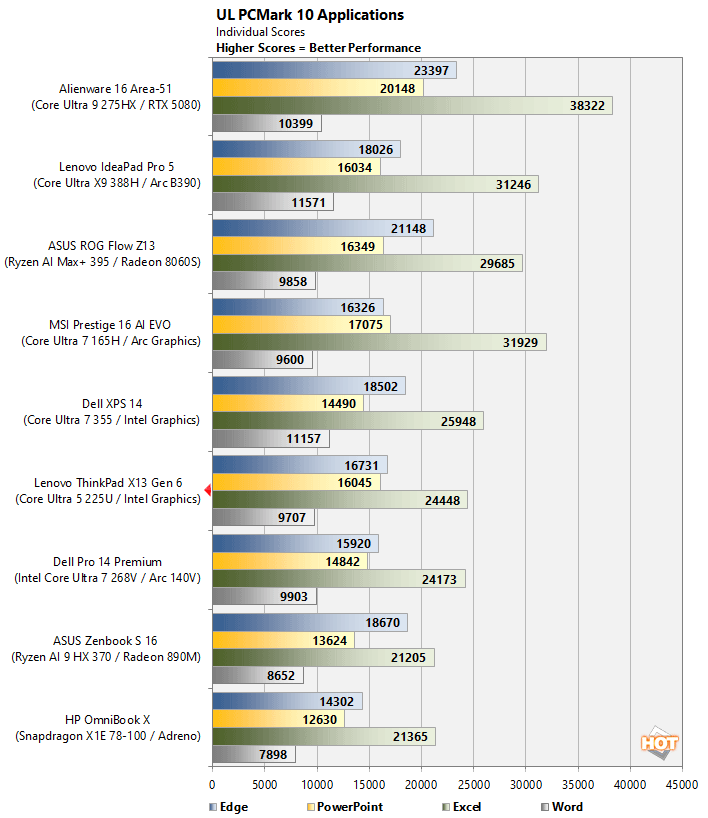
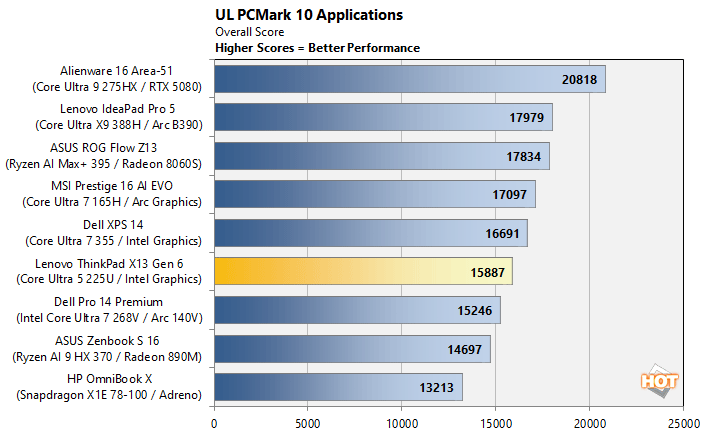
The ThinkPad X13 Gen 6 recorded an overall score of 15,887, placing it ahead of several machines with comparable or nominally faster processors, including the Dell Pro 14 Premium (15,246) and ASUS Zenbook S16 (14,697). The Excel sub-score of 24,448 was the highest among the U-series and similarly-configured machines in the group. The gap to higher-TDP systems like the MSI Prestige 16 AI EVO (17,097) and IdeaPad Pro 5 (17,979) is real but not dramatic for typical office tasks. Where those machines pull away more clearly is in heavily multi-threaded sub-tests, which reflects the additional cores and thermal headroom their H-class processors provide.
CPU Performance: Geekbench 6
Geekbench 6 measures single- and multi-threaded CPU performance using a standardized workload suite, composed of multiple, quick-running tests of various applications. Higher scores indicate better performance.
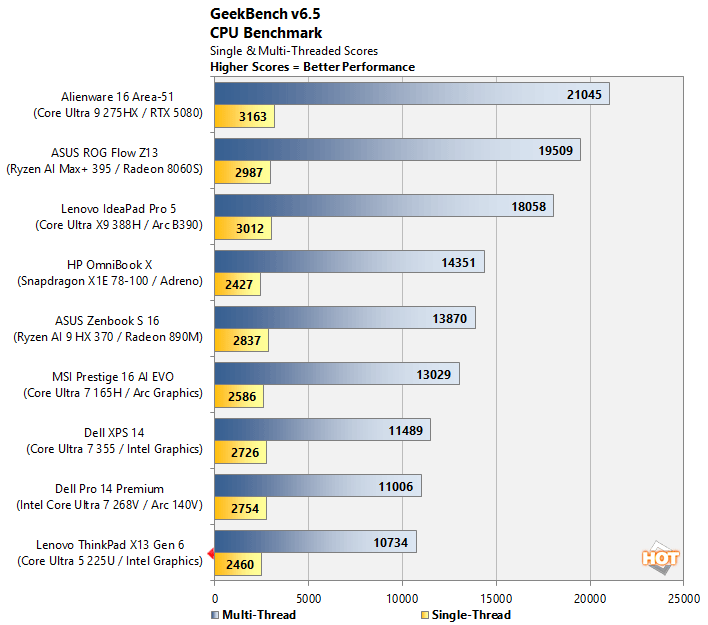
The ThinkPad X13 Gen 6 scored 2,460 single-thread and 10,734 multi-thread, the lowest results in the test group across both categories. The closest comparison is the Dell Pro 14 Premium (2,754 / 11,006), which also uses a U-series chip but Intel's Core Ultra 268V — a more recent and slightly more performant part. The multi-thread gap widens considerably against H and HX-class machines; the Alienware 16 Area-51 with its Core Ultra 9 275HX scored 21,045 multi-thread, nearly double the X13 Gen 6. This is a direct consequence of the 225U's lower core count and TDP, and is consistent with what Geekbench typically shows when comparing U-series to H-series silicon. This isn't a bad result for the ThinkPad X13 Gen 6 by any means, it just highlights the differences between a U-series and higher powered processors.
CPU Rendering: Cinebench 2026
Cinebench 2026 was run in Advanced Mode with the 10-minute stabilization timer disabled. The test renders a Cinema 4D scene using the CPU only. Battery performance was also measured to assess throttling behavior when unplugged.
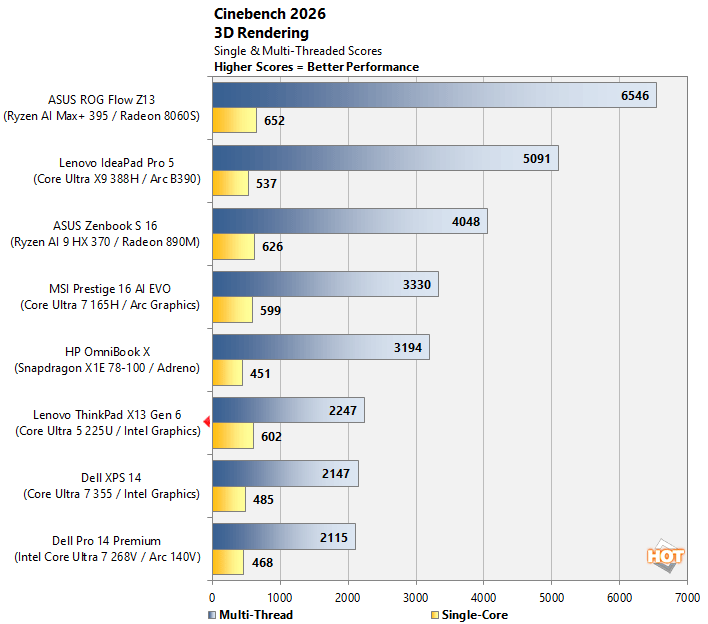
On AC power, the ThinkPad X13 Gen 6 posted a single-core score of 602, which is a reasonably strong result for a U-series chip and sits above the Dell Pro 14 Premium (468), Dell XPS 14 (485), and HP OmniBook X (451). Intel's per-core performance in this generation holds up well in single-threaded tasks regardless of the processor tier. Multi-thread performance of 2,247 is lower, reflecting the 225U's limited core count compared to H-class alternatives.
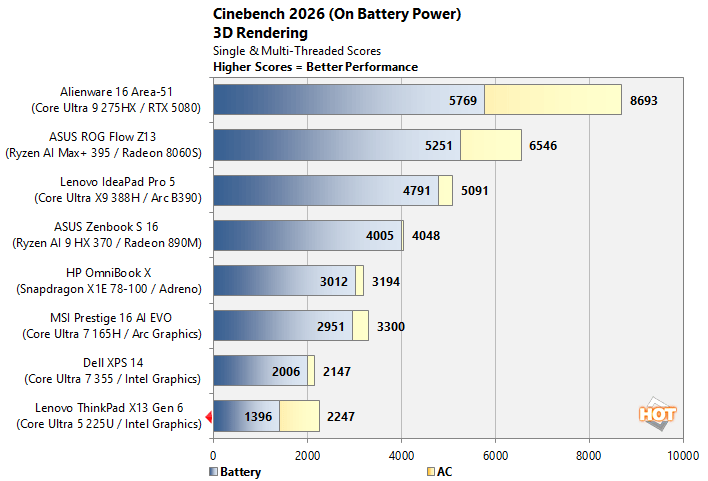
On battery, the multi-thread score fell to 1,396, a drop of approximately 38%. This was the steepest battery-to-AC performance reduction in the test group. The ASUS Zenbook S16 (Ryzen AI 9 HX 370) retained 99% of its multi-thread score on battery, and the HP OmniBook X (Snapdragon X1E) held 94%. The difference likely comes down to platform power management — both the Ryzen AI and Snapdragon platforms are designed with sustained efficiency as a priority, while the 225U appears to have a narrower power band to operate in when the adapter is removed to maximize battery life.
CPU Threading: 3DMark CPU Profile
The 3DMark CPU Profile measures how CPU performance scales across thread counts, from a single thread up to the processor's maximum. Default benchmark settings were used.
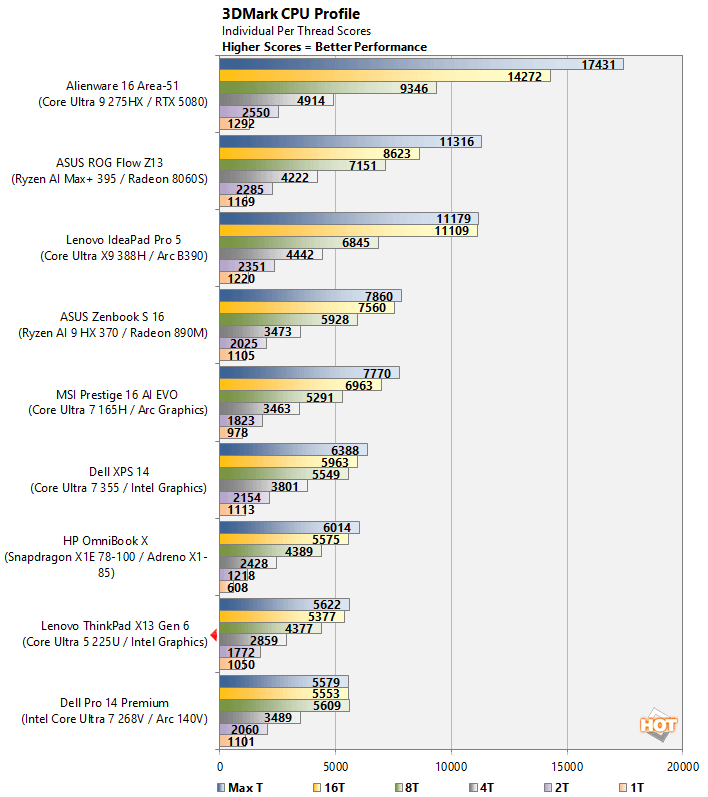
The X13 Gen 6 scored 1,050 at 1T and 5,622 at max threads. Single-thread performance is close to the Dell Pro 14 Premium (1,101) and ASUS Zenbook S16 (1,105), which is consistent with the single-core results seen in Cinebench. The scaling drop-off at higher thread counts is where the lower core count of the 225U becomes apparent. The IdeaPad Pro 5 and Alienware 16 Area-51 scored 11,179 and 17,431 respectively at max threads, driven by their higher core count H and HX processors.
Graphics: 3DMark Steel Nomad Lite
3DMark Steel Nomad Lite measures GPU rendering performance with a simulated gaming and graphics workload. Default benchmark settings were used. Higher scores indicate better GPU performance.
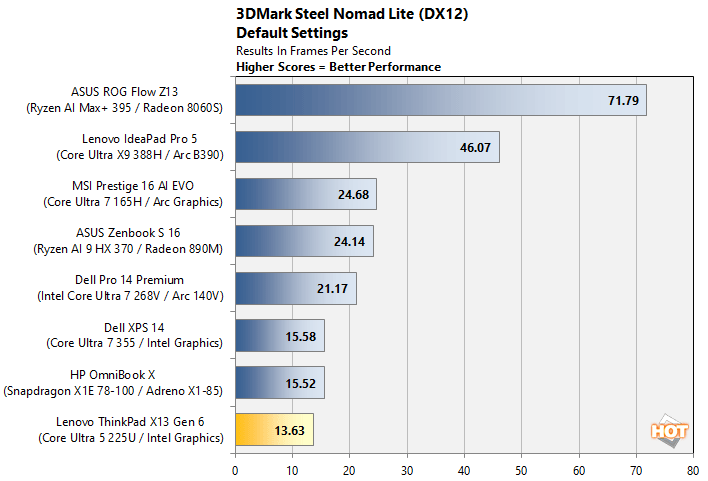
The ThinkPad X13 Gen 6 scored 13.63 FPS, the lowest result in the group. The HP OmniBook X (15.52 FPS) and Dell XPS 14 (15.58 FPS) were close, both also used integrated graphics rather than discrete GPU solutions. The more significant separation comes from machines equipped with Intel Arc or AMD RDNA-based integrated graphics — the Dell Pro 14 Premium with Arc 140V reached 21.17 FPS, and the ASUS Zenbook S16 with Radeon 890M reached 24.14 FPS. The Intel integrated graphics in the 225U are a generation behind and feature fewer execution units than the Arc-class implementations, which explains the gap.
Gaming Performance With The ThinkPad X13 Gen 6
Although the ThinkPad X13 Gen 6 is not a gaming machine and Lenovo makes no claims of the sort, we still tested a couple of games to evaluate relative performance between systems. Two gaming titles were tested: F1 2025 at 1080p using the High preset with TAA only and dynamic resolution disabled, and Talos Principle 2 at 1080p Medium with native resolution and no upscaling enabled.
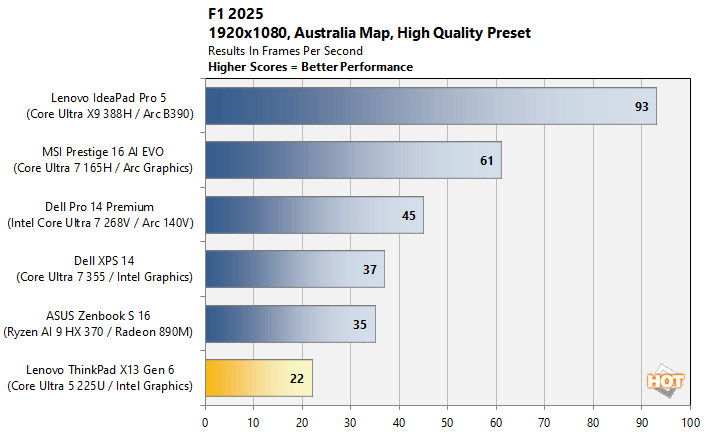
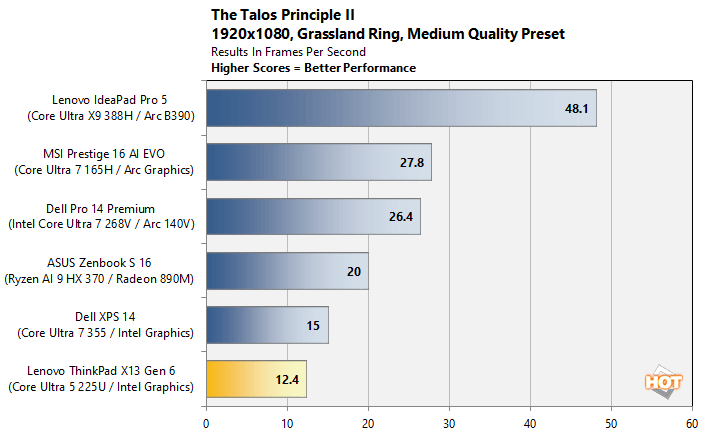
The ThinkPad X13 Gen 6 averaged 22 FPS in F1 2025 and 12.4 FPS in Talos Principle 2, which were the lowest results in the test group for both titles. The Intel integrated graphics in the 225U are not intended for gaming workloads, and the scores reflect that. Even among the other integrated-graphics machines in the group, the X13 Gen 6 trailed the ASUS Zenbook S16 (35 FPS / 20 FPS) by a noticeable margin — a gap attributable to the Radeon 890M's significantly higher compute unit count and memory bandwidth compared to Intel's basic graphics engine in the 225U.
AI Performance: Procyon AI
UL's Procyon AI Computer Vision test was used to measure NPU performance. The test simulates AI-accelerated tasks such as background segmentation and subject tracking. Higher scores indicate greater NPU throughput.
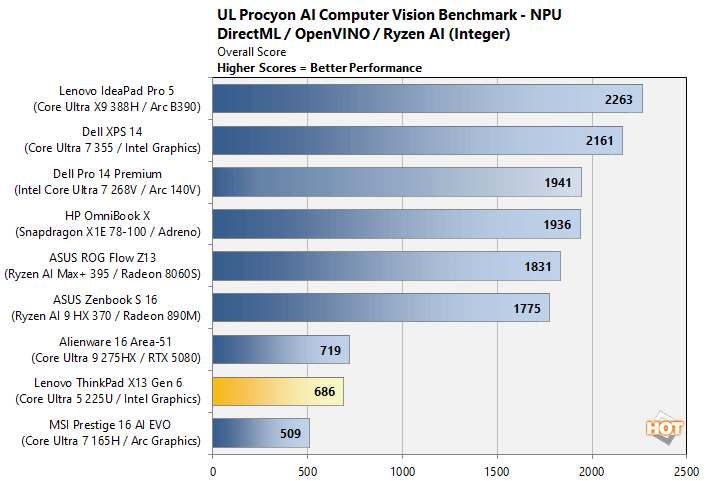
The ThinkPad X13 Gen 6 scored 686 on the NPU Integer test, placing it second from the bottom above the MSI Prestige 16 AI EVO (509). The Intel NPU in the 225U is a lower-tier implementation compared to what Intel offers in its higher-end Core Ultra 200V and 200H series, which partly explains the result. AMD's XDNA 2 NPU in the Ryzen AI 9 HX 370 (ASUS Zenbook S16, 1,775) and Qualcomm's Hexagon NPU in the Snapdragon X1E (HP OmniBook X, 1,936) are more purpose-built for AI inference workloads of this type and shows in this test.
Content Creation: Puget Bench for DaVinci Resolve 20.3
Puget Bench for Creators with DaVinci Resolve 20.3 was run using the Standard preset, with v1.2.2 of the test. The benchmark measures performance across video editing, color grading, and export tasks. Higher scores indicate better performance.
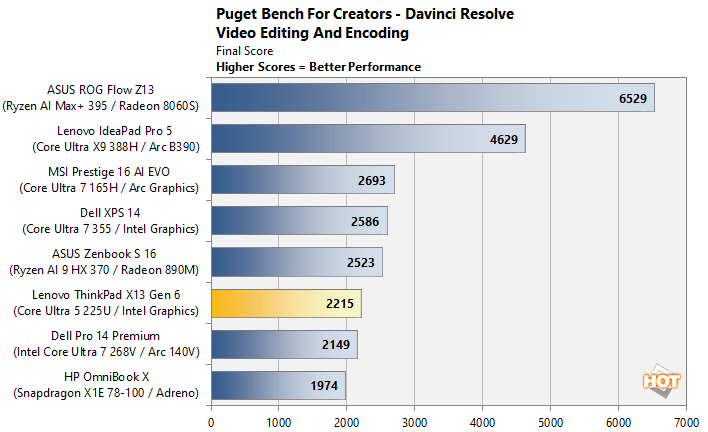
The ThinkPad X13 Gen 6 scored 2,215, placing it above the HP OmniBook X (1,974) and narrowly ahead of the Dell Pro 14 Premium (2,149). The ASUS Zenbook S16 (2,523) and Dell XPS 14 (2,586) scored modestly higher, with the latter benefiting from a higher-TDP processor and more GPU execution units. The IdeaPad Pro 5 (4,629) and ASUS ROG Flow Z13 (6,529) are in a different class entirely, both leveraging discrete or high-performance integrated GPU configurations. DaVinci Resolve performance in the X13 Gen 6 is adequate for light editing work, but the integrated graphics become a bottleneck on heavier timelines or when using many GPU-accelerated effects.
Let's look at temps, acoustics and battery life, next...