

Samsung 990 SSD Review: A Low-Power, Mainstream QLC SSD In The AI Era


| Samsung 990: 1TB $269, 2TB $529 The new Samsung 990 family of solid state drives features the company's high-capacity QLC NAND flash memory for improved efficiency and optimized cost.
|
|||

|

|
||
Take a look at the Samsung 990’x main features and specifications below, and then we’ll dive in a little deeper to see how the drive compares to an array of competitive offerings, including Samsung’s own drives, with a mix of different benchmarks…

Samsung SSD 990 EVO Plus Specifications And Features

Find Samsung 990 SSDs @ Amazon
All of the drives in the Samsung 990 series use the same M.2 (2280) "gumstick" form factor and offer peak read bandwidth of up to 7.15GB/s – 7.25GB/s, with write bandwidth that tops out at 6.45GB/s, which is a step up from the 990 EVO's 5GB/s (reads) and 4.2GB/s (writes), but not quite as high as the flagship 990 Pro.

The drives’ max IOPS ratings vary depending on queue depth and capacity, but peak at approximately 850K for reads and 1,200K for writes. The 990’s endurance ratings also vary based on capacity, peaking at 800TBW for the big 2TB drive (coming out to 400TBW per TB). As you'd expect, endurance drops as capacities decrease, but endurance is considerably lower than some of Samsung's other drives.
Samsung 990 series SSDs feature the company's latest QLC V-NAND and a variant of Samsung's Piccolo controller--it's labeled PiccoloQ. The original Piccolo controller was manufactured at 5nm and has a native PCIe Gen 5 interface and support for the NVMe 2 protocol. The controller could operate at either PCIe Gen 4 x 4 or PCIe Gen 5 x 2 on the 990 EVO Plus to optimize power consumption, but maintain similar performance levels (PCIe Gen 4 offers 2X the bandwidth of Gen 4). With this new 990, however, the drive only operates at Gen 4x4. The Samsung Piccolo controller supports all of the features you’d expect from a current SSD, like TRIM, garbage collection, S.M.A.R.T., etc., and it supports various encryption technologies as well.

These Samsung 990 drives are also single-sided, with no components on the bottom of the PCB, and they don't feature a DRAM cache either, so the drives are reliant on a system’s Host Memory Buffer (HMB).
Like other mainstream Samsung SSDs, the 990 also features TurboWrite technology. TurboWrite uses a portion of the NAND as an SLC write buffer. This improves write performance as long as the buffer isn’t exhausted. The TurboWrite buffer size dynamically adjusts based on the workload; Samsung didn't provide any specific data on the potential size of the cache, but it's immaterial. You have to write a continuous 1.2TB to the drive at full speed before performance drops off considerably, which isn't going to happen very often, if at all.

The Samsung 990's power consumption characteristics also vary based on capacity, but idle power should be around 3mW in L1.2 mode and during active reads and writes, power falls within the 3.8W – 4.3W range, with the 2TB drive. The 1TB model consumes slightly less. Those numbers are lower than the Samsung 990 EVO, which makes this drive a good candidate for small form factor systems and thing and light laptops.
Samsung warranties the 990 series drives for only 3 years, which is a reduction from the 5 years Samsung used to offer for its consumer-class SSDs. That's probably not going to site well with some folks, but is a reflection of the current market conditions and the use of QLC NAND.
Now, let's see how this 2TB drive performs...
Samsung SSD 990 Benchmarks
Under each test condition, the SSDs featured here were installed as secondary volumes in our testbed, with a separate drive used for the OS and benchmark installations. Our testbed's motherboard was updated with the latest BIOS available at the time of publication and Windows 11 was fully updated as well. Windows Firewall, automatic updates, and screen savers were all disabled before testing, and Focus Assist was enabled to prevent any interruptions.
In all test runs, we rebooted the system, ensured all temp and prefetch data was purged, and waited several minutes for drive activity to settle and for the system to reach an idle state before invoking a test. All of the drives here have also been updated to their latest firmware as of press time. Where applicable, we would also typically use any proprietary NVMe drivers available from a given manufacturer. When not available, the drives used the in-box Microsoft NVMe driver included with Windows 11.Please note, we're comparing the 990 to an array of drives, including Samsung's own 990 Pro, EVO, EVO Plus and competitive PCIe Gen 4 and entry-level Gen 5 drives, in an attempt to paint a clear picture of where the 990 fits in the current landscape.
HotHardware's Test System:
| Processor: Intel Core i9-14900K Motherboard: MSI Z790 Godlike Video Card: GeForce RTX 3080 Memory: 32GB Micron DDR5-6000 Storage: ADATA XPG GAMMIX S70 Blade (OS Drive) Samsung SSD 990 (2TB) Samsung SSD 990 EVO (2TB) Samsung SSD 990 EVO Plus (2TB) Samsung SSD 990 Pro (2TB) Kingston Fury Renegade (1TB) Phison E31T Reference Drive (2TB) |
OS: Windows 11 Pro x64 Chipset Drivers: Intel v10.1.19284 Benchmarks: IOMeter 1.1 HD Tune v5.75 ATTO v4.01.01f AS SSD SiSoftware SANDRA CrystalDiskMark v8.0.4c x64 Final Fantasy XIV: Endwalker PCMark 10 Storage Bench 3DMark Storage Tests |
IOMeter Benchmarks
IOMeter is a well-respected industry standard benchmark. However, despite our results with IOMeter scaling as expected, it is debatable as to whether or not certain access patterns actually provide a valid example of real-world performance. The access patterns we tested may not reflect your particular workloads, for example, or mirror the behavior of actual applications. That said, we do think IOMeter is a reliable gauge for relative throughput, latency, and bandwidth with a given storage solution. In addition, there are certain highly-strenuous workloads you can place on a drive with IOMeter that you can't with most other storage benchmark tools. In the following tables, we're showing two sets of access patterns; a custom Workstation pattern, with an 8K transfer size, consisting of 80% reads (20% writes) and 80% random (20% sequential) access and a 4K access pattern with a 4K transfer size, comprised of 67% reads (33% writes) and 100% random access. Queue depths from 1 to 16 were tested...
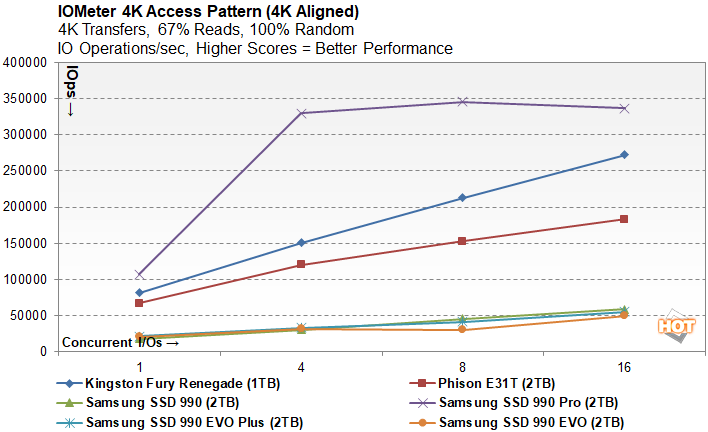
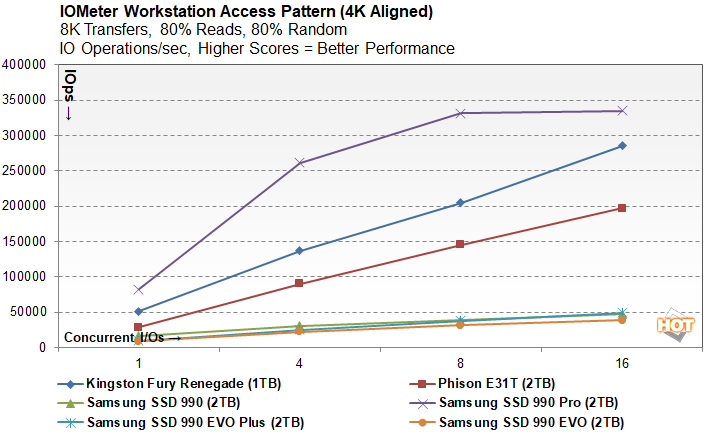
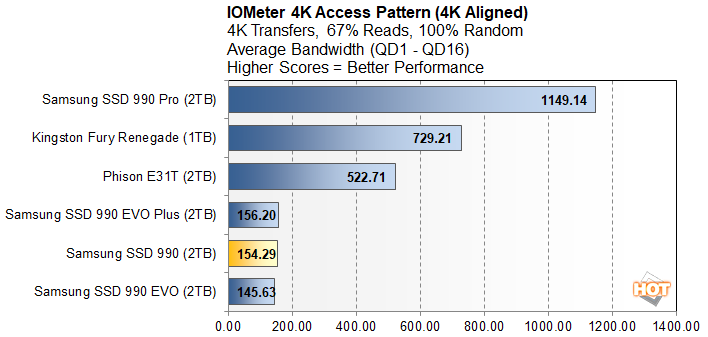
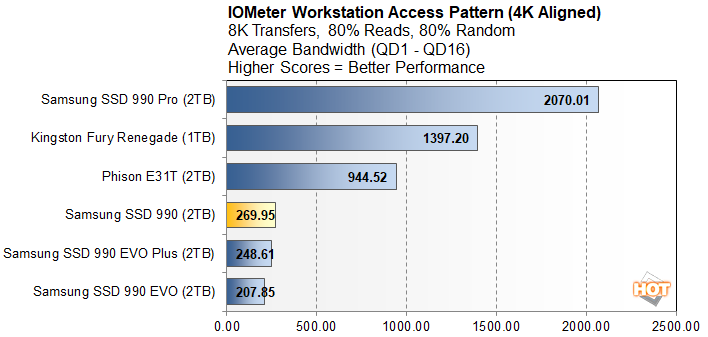
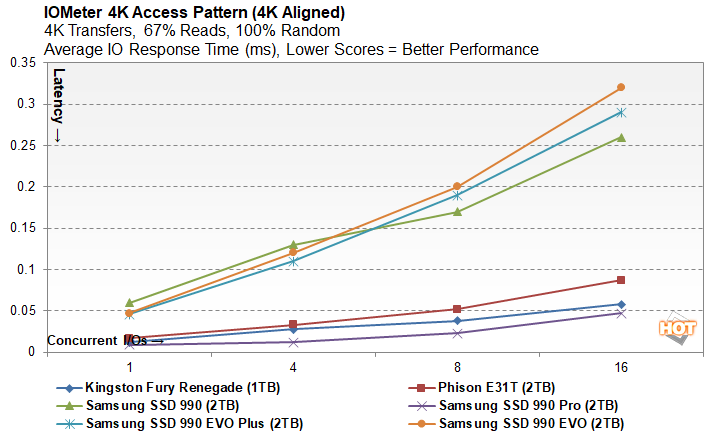
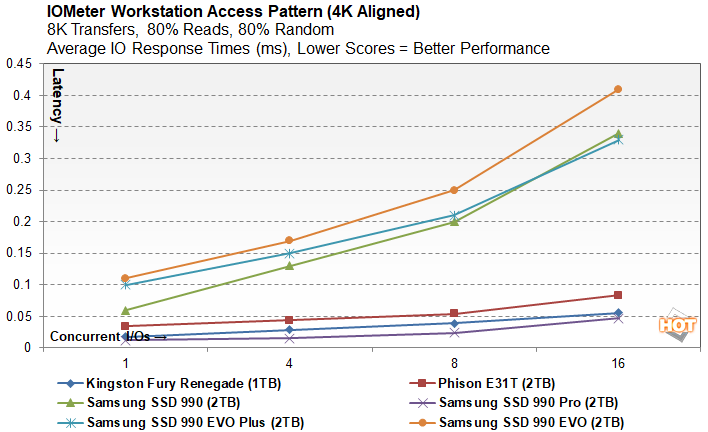
Latency with the Samsung 990 is also relatively high in light of the other drives we tested, but it's better than the EVOs. We expected the Samsung 990 to trail considering its low-power, DRAM-less design, but the E31T is also a DRAM-less drive and looks much better in terms of latency.
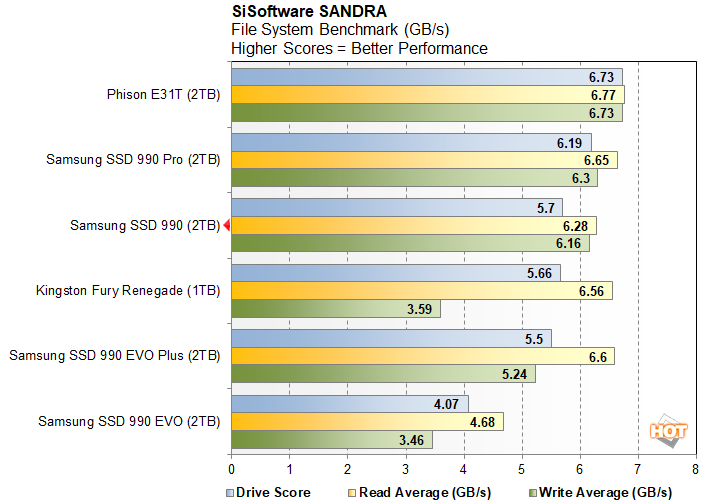
SiSoft SANDRA 2022
ATTO Disk Benchmark
ATTO is another "quick and dirty" type of disk benchmark that measures transfer speeds across a specific volume length. It measures raw transfer rates for both reads and writes and graphs them out in an easily interpreted chart. We chose .5KB through 64MB transfer sizes and a queue depth of 6 over a total max volume length of 256MB. ATTO's workloads are sequential in nature and measure raw bandwidth, rather than I/O response time, access latency, etc.
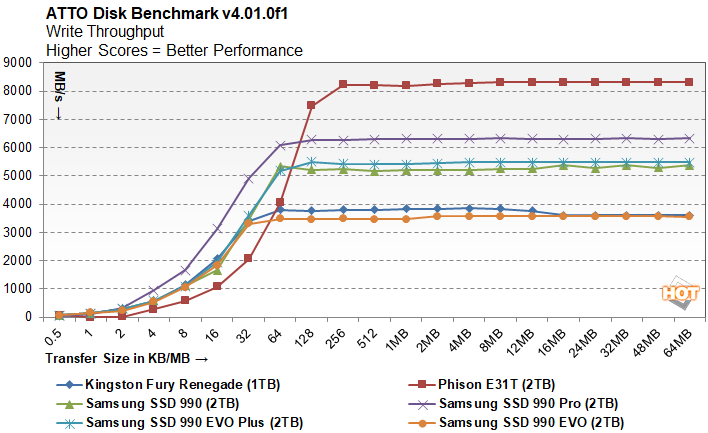
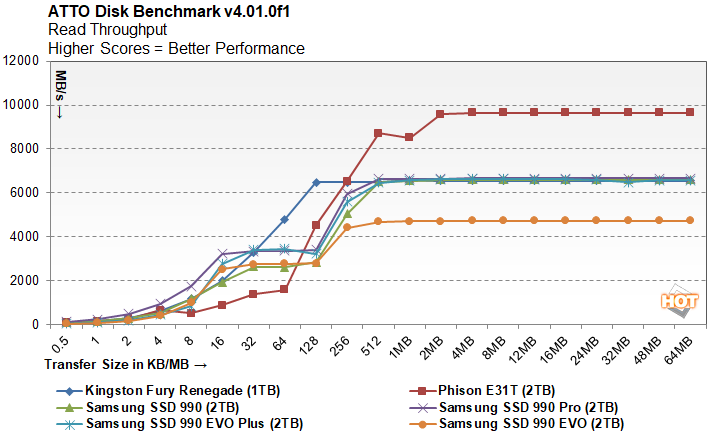
The Samsung 990 finished right about in the middle of the pack in the ATTO disk benchmark, right in-line with its rated specifications. Obviously, the Samsung 990 wasn't going to catch the higher-end 990 Pro or Gen 5 E31T in terms of sequential transfers, but it spanked the original EVO and hung with the other Gen 4 drives.
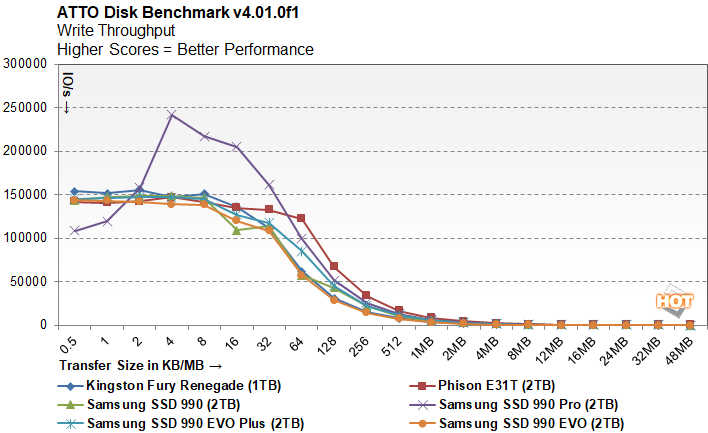
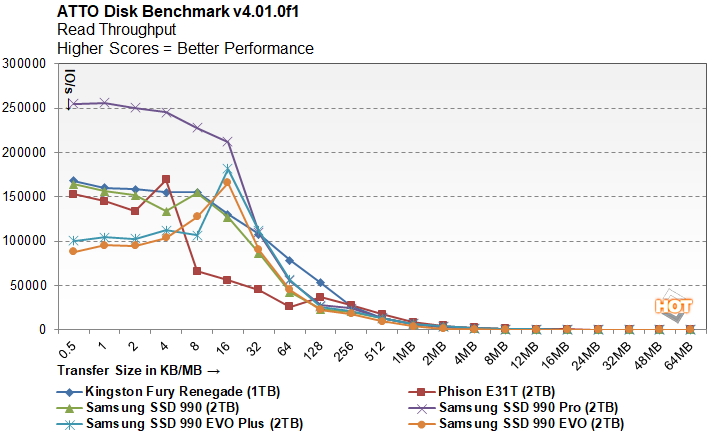
The Samsung 990 is also right in the mix with the other mainstream drives in terms of read and write IOPS, especially with transfer sizes exceeding 8KB.
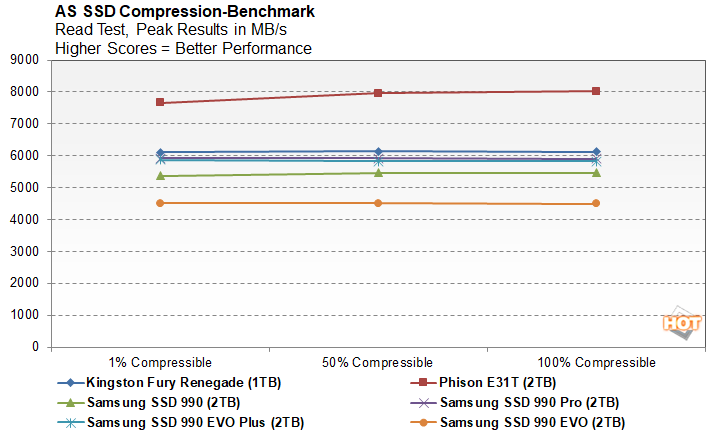
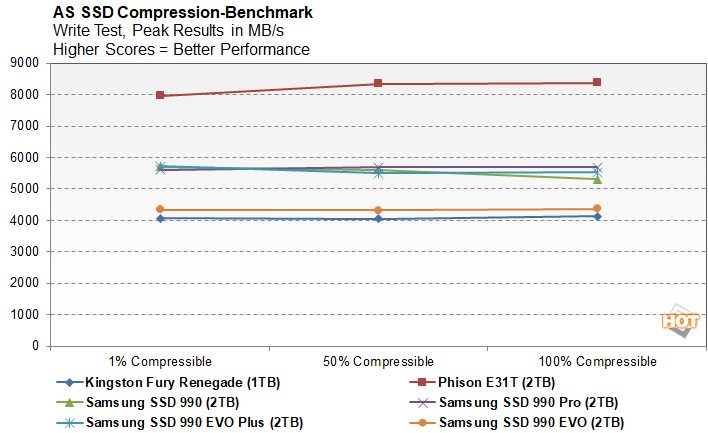
AS SSD Compression Benchmark
Next up we ran the Compression Benchmark built-into AS SSD, an SSD specific benchmark being developed by Alex Intelligent Software. This test is interesting because it uses a mix of compressible and non-compressible data and outputs both Read and Write throughput of the drive. We only graphed a small fraction of the data (1% compressible, 50% compressible, and 100% compressible), but the trend is representative of the benchmark’s complete results.