Intel Xeon 658X Review: 24 Cores, Massive Memory Bandwidth Tested

With the Windows installation complete, we install all of the drivers necessary for our components, disable auto-updating and OneDrive, and install all of our benchmarking software. When that process was done, we performed a disk clean-up, cleared any temp and prefetch data, processed idle tasks, and optimized all of the SSDs using Windows' built-in tools. Finally, we enabled Windows Focus Assist to minimize any potential interruptions and let the systems reach an idle state before invoking any tests.
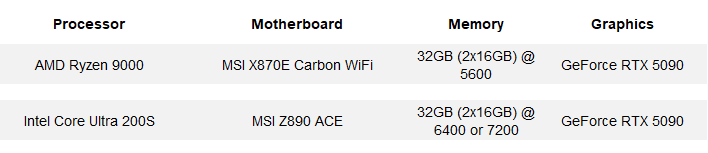
HotHardware's Test Systems:

Geekbench v6.4 CPU Benchmark
The GeekBench CPU tests stress only the processor cores in a system, with mixed single and multi-threaded workloads. The tests are comprised of encryption processing, image compression, HTML5 parsing, physics calculations and other general purpose compute workloads.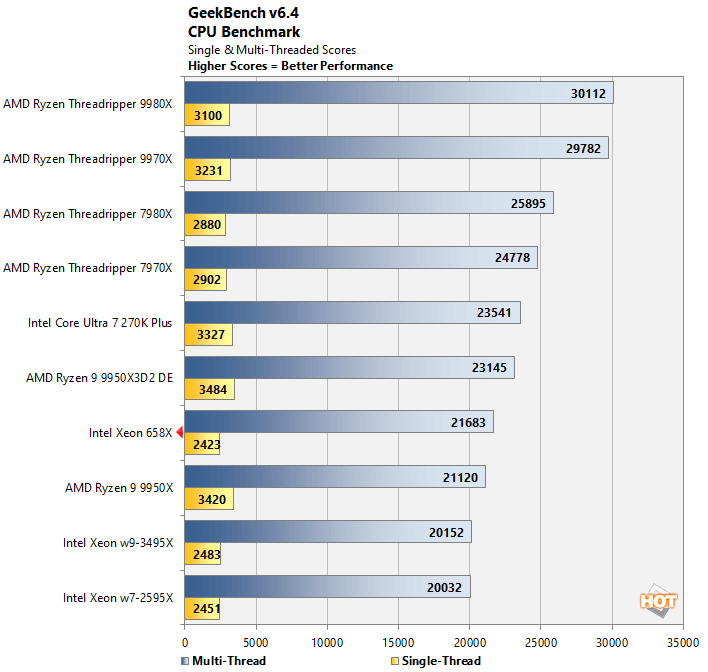
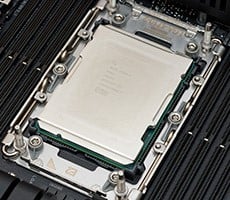
As we begin our benchmarks, just a reminder that the Intel Xeon 658X is a 24-core processor with a max turbo frequency of 4.9GHz, which falls smack dab in the middle of the Xeon 6 series for workstation systems. As such, it's typically not going to hang with higher-core count processors on heavily multi-threaded tests.
In the GeekBench CPU benchmark, the Intel Xeon 658X clearly outruns the previous-gen Sapphire Rapids based Xeon W processors in the multi-threaded test, landing in-between the Ryzen 9 9950X and AMD's flagship desktop CPU, the Ryzen 9 9950X3D2. The Intel Xeon 658X's single-thread score here end up trailing the rest of the pack.
UL PCMark 10 Applications Benchmarks
Next, up we have some full-system testing with PCMark. We're reporting all test results from the PCMark 10 Applications benchmark suite, which uses actual Microsoft Office applications, in addition to the Microsoft Edge browser. The workloads are specific to each Office application (Word, Excel, and PowerPoint), and the Edge tests simulates real-world web browsing.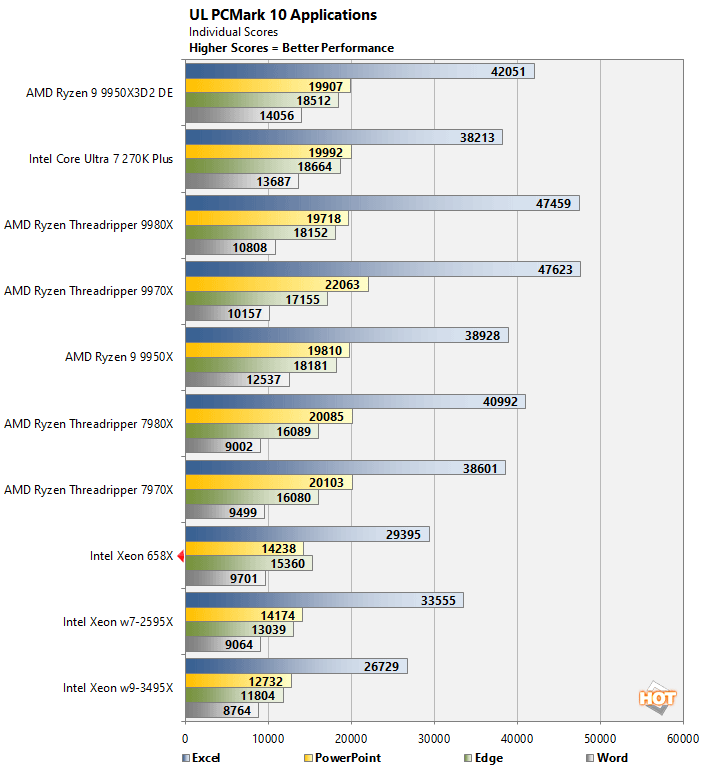
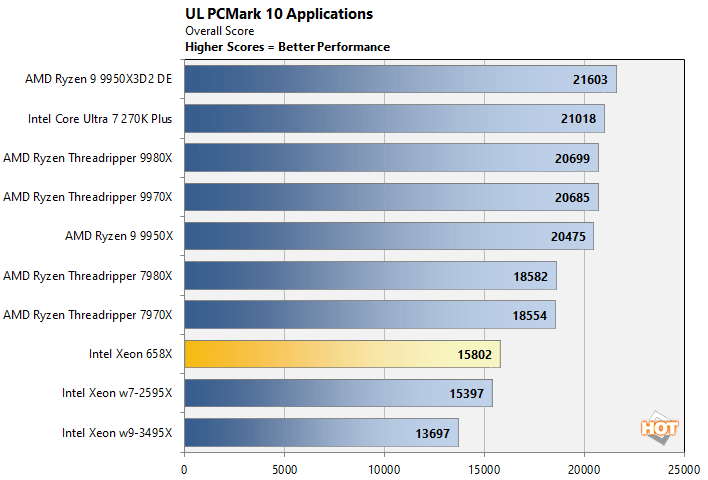
The Intel Xeon 658X once again outpaces the previous-gen Xeon W processor in PCMark's Applications test, but it trailed the rest of the processors. That said, ALL of these processors are obviously powerful enough to any Microsoft Office related workload--the benchmark just exposes the minute performance differences in each application.
Bapco Crossmark Benchmark
Crossmark is a cross-platform benchmark from Bapco that's available for Windows, Android, iOS and MacOS. Like PCMark, Crossmark measures overall system performance and using real-world applications. It provides an overall score based on the results of its Creativity and Productivity benchmarks and system responsiveness tests.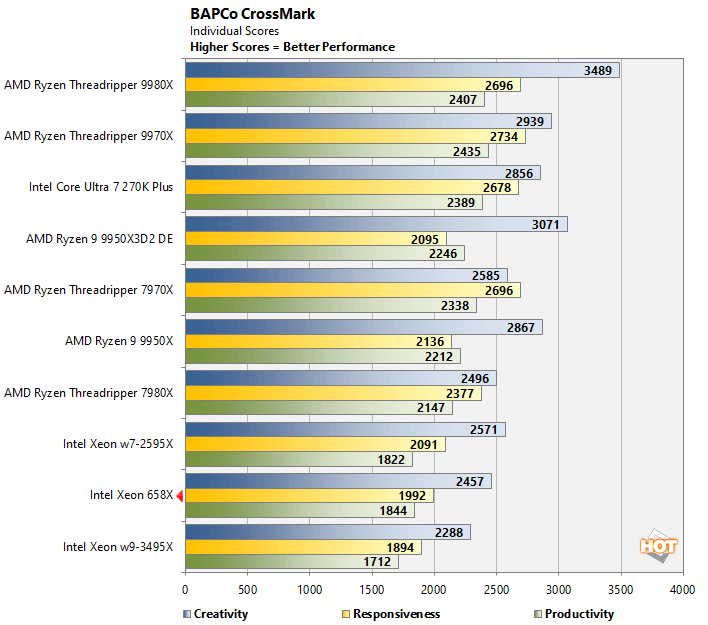
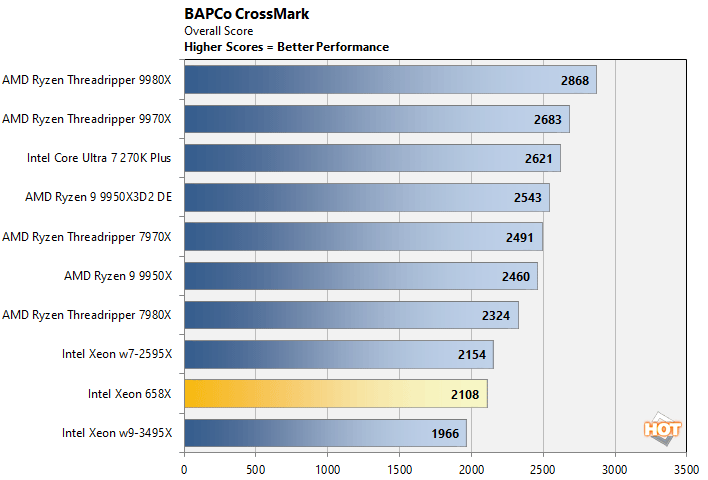
Crossmark was even less forgiving than PCMark 10. This benchmark is influenced not only by processor performance, but latency and responsiveness as well. With this benchmark's workloads, the Intel Xeon 658X finishes just behind the Xeon w7-2595X, trailed only by the w9-3495X.
Browser & Web App Benchmarks: Jetstream 2.2 And Speedometer 3.1
Next up, we have some numbers from the Speedometer 2.0 and Jetstream 2 tests available at browserbench.org. The Speedometer Benchmark Suite uses a wide array of latency and throughput benchmarks to evaluate web application performance, while Jetstream evaluates Javascript and WebAssembly performance; both tests take all of their individual results and tabulate them into a final score.These benchmarks measure performance of an array of browser-based technologies used on modern, rich web applications. Scores in these benchmark are an indicator of the performance users would see when browsing the web and running advanced web apps. All of the systems were tested using the latest version of Google Chrome, with default browser settings, on a clean, fully-updated install of Windows 11.
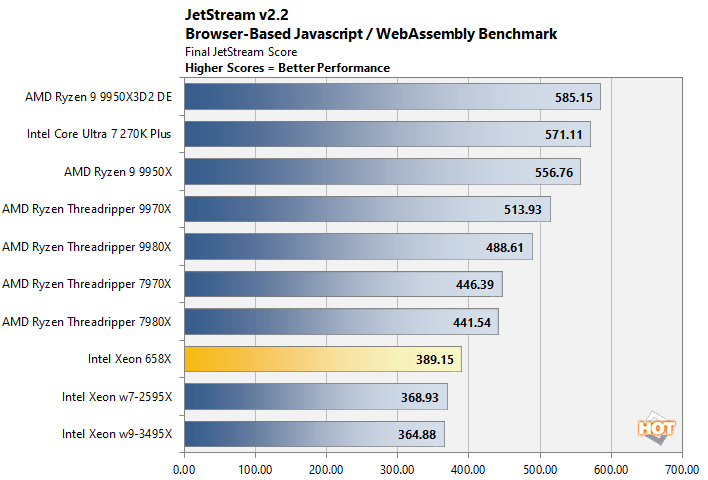
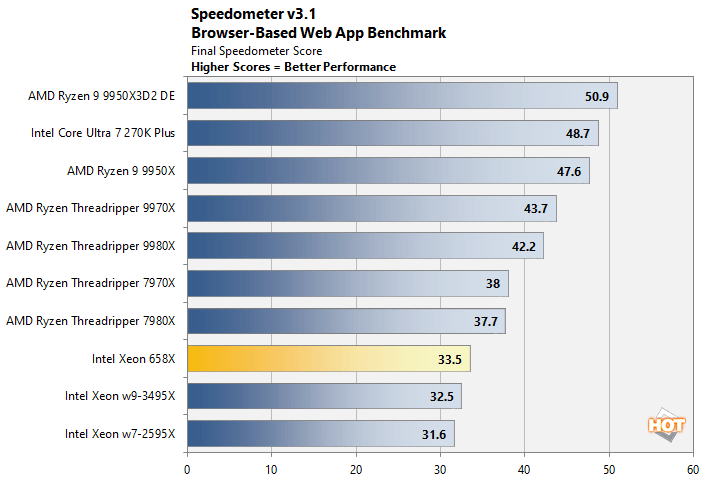
Obviously all of these processors are plenty fast enough to browse the web. And the Intel Xeon 658X's newer architecture gives it a leg up over the previous-gen Xeon W processors. The Intel Xeon 658X, however, ultimately trails all of the other many core processors here, especially the top-end desktop chips that tend to turbo to much higher frequencies.
7-Zip Data Compression & Decompression Tests
The 7-Zip benchmark measures compression and decompression performance using the LZMA method, which leverages the Lempel–Ziv–Markov chain algorithm to perform lossless data compression. The benchmark produces a final rating in GIPS (giga instructions per second).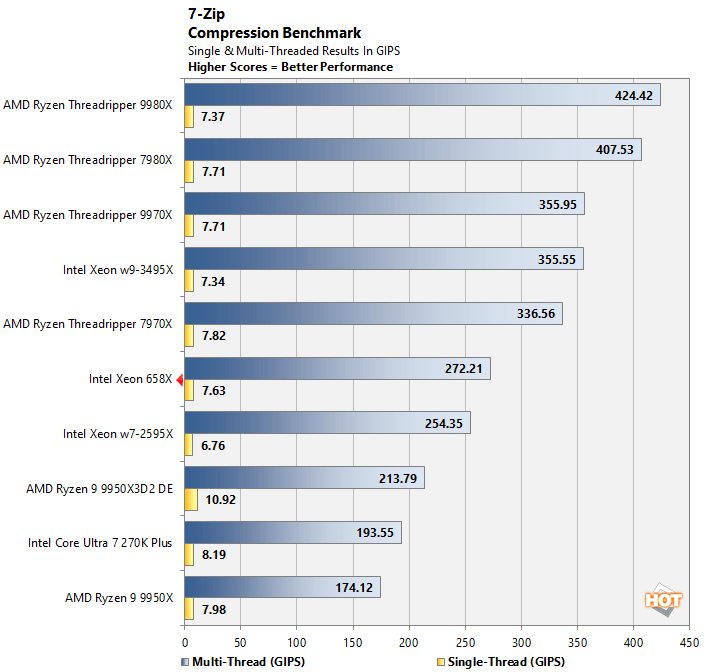
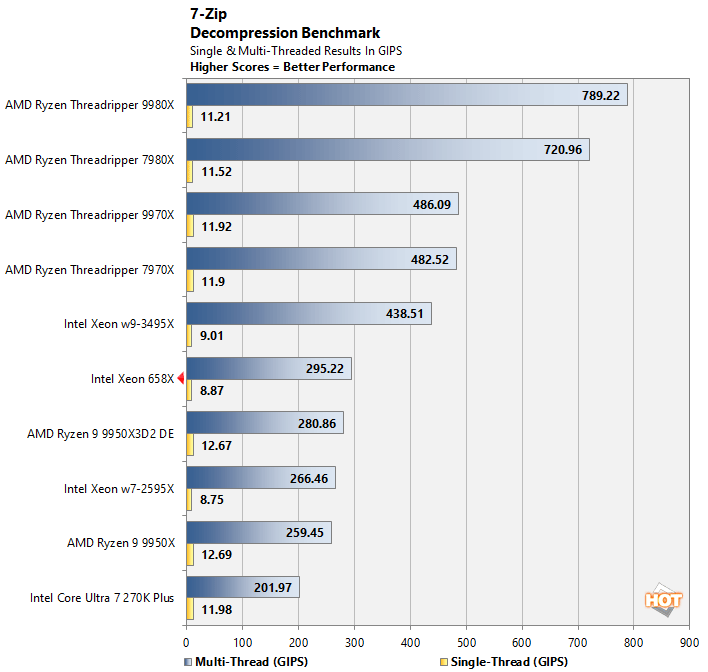
The Intel Xeon 658X performs relatively well in 7-Zips compression and decompression tests. It offers middling single-thread performance, but its multi-thread performance that's clearly better than the mainstream desktop chips and the previous-gen Xeon w7. The AMD Threadripper chips dominate here, though.