Core Ultra 7 270K Plus & Ultra 5 250K Plus Review: Intel Boosts Cores, Clocks And Gaming

The 3DMark CPU Profile test is multi-threaded and reports results for six different thread levels, including single-thread and maximum threads...
UL 3DMark CPU Profile Benchmark
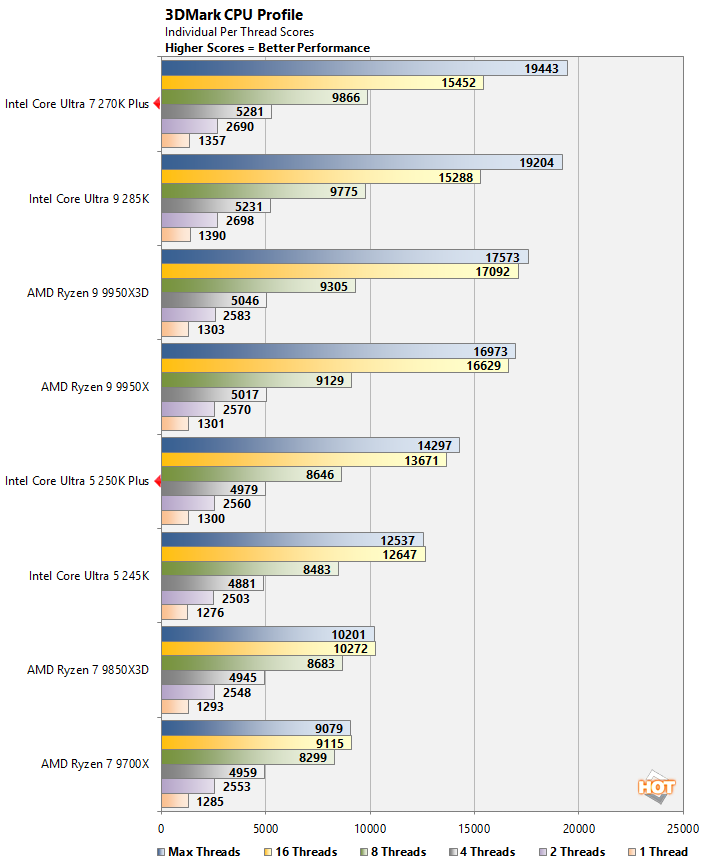
The new Core Ultra 7 270K Plus finishes in the lead once more, with the Core Ultra 5 250K Plus trialing only the flagship AMD and Intel processors. Note that despite supporting more threads due to their support for SMT, the AMD processors don't scale as well as the Intel processors in the max thread test here.
High And Low Resolution Gaming & Graphics Benchmarks
We also ran some mid and high-resolution game and graphics benchmarks on our test rigs with 3DMark, F1 2024, Final Fantasy XIV: Dawntrail and The Talos Principle 2. We used 3DMark's default Steel Nomad preset, and the games were run in two different configurations — either 1080p with Medium/High details, or 4K with High/Extreme details. The lower resolution tests are designed to be more CPU bound to better isolate processor performance, while the higher resolution tests are more GPU bound, where the CPU should have less of an impact.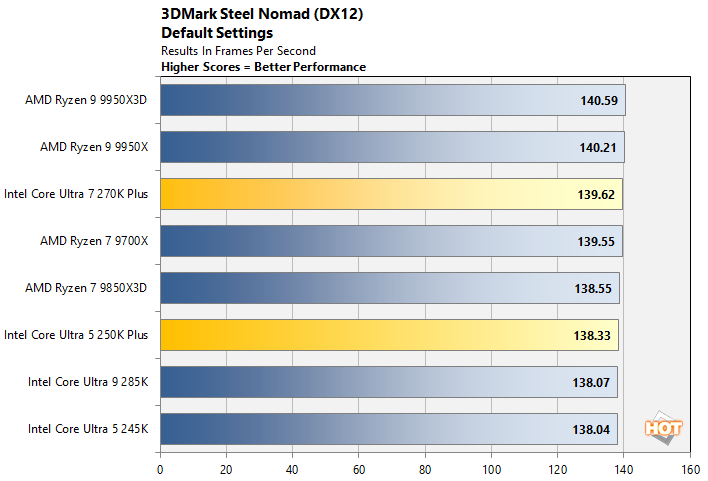
Even with a GeForce RTX 5090 in our test bed, 3DMark's Steel Nomad test is GPU bound and all of the systems are essentially tied.
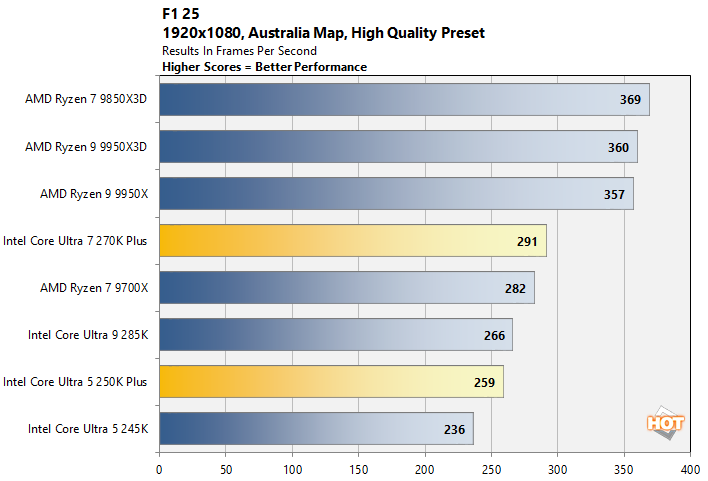
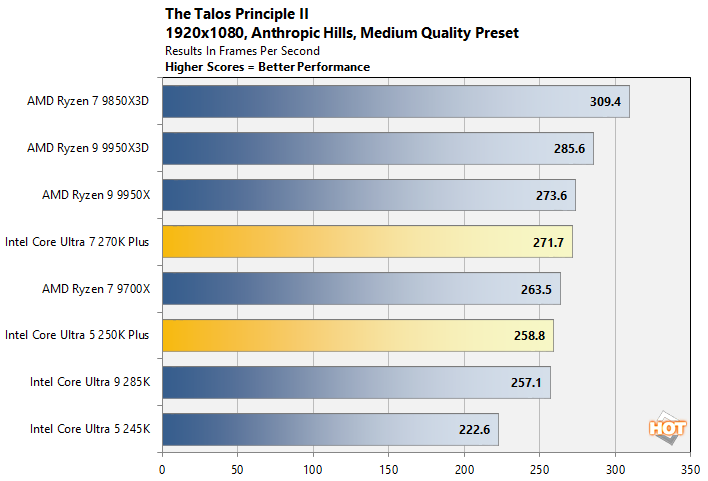
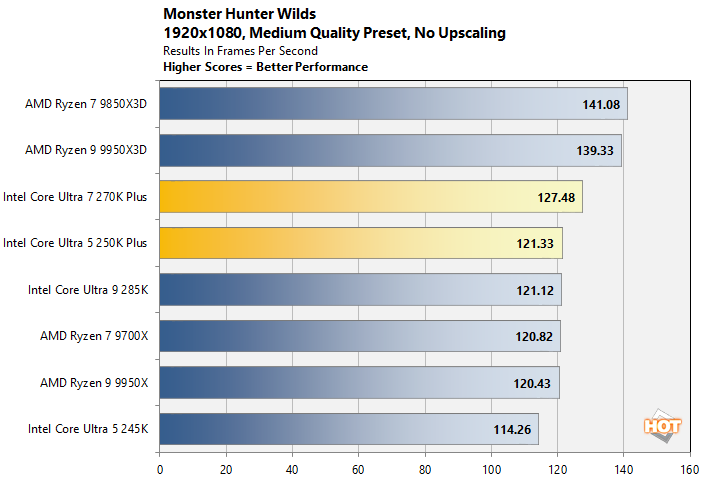
A clear picture emerges in our 1080p game tests. There's no matching the 3D V-Cache equipped Ryzen X3D processors in our low resolution game tests; they finish at the top of the charts with all three games we tested. The Core Ultra 270K Plus is simply the fastest Intel processor, however, and the Core Ultra 5 250K Plus is clearly superior to its predecessor, the Core Ultra 5 245K.
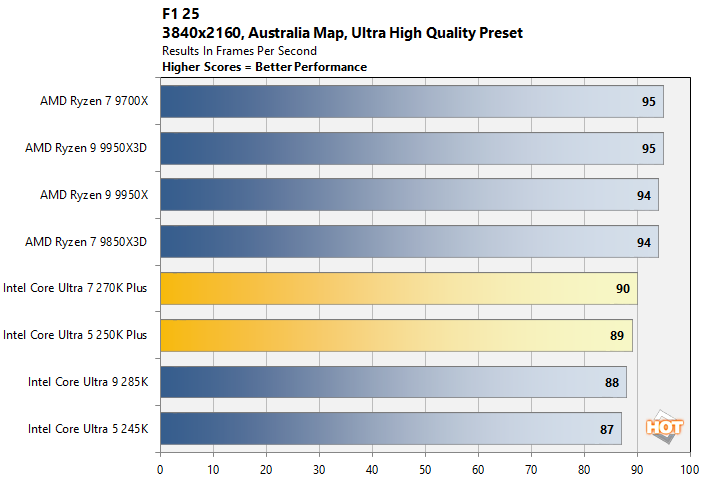
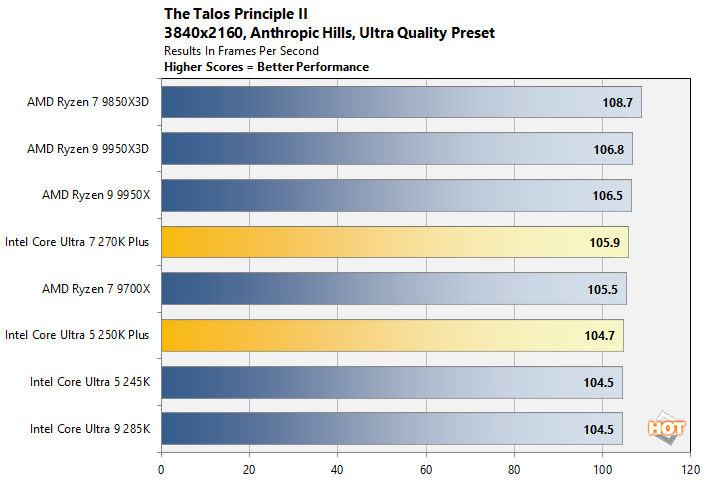
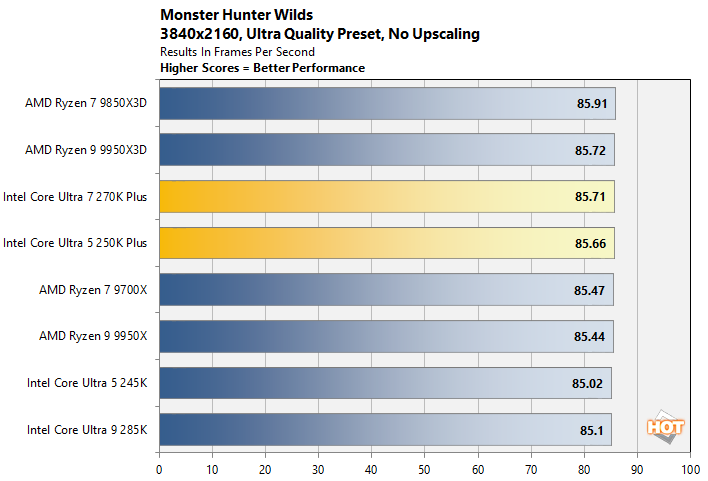
Upping the resolution and image quality levels to shift the performance bottleneck onto the GPU compresses the deltas significantly. In F1, the AMD Ryzen X3D processors still hold onto a measurable lead, which shrinks somewhat in The Talos Principle, and in Monster Hunter Wilds, all of the systems are effectively tied.
Intel Core Ultra 200S Plus Series Power Consumption
Throughout all of our benchmarking and testing, we also monitored how much power our test rigs were consuming with a power meter. Our goal here is to give you an idea as to how much power each configuration used while idling at the Windows desktop and while under taxing CPU workloads across one or all cores. Keep in mind, this is total system power consumption being measured at the outlet and not the the individual power being drawn by the CPUs alone.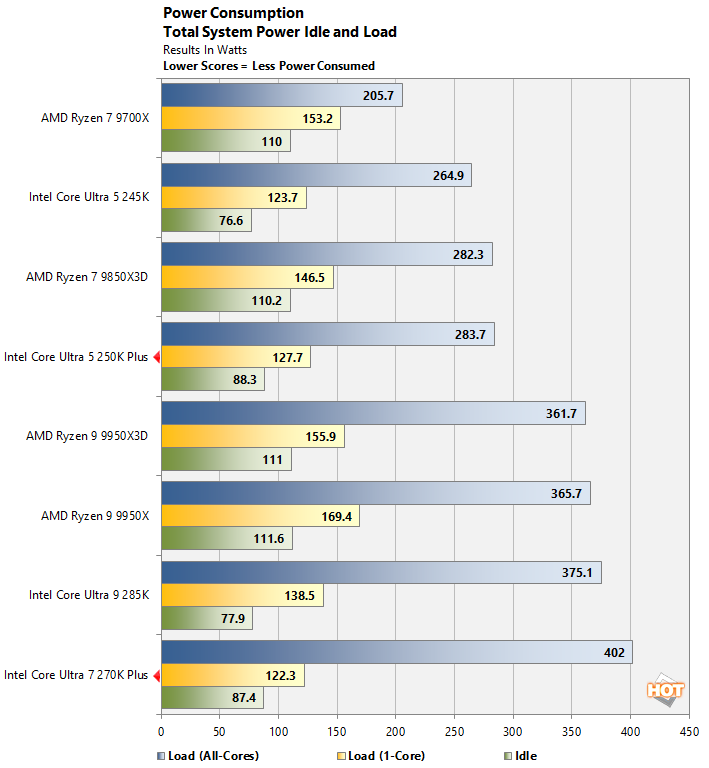
Considering the Core Ultra 200S Plus series' higher frequencies, speedier D2D interconnects, and official support for higher speed memory, it's no surprise these processors consumer more power than their predecessors. The Core Ultra 7 270K Plus consumed the most power overall when under a sustained multi-threaded workload, which is commensurate with its increased performance. The more modestly clocked Ultra 5 250K Plus consumed moderately more power than the Ultra 5 245K, but the 250K Plus also has for more E-Cores.

Intel Core Ultra 5 250K Plus Hardware Details - 3DMark

Intel Core Ultra 7 270K Plus Hardware Details - 3DMark
The charts above represent how the new Core Ultra 200S Plus series processors behave in terms of frequencies and thermals under various levels of stress. This data is gathered during 3DMark's CPU Profile test, which runs with a varying number of threads from just one all the way up to "as many as the CPU can handle." As you can see, both processors typically peak in their respective 5.3GHz to 5.5GHz max boost clock range and temperatures under our modest Corsair 240mm AIO cooler peak in the mid-70°C range in the 16 and max-thread tests.