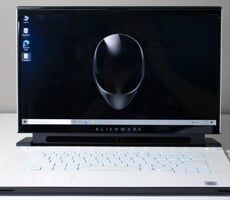
Alienware m15 R3 Review: A Quieter, Powerful Gaming Laptop
|
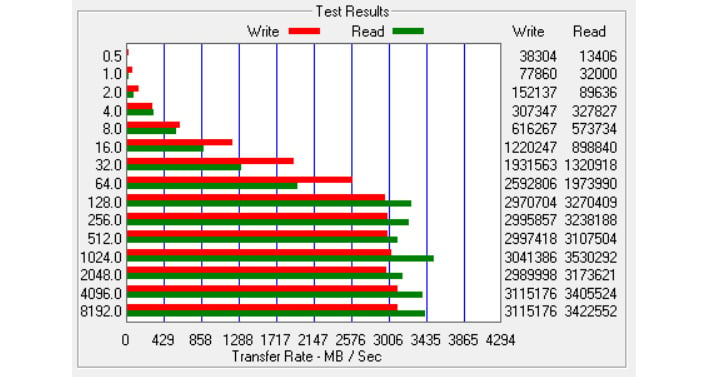
Normally a trip to the Device Manager would identify the type of storage drives(s) we are working with, except in this instance, it only said "Intel Raid 0 Volume," which is not very helpful. After performing some quick and easy surgery, however, we discovered a pair of SK Hynix SSDs (part number HFS512GD9TNI-L2A0A, model number PC611M280S). Each is 512GB in capacity, configured in RAID 0 for 1TB of storage, both with the cooling benefits of a heatsink applied.
These are PCI Express 3.0 drives. SK Hynix's website does not list this exact model (not that we could find, anyway), so it might be exclusive to Dell and/or other OEMs. In any event, our RAID 0 config peaked at nearly 3.5GB/s for sequential read and just over 3.1GB/s for sequential writes in ATTO. In the mobile world, only Intel's Tiger Lake platform supports PCIe 4.0, and on the desktop, it is limited to AMD's latest Ryzen processors and chipsets. Be that as it may, at these speeds, storage is not close to being a bottleneck.
|
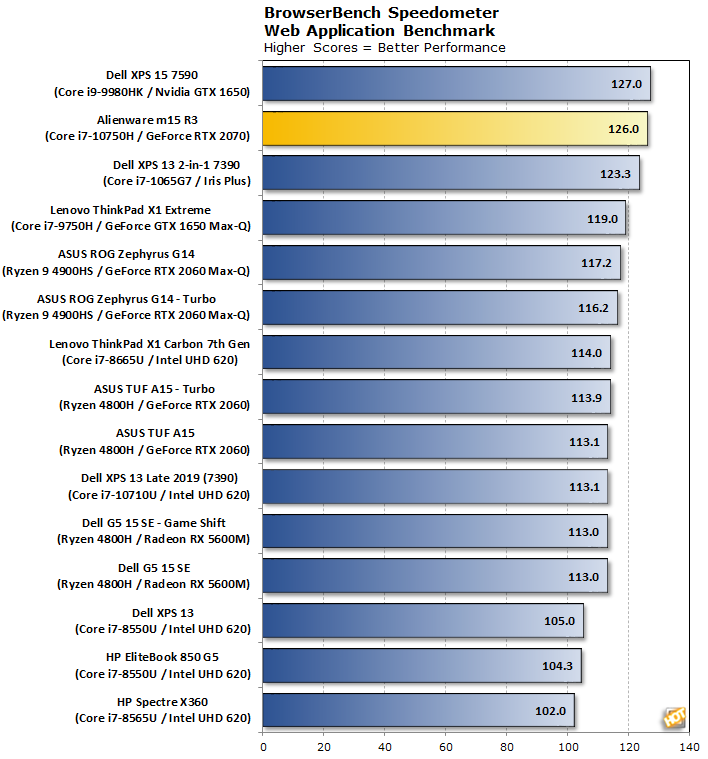
Moving on from isolating the storage subsystem, the Alienware m15 R3 flexed out of the gate with a top-tier finish in the Speedometer benchmark, coming in second only to Dell's XPS 15 7590. Dell actually takes the top three spots overall, and is the only OEM to score above 120 in this benchmark. There are a few that trail relatively close behind, but as far as bragging rights go, Alienware notches another top finish for Dell.
|
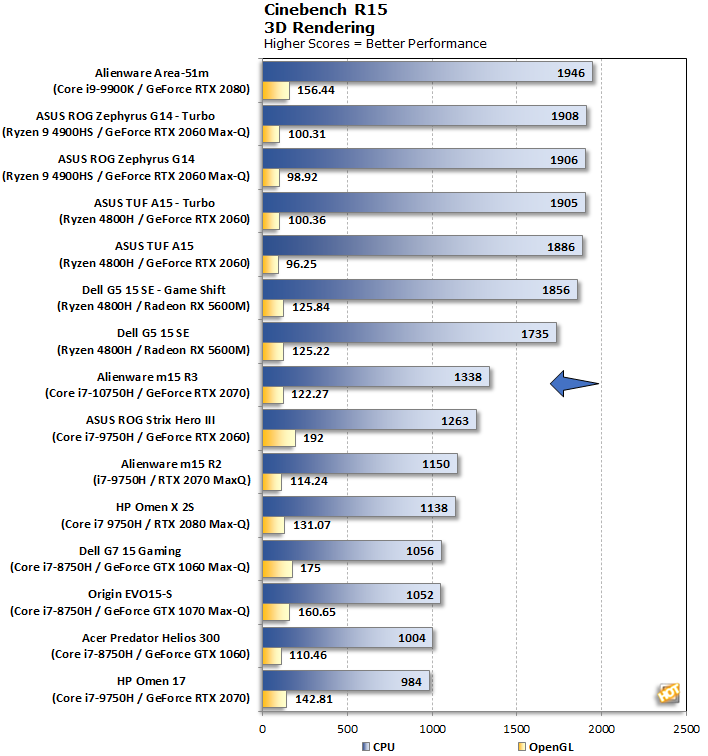
In the older Cinebench R15 test, the Alienware m15 R3 falls to the middle of the pack, though its performance is what we would expect. The Core i7-10750H inside this machine is a 6-core/12-thread processor, whereas every system that posted a higher CPU score wields an 8-core/16-thread chip, be it a Core i9-9900K, Ryzen 9 4900HS, or Ryzen 7 4800H. Cinebench scales fairly well with additional cores and threads.
The OpenGL portion of this test is not as consistent in our experience. Here we recorded 122.27 for the Alienware m15 R3 with its full power GeForce RTX 2070, which is notably higher than 100.36 score posted by the ASUS TUF Gaming A15 and its GeForce RTX 2060, but quite a bit lower than the 192 posted by the ASUS ROG Strix Hero III, also with a GeForce RTX 2060. We also saw our own results bounce around quite a bit from run to run. That's par for the course for this relatively light-duty graphics test, though.
The latest version of Maxon's rendering benchmark, Cinebench R20, takes longer to complete, so this is a better test of a notebook's cooling system. This release also drops the OpenGL test, making Cinebench a pure CPU benchmark this time. We tested both single-threaded and multi-threaded performance here.
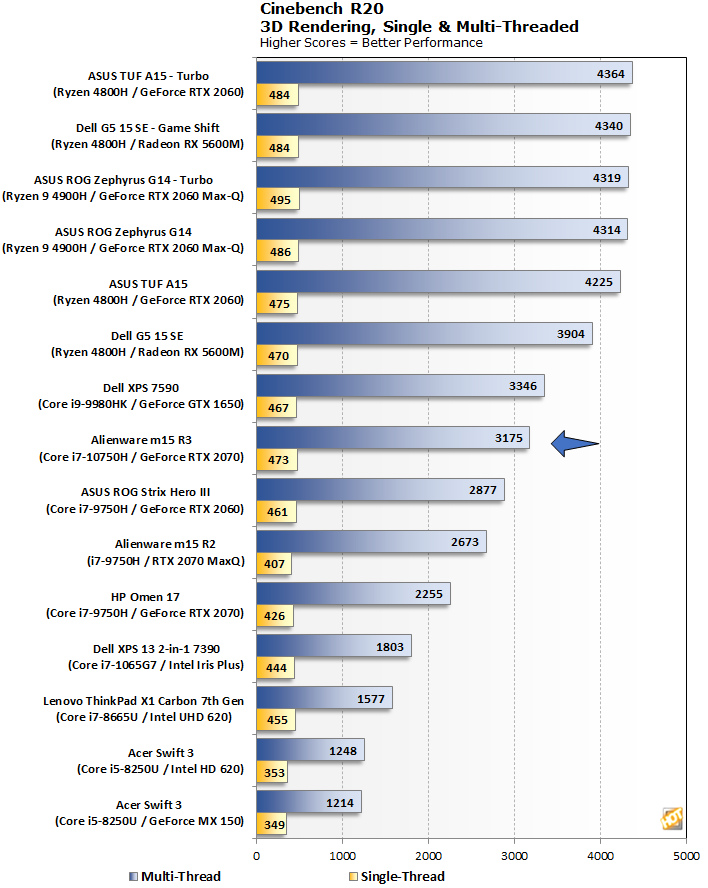
Once again, the Alienware m15 R3 only trailed laptops with CPUs that have more cores and threads to throw at Cinebench's workload. Among the rest of the group, which have fewer than 8 cores, it sat at the top, with a multi-threaded score of 3,175, which is notably higher than the ASUS ROG Strix Hero III and its Core i7-9750H (2,877) and last year's Alienware m15 R2 with the same CPU (2,673).
If sorting by single-threaded scores, this year's model places sixth, 22 points behind the top score (495, posted by the ASUS Zephyrus G14 in Turbo mode, with a Ryzen 9 4900H).
|
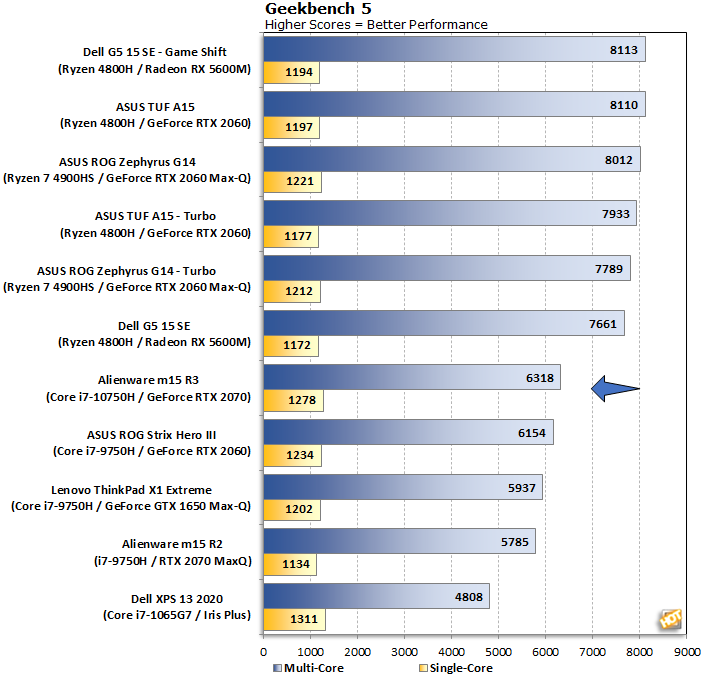
Different benchmark, same story. Well, mostly the same. Once again, the Alienware m15 R3 settles into the middle of the pack, outscored only by laptops that flex more cores and threads, and coming in ahead of laptops built around the Core i7-9750H. The difference this time, however, is the first place finish for the single-core test. The Alienware laptop scored 1,278, enough to put it in pole position. Good stuff.
|
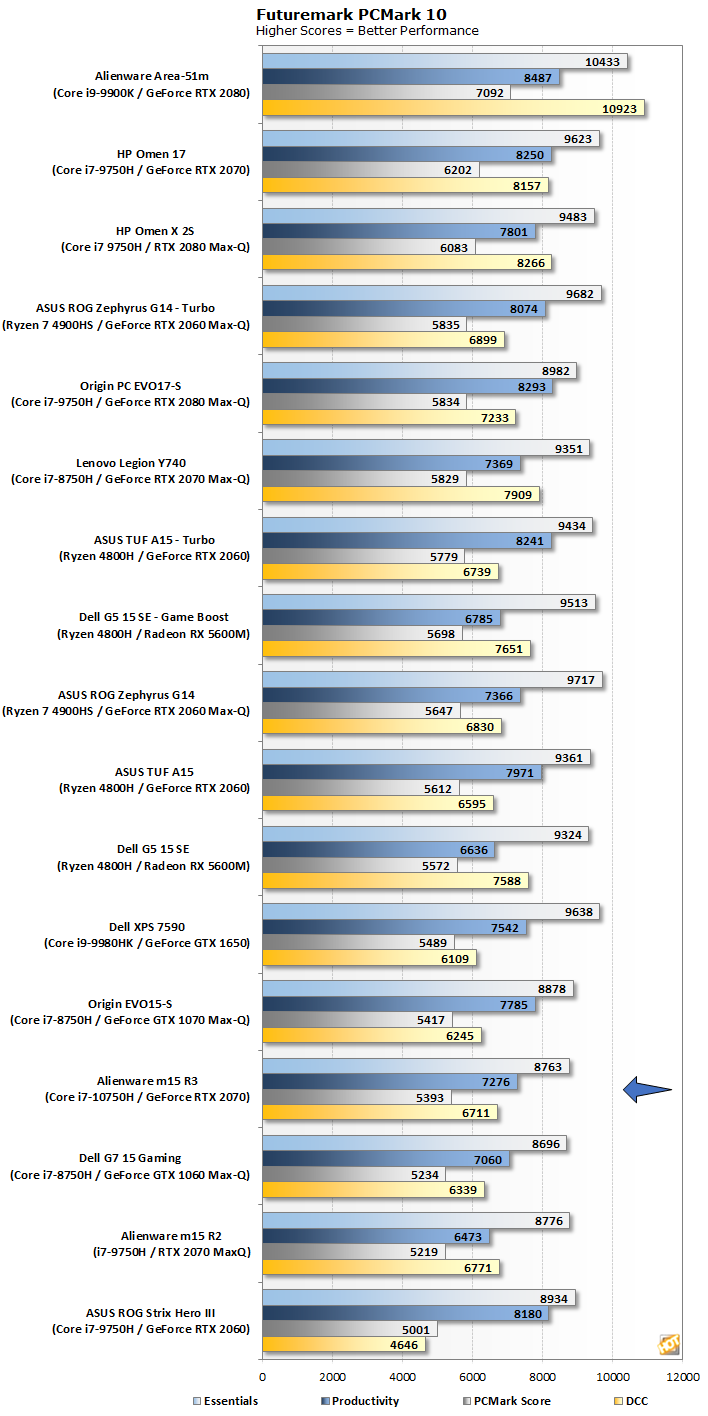
The results in PCMark 10 are a bit of a mixed bag. Overall, the Alienware m15 R3 settles into the lower quadrant, coming in ahead of Dell's G7 15 Gaming and below its XPS 7590. It is a little surprising that it did not finish a bit higher (and we ran this benchmark a bunch of times, with fairly consistent results), though to be fair, it is fairly close across the board in most of the categories. The only system that offers any real separation from the pack is the Alienware Area-51m.
Our general takeaway is that this laptop more than suited for productivity chores, even though that is not its bread and butter. Gaming is, however, so let's shift our focus to graphics and in-game benchmarks, as well as take a look at battery life...