ASUS ROG Flow Z13 Review: AMD Strix Halo Is A Potent Beast

The ASUS Software Experience
ASUS pre-loads quite a bit of software on its systems and the ROG Flow Z13 is no exception. This situation has improved somewhat in recent years, but it was fairly extensive on the ROG Flow Z13. We were particularly unenthused to see McAfee Antivirus pre-installed on the system, for example. It's trivial to uninstall the bloat, but you're going to have to have at least three ASUS utilities installed—along with about a dozen background services that they require—to make the most of this system.
The first, MyAsus, will be instantly familiar to anyone who has used an ASUS computer in the last decade. This app is useful and robust; it automatically monitors the health of the machine and checks for system updates. It's important for getting warranty service, and if you buy into the ASUS ecosystem, you can use it to monitor your other devices' status, as well.
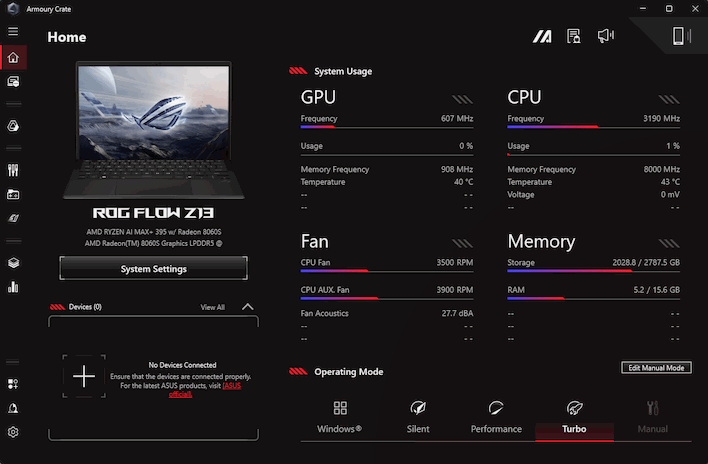
However, as this is a ROG device, you also have ASUS' Armoury Crate application. The ROG Flow Z13 has a wide range of power limits, and it's important to manage them, which can be done in Armoury Crate. You can customize other system settings here, too, like adjusting the amount of system RAM dedicated for use as video RAM—all the way up to 24GB (3/4 of the total memory) if you so desire. Armoury Crate is also where you'll adjust the system's built-in RGB LED lighting, visible through a window on the back and on the keyboard folio.

ScreenXpert pops up in the vertical bar style on the right; press the bottom button to see the popout view.
The third critical app that's preinstalled is ScreenXpert. On the ROG Ally gaming handhelds, there's a very useful system overlay that can be invoked with a button press that allows you to manage system, controls, and graphics settings very quickly. This overlay is part of the Armoury Crate application on those devices, but not so on the ROG Flow Z13. Similarly invoked with a physical button on the side of the tablet, ScreenXpert seems to have been originally intended as a tool for power users that want to be able to instantly launch groups of applications arranged a certain way on screen. The system control pop-up part of it seems a little raw and it's lacking a lot of the functions of the Armoury Crate overlay on the ROG Ally devices, like the ability to force a framerate limit, for example.
Furthermore, ScreenXpert actually caused us some problems in games; Guardians of the Galaxy is unplayable while it is running as the game continually minimizes itself, and Doom Eternal had some strange stuttering problems that went away when we closed ScreenXpert via task manager. This application still needs some work and we'd prefer if ASUS would provide a way to re-assign its button.
Anyway, enough about ASUS' software. Let's get to the benchmarks.
ATTO Disk Benchmark
As is tradition, we'll start off the barrage of benchmarks with ATTO. The ATTO disk benchmark is a fairly quick and simple test which measures read/write bandwidth and IOPS across a range of different data sizes. While we don't typically compare these results across multiple machines, it's useful to gauge whether a particular notebook's storage subsystem is up to snuff.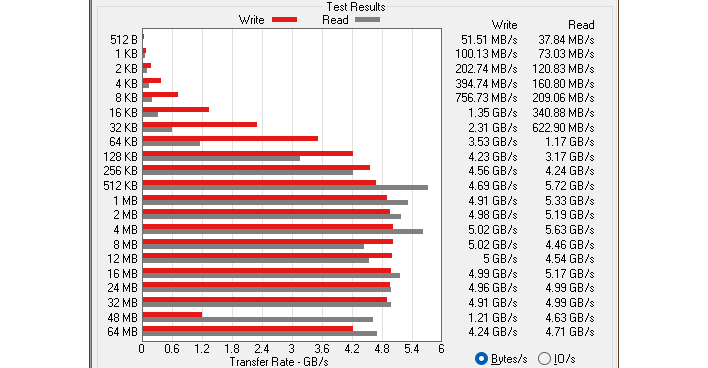
The Kioxia BG6 SSD inside the ROG Flow Z13 isn't a speedster, but it's no slouch, either. That odd dip in writes at 48MB isn't a fluke, exactly; we saw occasional dips like that at random transfer sizes across repeated test runs. The SSD didn't appear to be overheating (reaching a maximum temperature of 58°C in our testing, at least according to HWiNFO), so we're going to chalk that one up to Windows 11 weirdness.
Speedometer 3 Browser Benchmark
We use BrowserBench.org's Speedometer test to take a holistic look at web application performance. This test automatically loads and runs a variety of sample web apps using the most popular web development frameworks around, including React, Angular, Ember.js, and more. This test is a better example of how systems cope with real web applications in comparison with a more compute-focused test like JetStream. All tests were performed using the latest version of Chrome.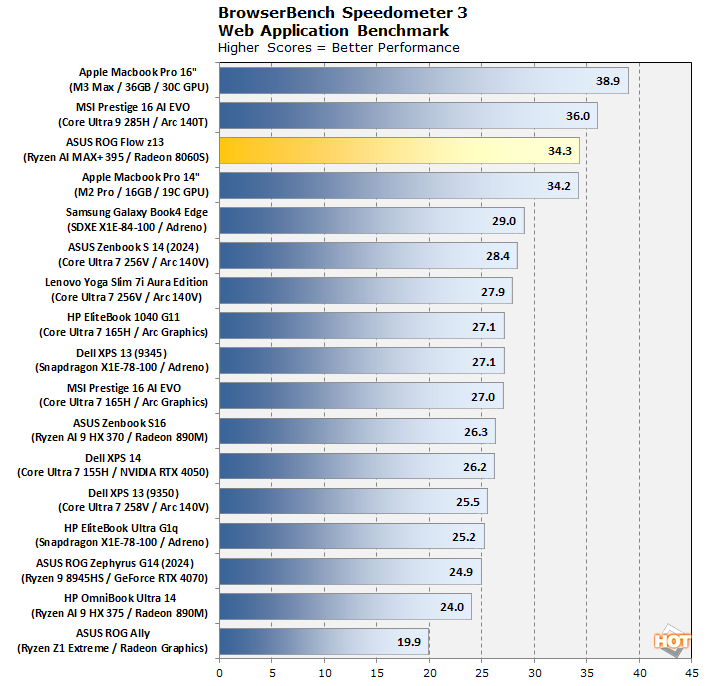
A darn good first result for the ROG Flow Z13 and its Strix Halo SoC. While it's not topping the chart, performance is very high in Speedometer 3.0 thanks to the desktop-class Zen 5 CPUs and the massive memory bandwidth. How does this big chip fare when you unplug the power, though?
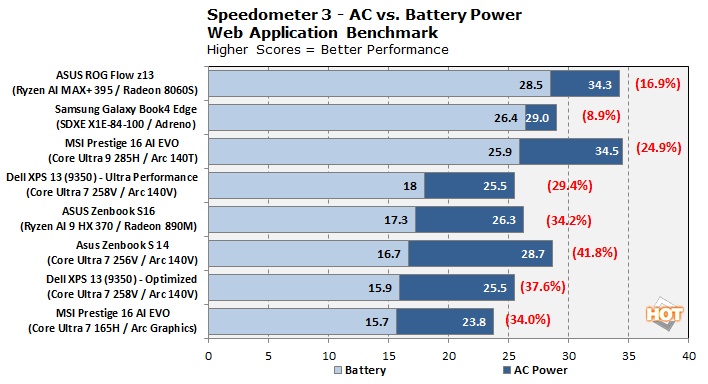
Not too bad, actually. While it does fall off considerably, it remains the fastest result in our selection of systems here. The performance fall-off is less than any of the other x86 systems present, too.
Cinebench 2024 Rendering Benchmark
Next up is the latest-generation 3D rendering benchmark from Maxon, based on the Cinema 4D rendering engine. It's a purely CPU-based test that doesn't make use of the graphics processor at all, and it scales very well with additional CPU cores. We ran both single- and multi-threaded tests on all of the machines in the charts.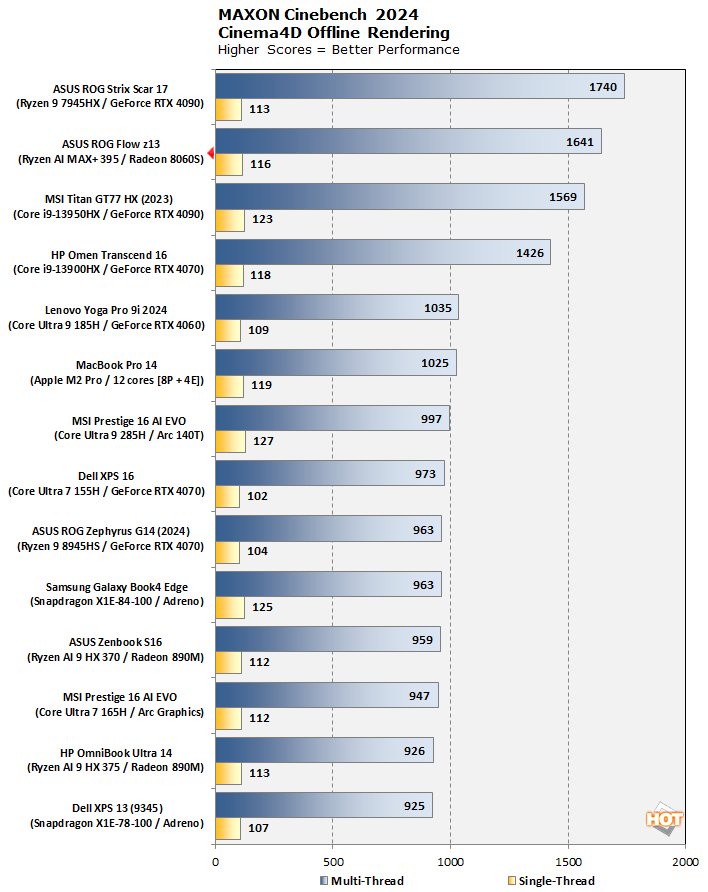
Overall, a very good (and sharply power-limited) result from the Ryzen AI MAX+ 395. It doesn't quite outpace the desktop-class Ryzen 9 7945HX, but that machine has discrete graphics and so isn't dedicating any of its CPU's power limit to enabling a thirsty integrated GPU. There's a clear divide between the desktop-class CPUs and the mobile CPUs in this chart, a trend that will continue.
Geekbench 6 System Benchmarks
Geekbench is a cross-platform benchmark that simulates real-world workloads in a wide variety of tasks, including encryption, image processing, physical simulation, machine learning, and many more. We tested the systems featured here with the latest Geekbench 6 version to get an idea of their overall system performance.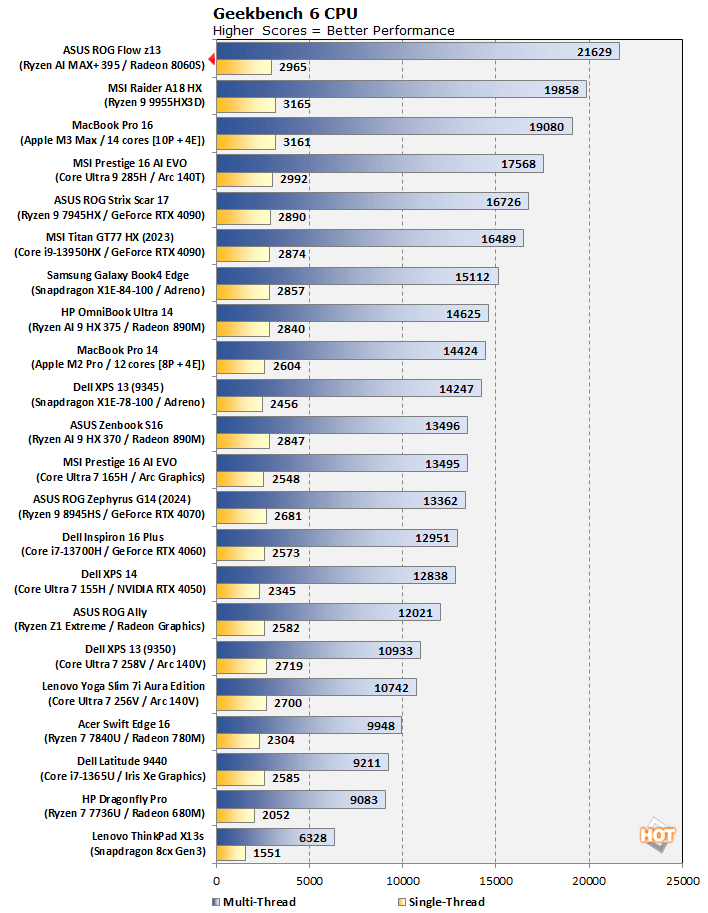
This benchmark chart is exceptionally long, and that's because we've combined multiple data sources to give the clearest picture of the competitive landscape. Only, well, in Geekbench 6, there's really not much competition. The Ryzen AI 9 MAX+ 395 never was able to overtake Intel's latest in the single-threaded test, but it gets within spitting distance, and the multi-threaded result is great. Geekbench 6 loves memory bandwidth, so the 256-bit bus along with Zen 5 is helping tremendously here.
Geekbench AI Machine Learning Benchmarks
The Geekbench AI benchmark provides a straightforward look at how well a device handles a variety of AI-assisted tasks. This quick and easy test gives you a numerical snapshot of the CPU, GPU, and NPU’s ability to power through real-world machine learning workloads, factoring in both speed and accuracy. The higher the score, the better the device’s AI chops, whether it’s image recognition, object detection, or natural language processing. Results are presented in three levels of numerical precision: single precision or FP32, half precision or FP16, and quantized or INT8, the latter of which is a very common precision for on-device edge AI workloads. All results that the benchmark provides are geomean scores from multiple runs of each test workload.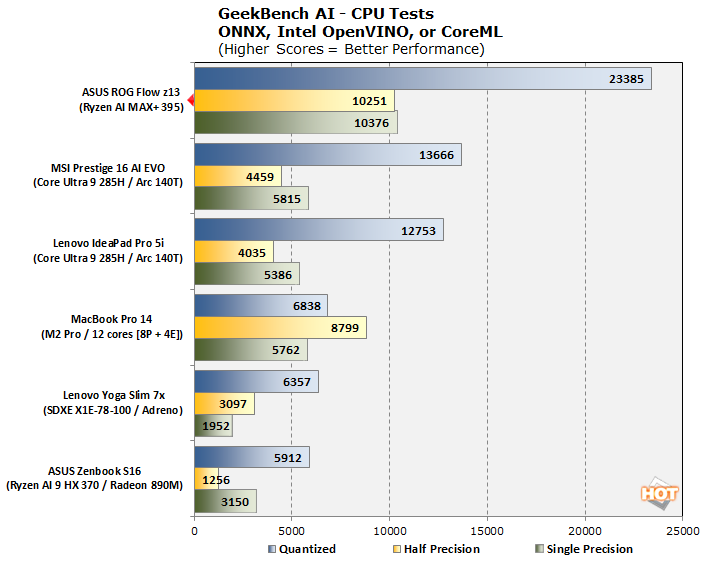
Running off the CPU, the double-wide memory bus in combination with the presence of sixteen full-fat CPU cores with strong AVX-512 performance means that the ROG Flow Z13 is essentially untouchable in CPU AI. This is the easiest way to get AI running locally on a system, so solid performance here is more relevant than you might think.
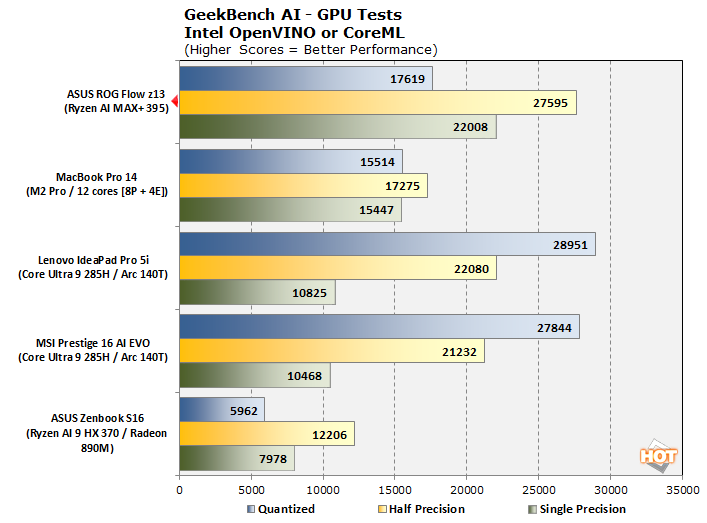
In GPU testing, results are more mixed. While the Radeon 8060S performs very well in FP32 and especially FP16 workloads, it actually fares rather poorly in the "quantized" INT8 precision. AMD describes this as a strength, since its FP16 performance is roughly on par with the INT8 performance of its competitors, meaning that you can use a higher-precision model that will give more accurate results. If all you have is an INT8 model, though, better run it on the CPU.
You might be wondering about the lack of NPU results here. Well, Geekbench AI doesn't yet support the AMD XDNA NPUs. They're fully functional—scroll down to the Procyon test to see that—but software support isn't quite where it should be for AMD's AI processors yet.
UL PCMark 10 Productivity Benchmarks
The standard PCMark 10 benchmark uses a mix of real-world applications like LibreOffice and Zoom as well as simulated workloads to establish how well a given system performs productivity and content creation tasks, including (but not limited to) image and video editing, web browsing, teleconferencing, document creation, and so on. We ran it on all these machines to see which one is the best for creative work.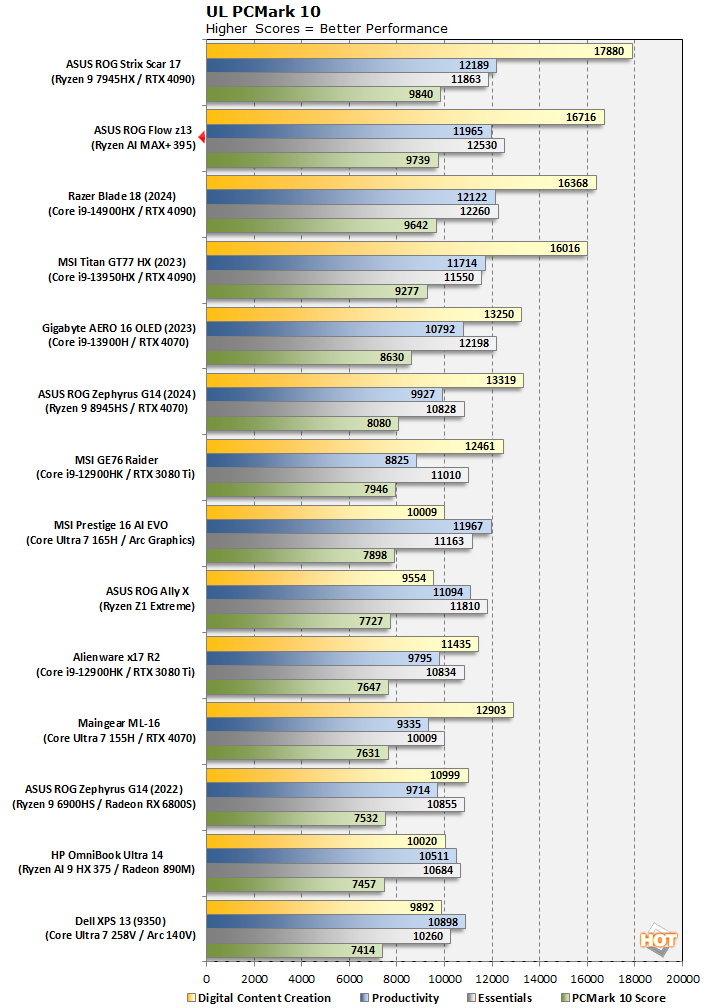
This PCMark 10 test pits the ROG Flow Z13 against everything from tiny Lunar Lake laptops to enormous desktop-replacement gaming machines. Despite its own petite dimensions, the Flow scores a second-place finish—and it's very close behind the first-place ROG Strix Scar machine, even taking home a win in the "Essentials" category that measures browsing and Office performance. That's a nice bit of foreshadowing for the next test...
UL PCMark Applications Office Benchmarks
We've started using the PCMark 10 Applications benchmark a bit more because it measures performance in Office and Edge using native instruction set-compatible versions of the apps for optimal performance across both x86 and Arm architectures. The following results should paint a picture of performance with the best foot forward from all systems tested.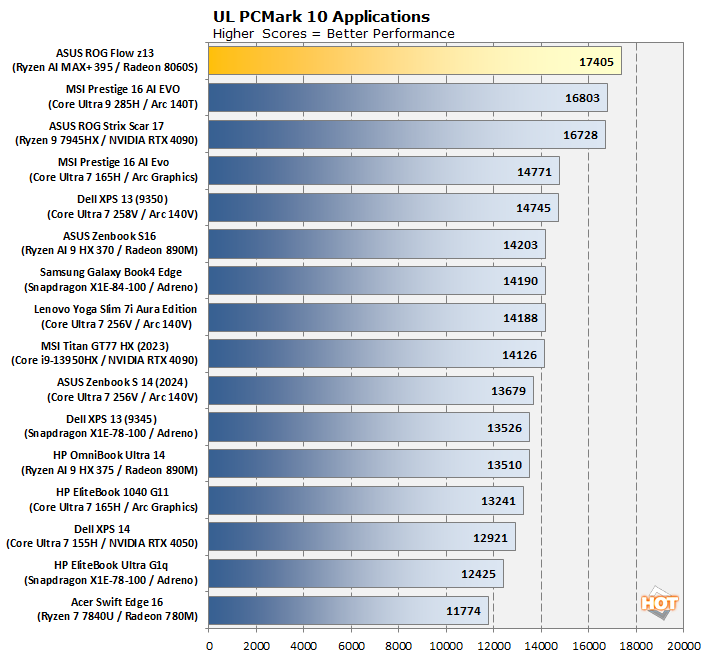
The PCMark 10 Applications test (which uses the actual Microsoft Office suite) represents another solid win for the ROG Flow Z13. Despite this being a "Republic of Gamers" device, the large memory and many-core CPU make it nearly optimal for getting work done.
UL Procyon AI Computer Vision Benchmarks
The idea of "edge AI", or running AI workloads natively on your local devices instead of in the cloud, is only just emerging on mainstream PCs. As such, benchmarks for these workloads aren't exactly prolific. Fortunately, UL has already built a few into its Procyon benchmark suite. The following is a look at how some of our machines do in this benchmark suite's AI Computer Vision benchmark. This test exercises the subject's ability to handle machine vision workloads, which you'll find in everyday tasks like webcam background blur, subject tracking, and eye gaze correction, for a few examples.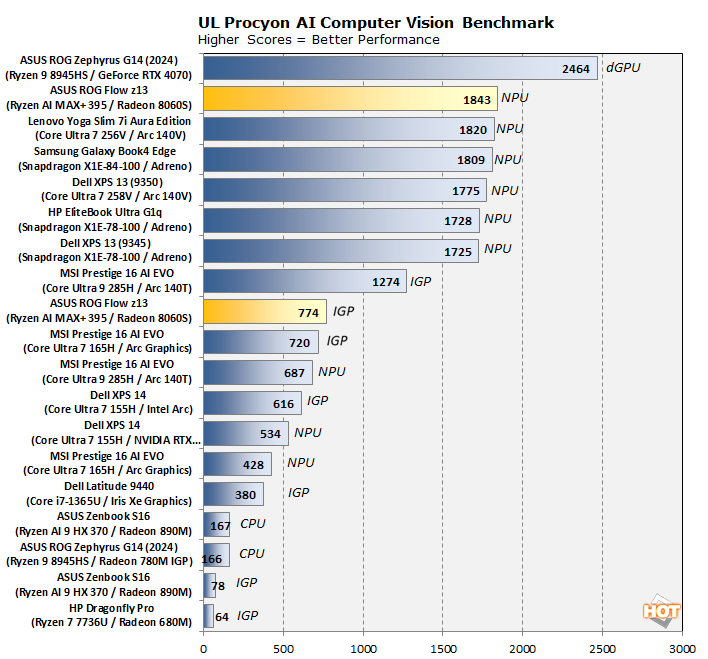
Interestingly, in Procyon, we see a bit of an inversion in the results. The best result we got came from the chip's integrated NPU, while the CPU results weren't even worth publishing and didn't seem repesentative, suggesting a software or configuration error. This benchmark is the best score we've seen yet from an NPU. The IGP score is respectable, too, although quite a bit slower than the Arrow Lake-H machine's result, which runs contrary to the Geekbench AI data. It really goes to show how immature Edge AI is in terms of software and frameworks -- getting all that software right is arguably way more important than the actual hardware you're using.
Clamchowder Memory Latency Microbenchmark
System memory latency can have an outsized effect on the performance of certain applications, particularly in the realm of gaming. Console game emulators and high-speed competitive titles can both have gigantic swings in performance depending on the memory timings of the system in question. We wanted to check out the memory latency on the Ryzen AI MAX+ 395 both because some of the results were a little different from our expectations, and also because we expected the high-speed LPDDR5X-8000 memory to require some pretty loose memory timings when deployed on a wide 256-bit bus this way. As it happens, we were correct. Check it out:
As expected, the Ryzen AI MAX+ 395 has excellent latency up to the 32MB of its cache, but things fall off very quickly after that. Real memory latency, even when accessed using Large Pages, is in the realm of 140 nanoseconds, which is quite poor compared to typical DDR5 systems at 70-80 nanoseconds. We would be interested to see if ASUS could tighten this up at all with firmware updates, becuae it could significantly improve performance.
So, how is gaming on the ROG Flow Z13? Let's find out...