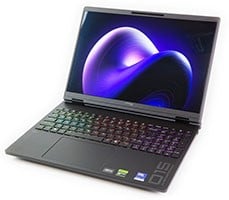
We Tested The NVIDIA RTX Spark N1X In A Notebook. - Image:NVIDIA
The Surface Laptop Ultra powered by the NVIDIA RTX Spark N1X felt quick and responsive throughout testing. From juggling dozens of browser tabs and various applications to editing photos and working with AI-assisted tools, the system never felt sluggish or constrained. Beyond our initial impressions, we also ran a slew of benchmarks though. Let's get started.
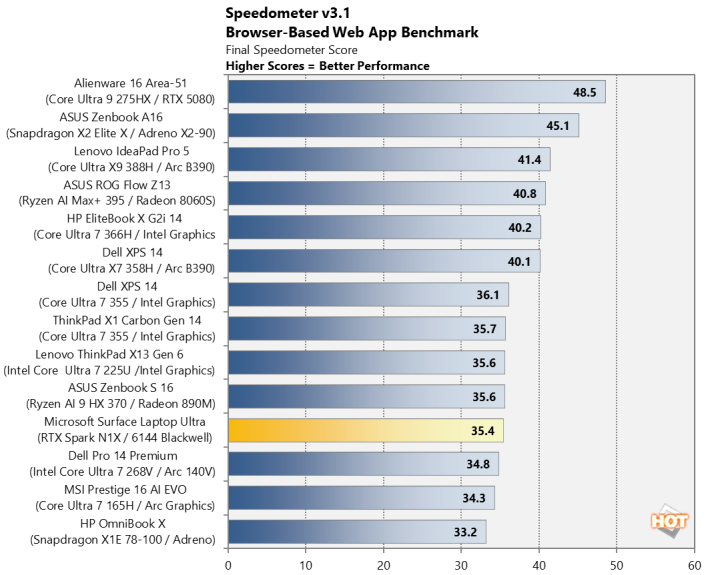
We use BrowserBench.org's Speedometer test to take a holistic look at web application performance. This test automatically loads and runs a variety of sample web apps using the most popular web development frameworks around, including React, Angular, Ember.js, and even simple JavaScript. This test is an example of how systems cope with real-world, modern web apps. All tests were performed using the latest version of Chrome.
The standard Arm CPU cores used in the NVIDIA RTX Spark N1X don't clock quite as high and aren't as performant per thread as Intel, AMD, or Qualcomm's latest and the Surface Laptop Ultra lands in the bottom third here, ahead of Snapdragon X and Lunar Lake.
MAXON Cinebench 2026 3D Rendering With The NVIDIA RTX Spark N1X
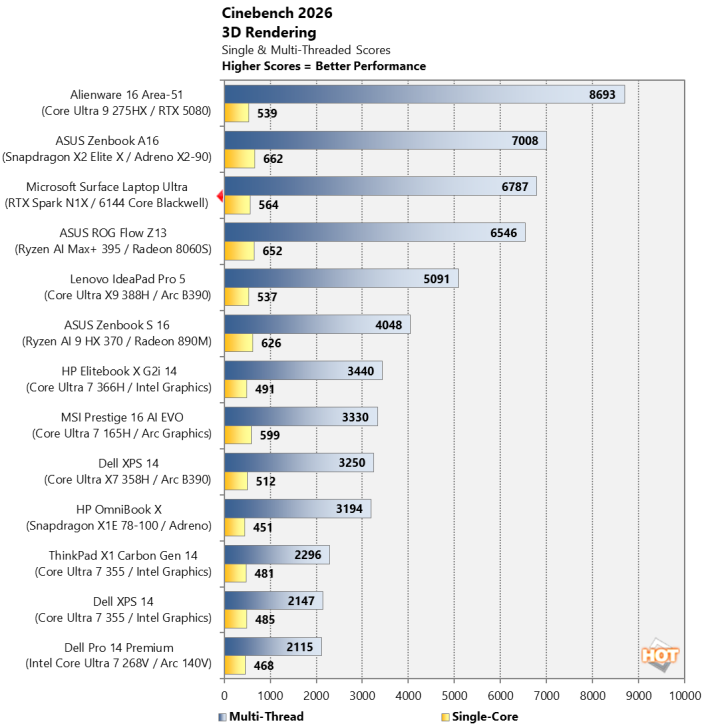
Next up is the latest-generation 3D rendering benchmark from Maxon, based on the Cinema 4D rendering engine. It's a purely CPU-based test that doesn't make use of the graphics processor or NPU, and it scales very well with additional CPU cores. We ran both single- and multi-threaded tests on all of the machines in the charts, and also tested these laptops on battery power as well.
Cinebench 26 sort of encompasses what NVIDIA RTX Spark N1X CPU performance is all about. Single-Thread performance trails current-generation competitive processors, but with 20 cores in total (split evenly between performance and efficiency cores), the NVIDIA RTX Spark N1X offers relatively strong multi-threaded performance that trails only Intel's larger, enthusiast-class mobile CPU and the top-end Snapdragon X2 Elite Extreme.
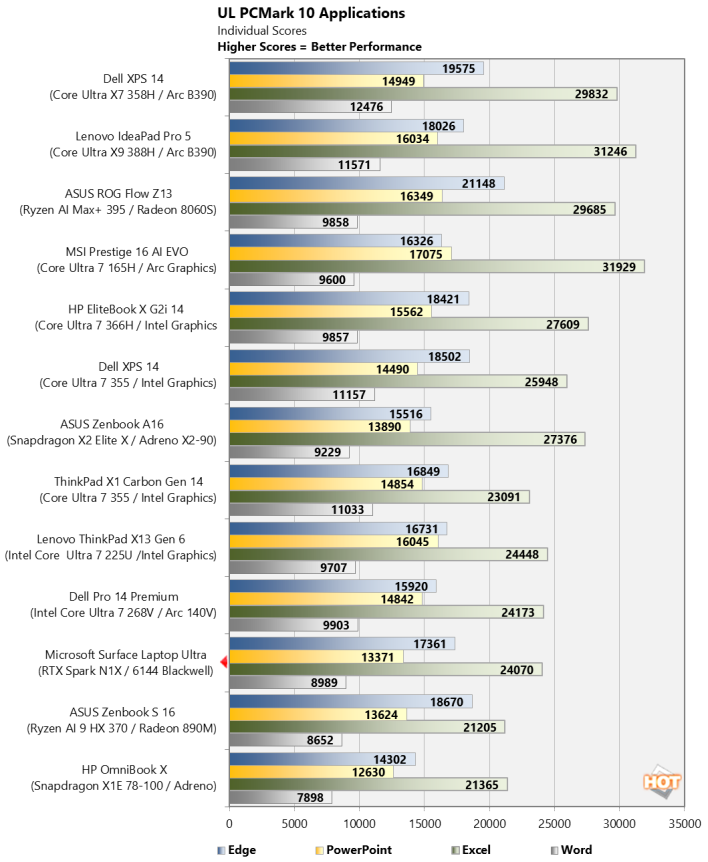
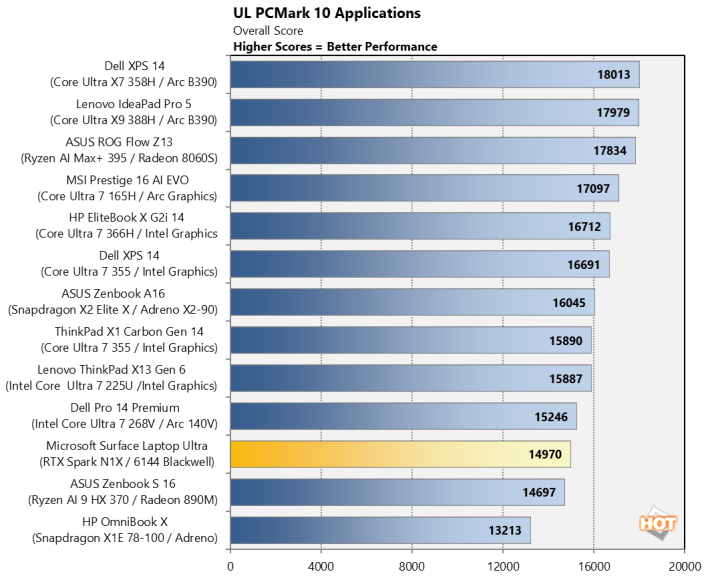
The PCMark 10 Applications benchmark measures performance in the Microsoft Office suite, as well as in the Edge browser, offering native instruction set-compatible versions of the apps for optimal performance across a wide variety of workloads in tools office workers, students and home users utilize every day. The following results should show a view of performance with a best foot forward from all systems tested.
With its relatively meager single-thread CPU performance, the NVIDIA RTX Spark N1X once again lands near the bottom of the stack in the lightly-threaded PCMark Applications benchmark. Of course, all of these platforms are more than powerful enough to offer an excellent experience with Microsoft Office applications, but when performance is quantified via a benchmark, this is how today's mobile PC platforms stack up.
Geekbench CPU Benchmark Results
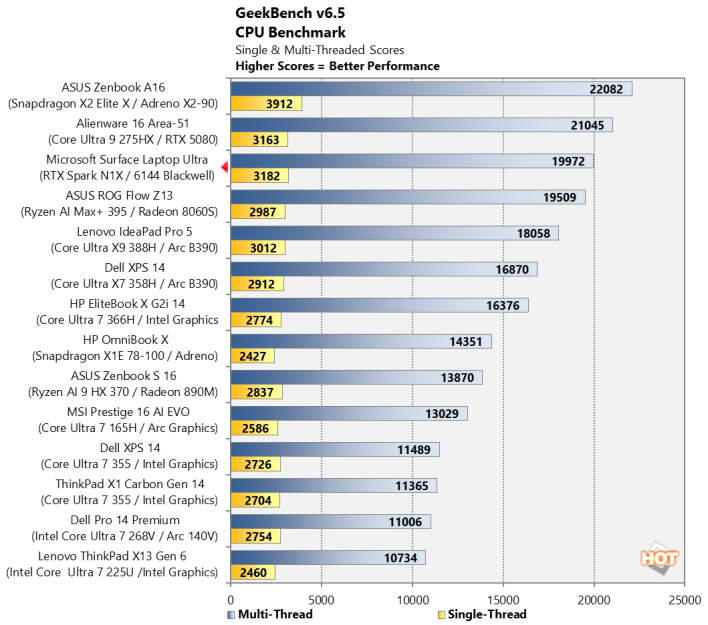
The Geekbench CPU tests stress only the processor cores in a system (not the graphics card/GPU), with both single and multi-threaded workloads. The tests are comprised of encryption processing, image compression, HTML5 parsing, physics calculations and other general purpose compute workloads.
With Geekbench's quick and bursty workloads, many of which will fit entirely in CPU cache, the NVIDIA RTX Spark N1X performs well. Here, the Spark's single-thread performance is much more competitive and its multi-thread performance is among the best, at least with the 20-core version inside the Microsoft Surface Ultra.
UL Procyon AI Text Generation Benchmarks
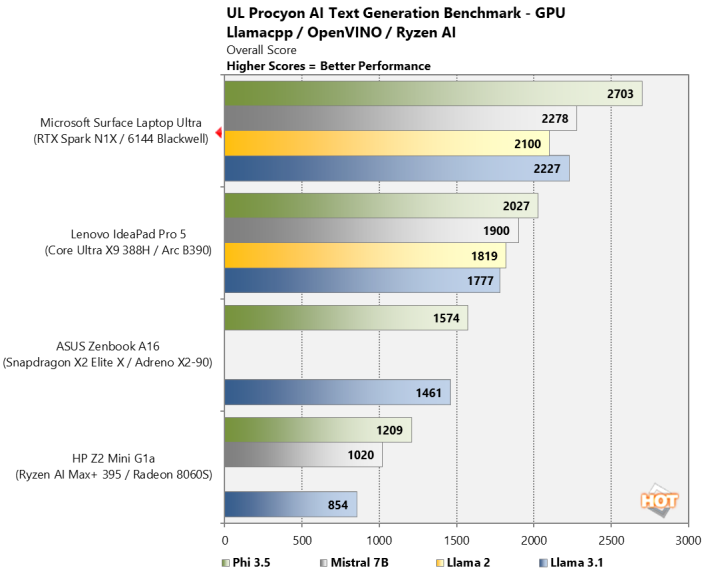
The Procyon AI Text Generation Benchmark is a tool developed by UL Solutions to evaluate the performance of large language models (LLMs) on Windows PCs. It features real-world use cases and uses seven prompts with both Retrieval-Augmented Generation (RAG) and non-RAG queries. It tests various AI models like Phi-3.5-mini, Mistral-7B, Llama-3.1-8B, and Llama-2-13B.
NVIDIA RTX Spark N1X AI Text Generation Results - Image:HotHardware
One of NVIDIA's core competencies is AI, and the RTX Spark N1X leads across the board with the LLM text generation workloads in UL's Procyon benchmark. None of the other mobile architectures with unified memory come close, and AMD and Qualcomm can't even run all of the models, with the systems we had on hand for testing at least.
UL Procyon AI Computer Vision 2.0 Benchmark
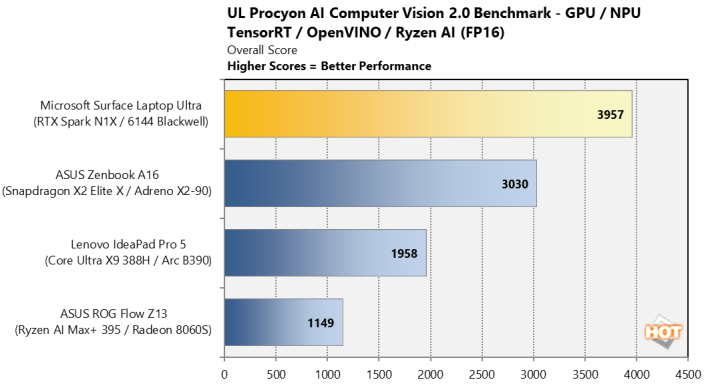
The idea of "edge AI", or running AI workloads natively on your local devices, instead of in the cloud, is only just emerging on mainstream PCs. As such, benchmarks for these workloads aren't exactly prolific. Fortunately, UL has already built a few into its Procyon benchmark suite. The following is a look at how a few machines do in this benchmark suite's AI Computer Vision benchmark, which exercises the test subject's ability to handle machine vision workloads, which you'll find in everyday tasks like webcam background blur, subject tracking, eye gaze correction and other effects, for example.
With the latest Computer Vision 2.0 benchmark, the NVIDIA RTX Spark N1X leads once again. The second-place Snapdragon X2 Elite Extreme finishes a full 30% behind the Spark, and Intel and AMD's most powerful mobile chips are left in the dust.
MLPerf Client Agentic And Image-Gen Benchmarks
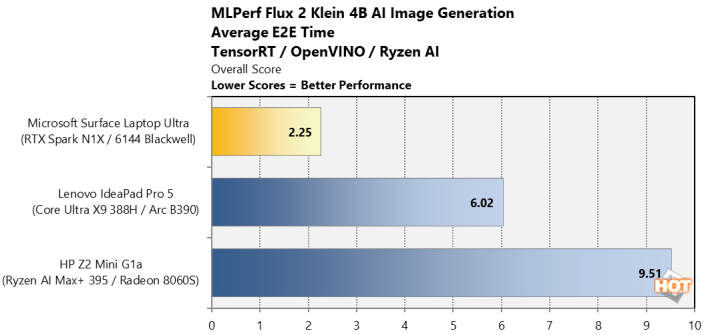
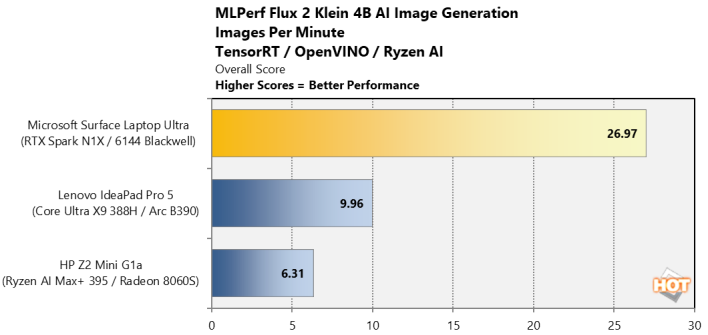
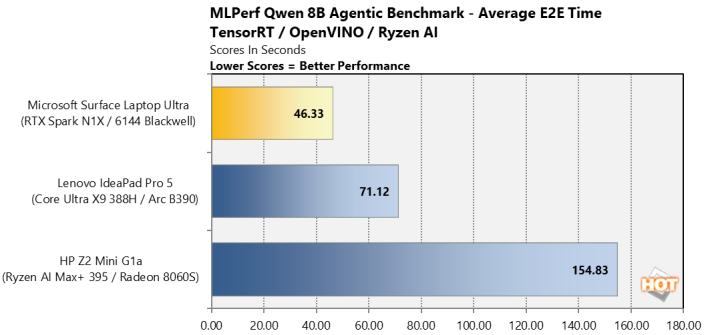
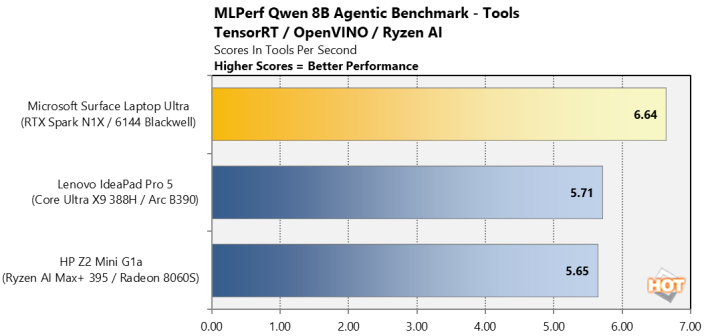
The MLPerf Client benchmark was designed by MLCommons to evaluate machine learning inference tasks on PCs. It focuses on client form factors and aims to measure how well different hardware and software configurations handle different AI workloads with various models targeting LLM, Agentic, and Image Generation use cases. MLCommons also optimizes the models and benchmark configuration for specific hardware, to ensure realistic real-world results, that must also meet strict guidelines for accuracy.
There are two pairs of MLPerf results here: one for image generation (Flux 2 Klein 4B) and another for agentic workflows (Qwen 8B). For each model, there are two results that detail average end-to-end time -- where lower scores are better -- or Images or Tools per second -- where higher scores are better. Across the board, the RTX Spark N1X leads the pack with the highest throughput and lowest latency.
UL 3DMark Graphics Benchmarks With NVIDIA RTX Spark N1X
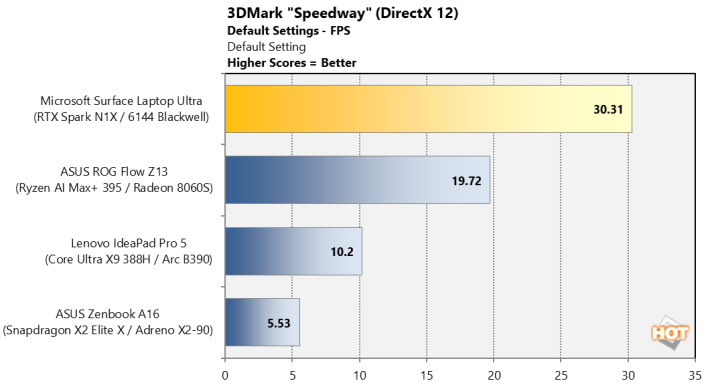
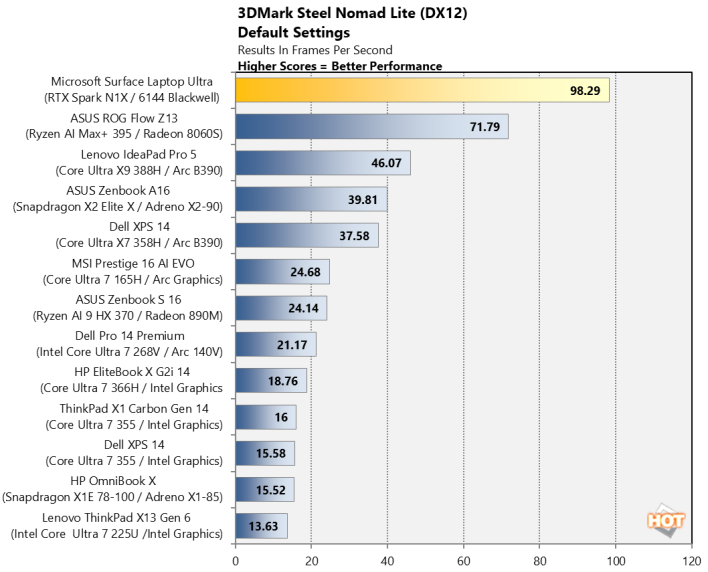
3DMark has a wide variety of graphics and gaming-related tests available. For these next tests, we use the most taxing DirectX 12 Speedway benchmark with ray tracing, which is ideally suited to powerful discrete GPUs, and the more modest Steel Nomad Lite, which will run on many more mobile platforms.
The RTX Spark N1X has a GPU with a similar number of CUDA cores than a discrete, desktop RTX 5070, but it must operate in a much tighter power envelope. The RTX Spark N1X also uses a unified memory architecture with LPDDR5X memory, rather than the higher-bandwidth GDDR7 found on discrete GeForce RTX graphics cards. That said, the RTX Spark N1X's integrated Blackwell GPU is still powerful, especially in comparison to other mobile platforms. In both of the 3DMark tests we ran, the RTX Spark N1X leads by a wide margin.
RTX Spark Game Benchmarks With Cyberpunk & The Talos Principle II
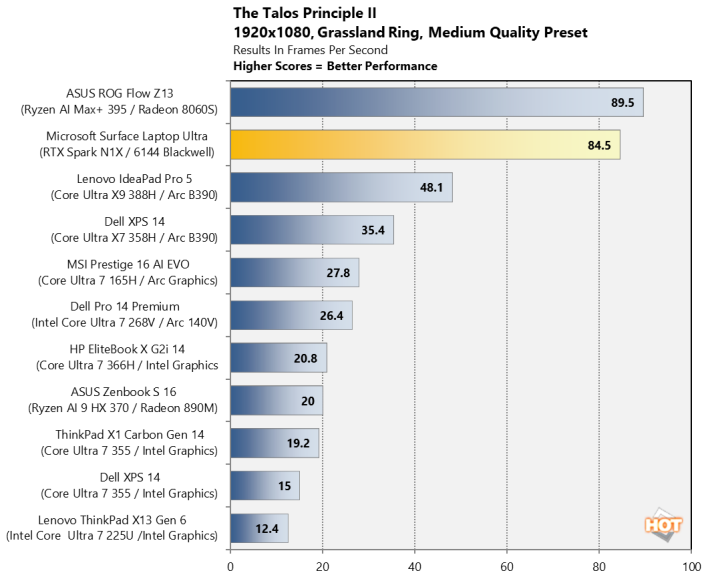
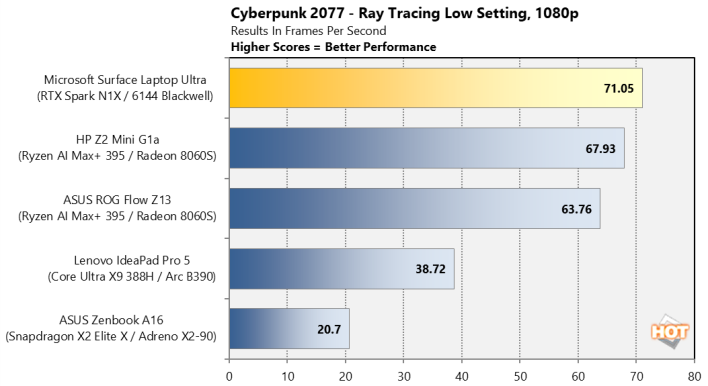
We also ran some fairly taxing gaming workloads on the laptops with Cyberpunk 2077 and The Talos Principle II at a 1080p resolution. With Cyberpunk we used the game's "Ray Tracing - Low" image quality preset, which uses high-quality graphics settings, with some ray tracing. And for The Talos Principle II, we used the game's "Medium" quality preset. Resolution scaling was disabled in both games, to show the native framerate across all platforms and iGPUs.
NVIDIA RTX Spark N1X Talos Principle II Results - Image:HotHardware
In Cyberpunk, the RTX Spark N1X leads once again, but it outpaces the competition by a smaller margin than the synthetic tests above. And in the Talos Principle II, the RTX Spark N1X actually falls behind the Radeon 8060S in AMD's Strix Halo processor. That may seem counterintuitive in light of all of the other GPU tests, but keep in mind, Talos is running under Microsoft's PRISM emulator; it doesn't run natively on Arm architectures.
Marco's interest in computing and technology dates all the way back to his early childhood. Even before being exposed to the Commodore P.E.T. and later the Commodore 64 in the early ‘80s, he was interested in electricity and electronics, and he still has the modded AFX cars and shop-worn soldering irons to prove it. Once he got his hands on his own Commodore 64, however, computing became Marco's passion. Throughout his academic and professional lives, Marco has worked with virtually every major platform from the TRS-80 and Amiga, to today's high end, multi-core servers. Over the years, he has worked in many fields related to technology and computing, including system design, assembly and sales, professional quality assurance testing, and technical writing. In addition to being the Managing Editor here at HotHardware for close to 15 years, Marco is also a freelance writer whose work has been published in a number of PC and technology related print publications and he is a regular fixture on HotHardware’s own Two and a Half Geeks webcast. - Contact: marco(at)hothardware(dot)com