Dell XPS 16 (2026) Review: Thin, Elegant And Surprisingly Fast
ATTO Disk Benchmark Results For The Dell XPS 16 (DA16260)
We'll start off with ATTO, a quick and dirty test that measures read/write bandwidth and IOPS across a range of different data transfer sizes. While we don't typically compare these results across multiple machines, it's useful to gauge whether a particular notebook's storage subsystem is up to snuff.
Storage performance was a weak point of the XPS 14 we reviewed, but you'll find no such complaints here on the 16" machine. Storage performance is very solid, with the BG7 SSD pulling out over 100,000 IOPS in the 4K random read test while delivering a consistent 6.5 GB/second on reads and 5.7 GB/second on writes for test sizes above 256KB. This is great performance for a mainstream PCIe 4.0 SSD, but it will go down as the drive fills up.
XPS 16 (DA16260) Speedometer 3.1 Browser Benchmark
We use BrowserBench.org's Speedometer test to take a holistic look at web application performance. This test automatically loads and runs a variety of sample web apps using the most popular web development frameworks around, including React, Angular, Ember.js, and even simple JavaScript. This test is an example of how systems cope with real-world, modern web apps. All tests were performed using the latest version of Chrome.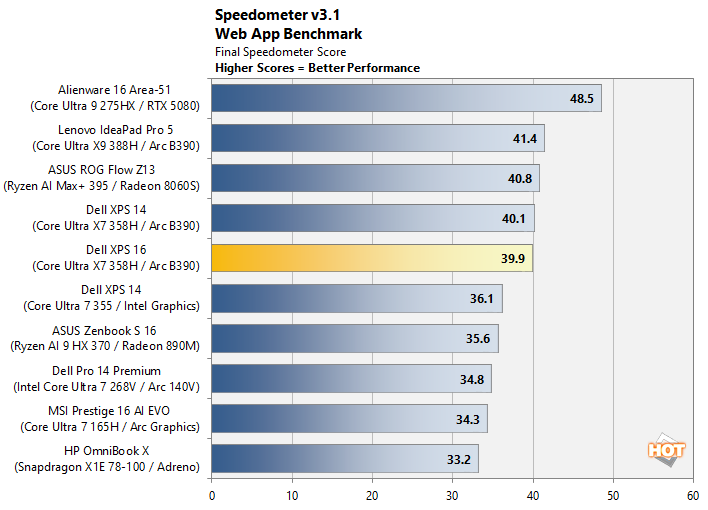
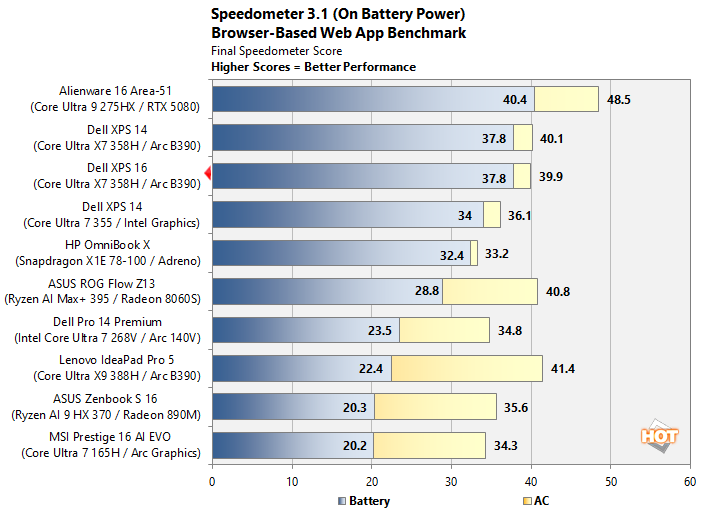
If we flip over to the battery results, not much changes. We actually see our XPS 16 pulling out the exact same result as the XPS 14 using the same Core Ultra X7 358H, and both are basically at the top of the chart behind only a massive desktop-class gaming laptop. Excellent stuff, and a major contributor to why this laptop feels so snappy to use.
MAXON Cinebench 2026 3D Rendering Results With The XPS 16 (DA16260)
Next up is the latest-generation 3D rendering benchmark from Maxon, based on the Cinema 4D rendering engine. It's a purely CPU-based test that doesn't make use of the graphics processor or NPU, and it scales very well with additional CPU cores. We ran both single- and multi-threaded tests on all of the machines in the charts.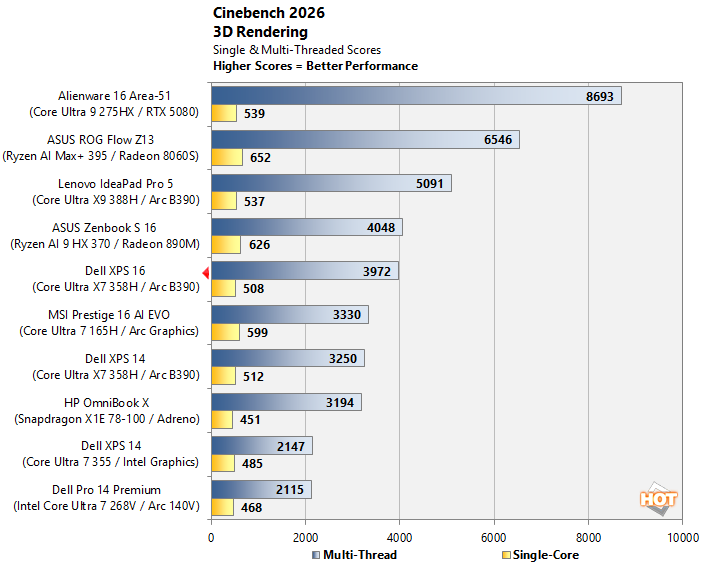
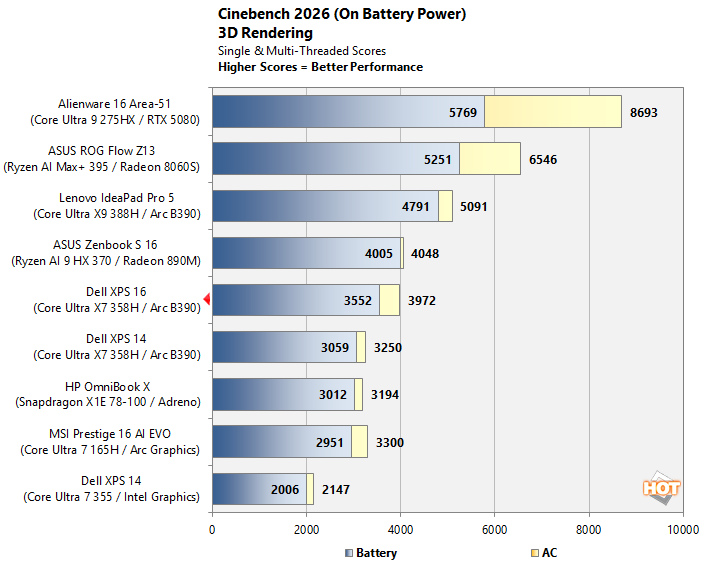
In Cinebench 2026, we do see the XPS 16 drop a few spots in comparison to chips that simply have more CPU cores, although it's still holding strong. The single-threaded scores aren't exceptional because we're using the "single-core" test here which makes use of both threads on a CPU with SMT, and that includes both AMD's Ryzen chips as well as the older Intel parts, but not the newer Intel chips. Dell has equipped this machine with the stock 25W power limit for PL1 and a thirsty 60W for PL2, so we see this machine become seriously power limited over the course of the ten minute test run. Not a bad result for a thin & light, though.
The battery tests show much the same pattern we saw in the battery tests for Browserbench; the rankings don't change much, and the XPS 16 delivers the vast majority of its performance on battery as well as on wall power. It was once true that x86 laptops fell off a cliff as soon as you unplugged them from the wall, but that's really no longer the case, and hasn't been for a few generations now. Don't believe the hate.
Dell XPS 16 (DA16260) UL PCMark 10 Applications Benchmark Results
The PCMark 10 Applications benchmark measures performance in the Microsoft Office suite, as well as in the Edge browser, offering native instruction set-compatible versions of the apps for optimal performance across a wide variety of workloads in tools office workers, students and home users utilize every day. The following results should show a view of performance with a best foot forward from all systems tested.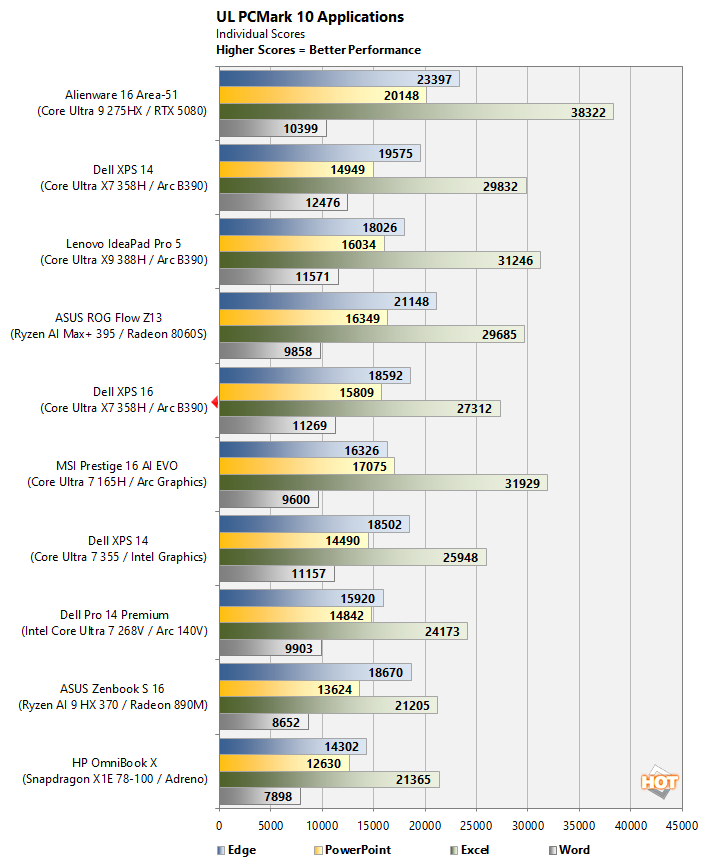
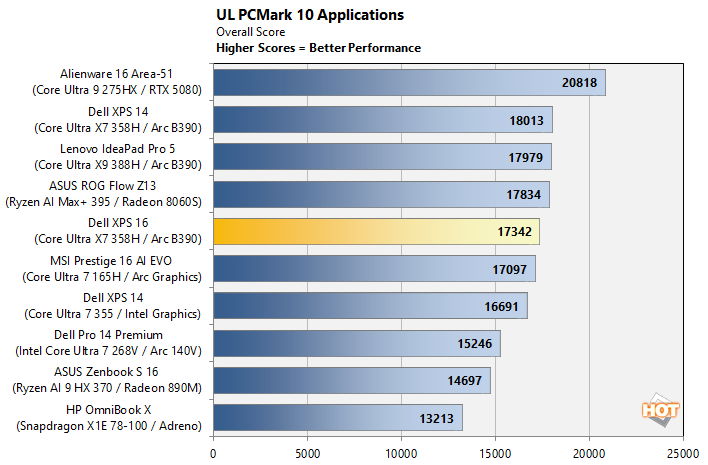
If you don't look at the overall score, that positioning in the full chart above can seem pretty suspect, but the XPS 16 is actually kicking butt in the Word test as well as the Edge benchmarks. As we saw in Browserbench, the Dell machine really cranks through web apps. It lacks the multi-core CPU grunt to blow through the Excel test like some of the machines with more cores do, though. Interestingly, our XPS 16 comes in slightly behind the XPS 14, with lower scores in three of the tests. It's not far behind, though, and this could be down to software changes since we completed the XPS 14 review.
Puget Bench For Creators: Davinci Resolve
Next up, we have some video editing and encoding tests using the Puget Bench for Creators and Davinci Resolve. Puget Systems has been developing benchmarks that leverage real-world applications and workloads since 2020. THese tests are highly regarded by creators using popular Adobe applications and Davinci Resolve. Here, we used the free version of Davinci Resolve (not the Studio edition) that features less hardware acceleration and relies heavily on CPU, GPU and memory performance.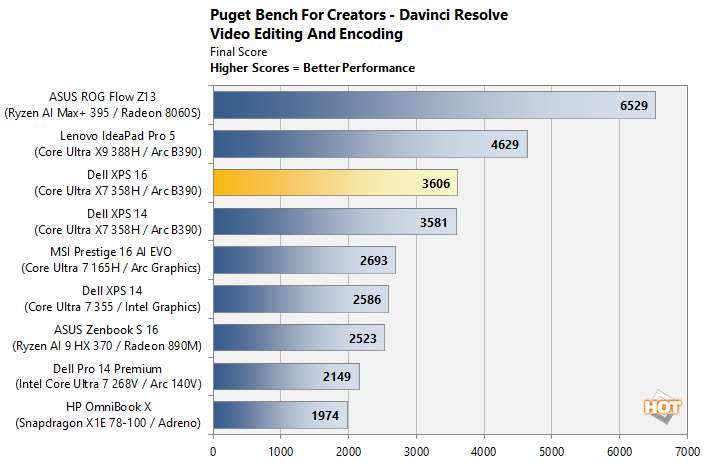
Our XPS 16 actually comes out just barely ahead of the XPS 14 here. It's not clear why the IdeaPad Pro 5 does so much better; the Ultra X9 388H has the same CPU and GPU configuration as the XPS 16's Ultra X7 358H, just with higher clocks. Our best guess is that it has to do with some additional thermal headroom in the thicker IdeaPad machine, as well as the higher power limits usually afforded the X9 chip. In any case, these are solid results showing that you absolutely could do some serious video editing on the XPS 16. If you're doing it frequently, though, you might consider upgrading to a mobile workstation or desktop replacement.
UL Procyon AI Computer Vision Benchmark
The idea of "edge AI", or running AI workloads natively on your local devices instead of in the cloud, is only just emerging on mainstream PCs. As such, benchmarks for these workloads aren't exactly prolific. Fortunately, UL has already built a few into its Procyon benchmark suite. The following is a look at how our test cluster does in this benchmark suite's AI Computer Vision benchmark, which exercises the test subject's ability to handle machine vision workloads. These are the kind of tasks you'll find in everyday AI applications, like webcam background blur, subject tracking, eye gaze correction, object classification, and so on.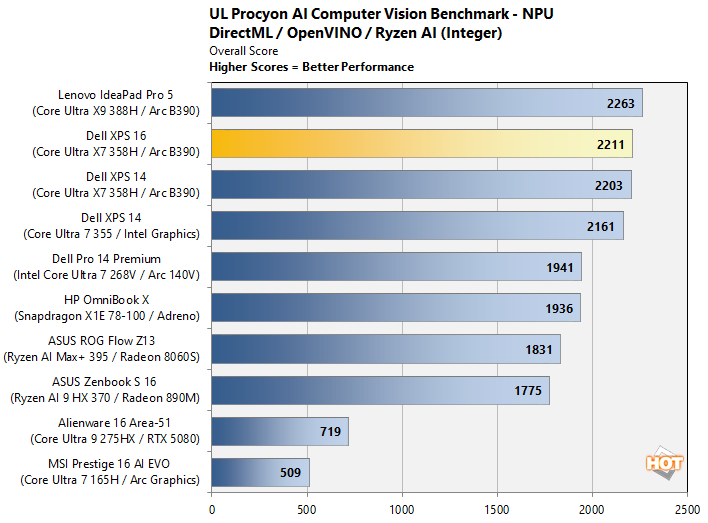
In Procyon, we see an NPU performance result that comes in almost exactly even with the identical Core Ultra X7 358H in this machine's little brother. Intel's Panther Lake NPU is among the most powerful in the business right now, so if that's important to you, this machine will absolutely kick butt in that regard.
UL 3DMark Gaming Benchmarks
3DMark has a wide variety of graphics and gaming related tests available. In this classic gaming benchmark suite, we chose to run 3DMark's CPU profile to see how the chip scales with more threads, and then the Steel Nomad Light test to see how raster gaming performance stacks up against other recent portables.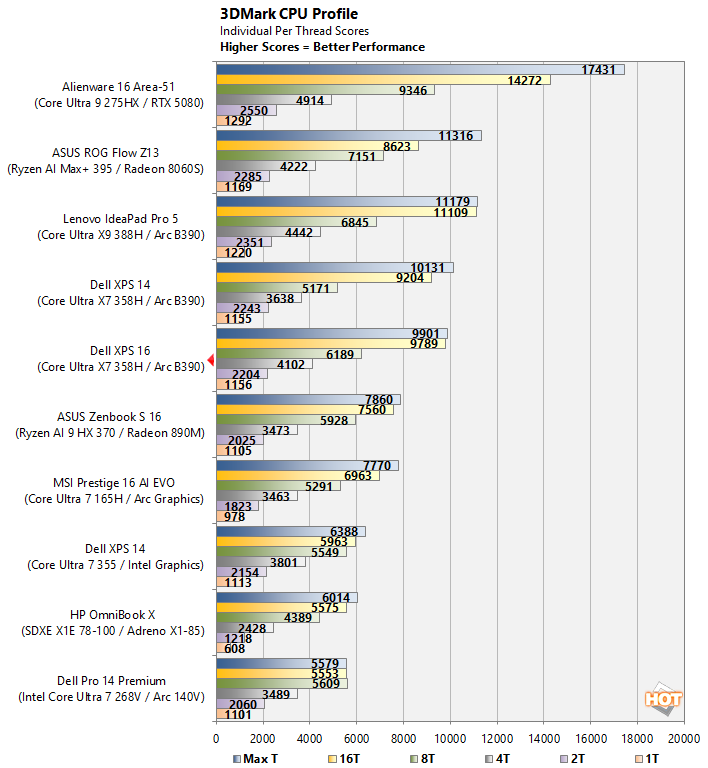
In the CPU Profile benchmark, we do actually see some odd results. The single- and 2-core tests are virtually identical to those on the XPS 14, but then things start to diverge in odd ways. Like all of the tests, we ran this one three times, so these results are an average of the overall results, and we can confidently say this test is not particularly deterministic. All in all, we come in ahead of the Ryzen AI 9 HX 370 and behind the Core Ultra X9 388H, which is as expected.
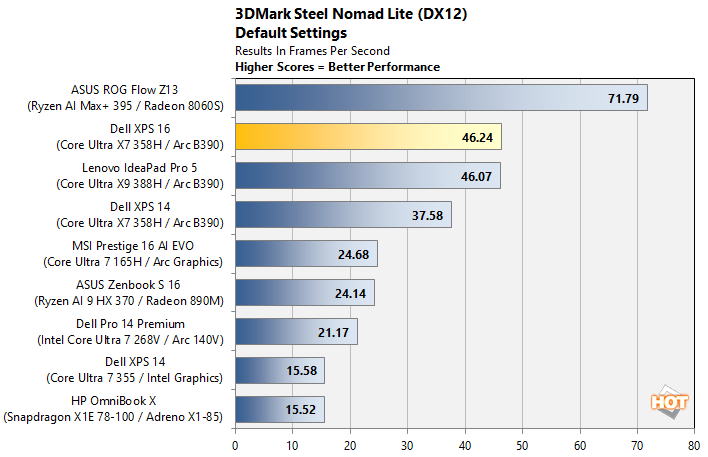
In the Steel Nomad Light test, we observe the XPS 16 actually offering up the second-best integrated graphics performance we've ever seen, and the comparison against the ROG Flow is hardly fair considering that machine's massive 80W power limit and double-wide memory interface. The fact that we're doing better than 50% of that system's result says loads about the efficiency of Intel's Arc B390 graphics hardware. It's too bad we (apparently) won't be seeing discrete gaming GPUs with this architecture.
Game Benchmarks With F1 25 & The Talos Principle II
We also ran some fairly taxing gaming workloads on the laptops with F1 25 and The Talos Principle II at 1080p resolution for normalization. With F1 25 we used the game's "High" image quality preset, which uses high-quality graphics settings without ray tracing. For The Talos Principle II, we used the game's "Medium" quality preset. Resolution scaling was disabled in both games to show the native framerate across all platforms and iGPUs.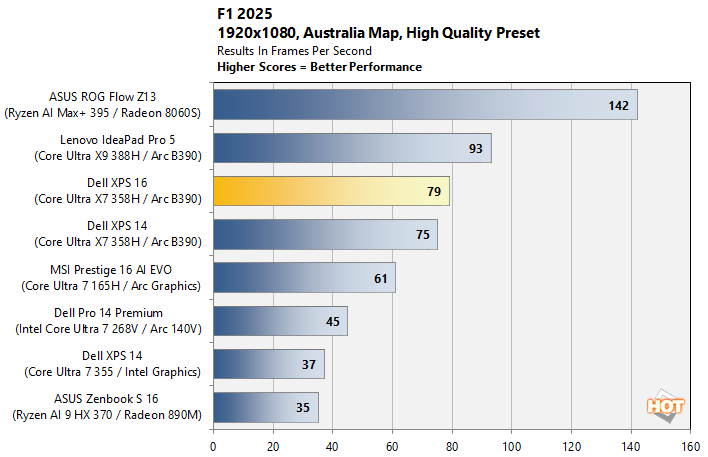
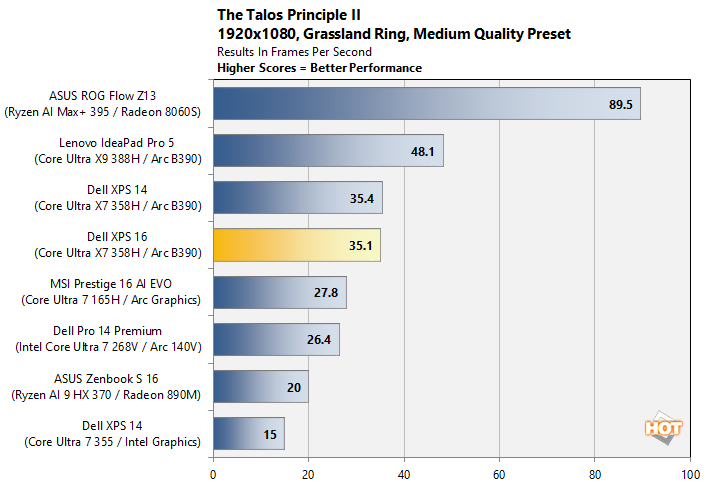
These real-world gaming tests more or less reinforce what the synthetic benchmarks suggest. The higher power limit on the Ultra X9 388H really lets that chip stretch its legs, while the XPS machines are doing their best under a stark 25W SoC power limit. Frankly, the fact that we can crank out 79 FPS in native 1080p in F1 25 using integrated graphics is wild. We can't wait to see gaming handhelds based on this chip; they're going to dominate the field for the foreseeable future.
All in all, the XPS 16 (DA16260) performs similarly to the XPS 14 using the same processor. Shocking, we know. Still, it's always important to confirm these things. Let's take a moment to talk about thermals, noise, and battery life before we get into our final thoughts.