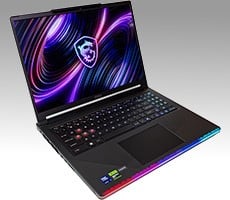


MSI Raider 16 Max HX Review: 300W Of Power In A Beastly Laptop


Now, with that said, we have to caveat that our machine came pre-configured by MSI with a local user account. It's completely possible that MSI may have removed some bloatware (or simply never installed it) that comes on retail machines. So we're not awarding or taking off points here, but we're also not going to go over the software setup in detail because our review machine simply didn't come with much on it.
Instead, let's dive directly into the benchmarks, starting off with ATTO as per usual:
ATTO Disk Benchmark
The ATTO disk benchmark is a fairly quick and simple test which measures read/write bandwidth and IOPS across a range of different data sizes. While we don't typically compare these results across multiple machines, it's useful to gauge whether a particular notebook's storage subsystem is up to snuff.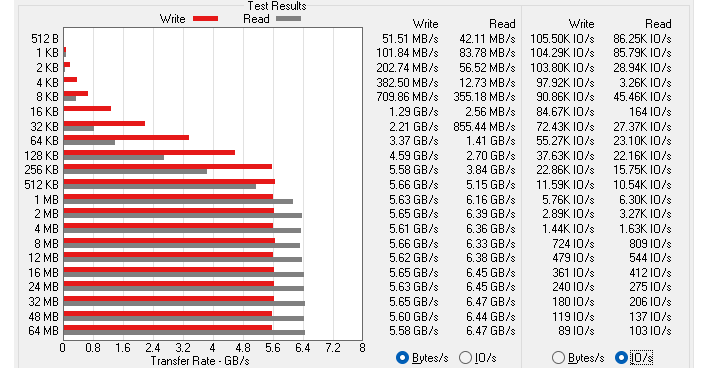
The Raider 16 MAX HX comes with a Micron 2500 SSD inside. This is a DRAM-less PCIe 4.0 x4 SSD using QLC flash, which is to say that it's a relatively cost-optimized drive. However, it's also a very modern model with a cutting-edge in-house controller, and it puts up the performance we'd expect from such an SSD. There are a few quirks in the data here; we're chalking those up to Windows 11 background nonsense. By the way, the drive was nearly full when I did this benchmark. Very impressive stuff as it hits nearly 6.5 GB/second. We'd honestly prefer to see a better SSD in a system at this price point, but market conditions prevail, and besides, you can always replace this drive or supplement the system with a second SSD later.
Speedometer 3 Browser Benchmark
We use BrowserBench.org's Speedometer test to take a holistic look at web application performance. This test automatically loads and runs a variety of sample web apps using the most popular web development frameworks around, including React, Angular, Ember.js, and even plain-Jane JavaScript. All tests were performed using the latest version of Chrome.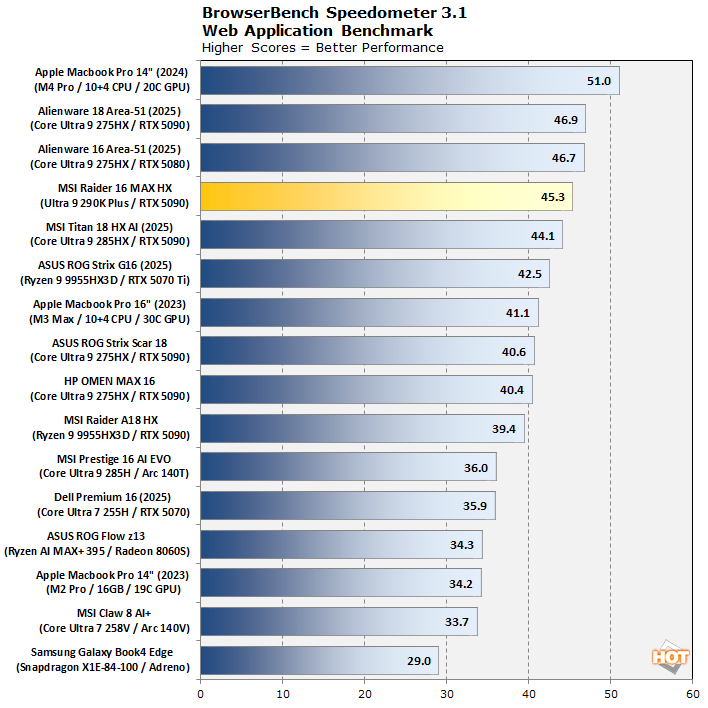
For reasons that aren't completely clear to us, the Raider 16 MAX HX does come in just slightly behind the Alienware systems with the non-"Plus" Arrow Lake HX chips, but the performance is so close it's nearly within run-to-run variance. Notice how these machines completely dunk on lower-power laptops; big caches and big clocks can brute-force this benchmark. Perhaps there have been Chrome security updates since we reviewed the Area-51 systems too.
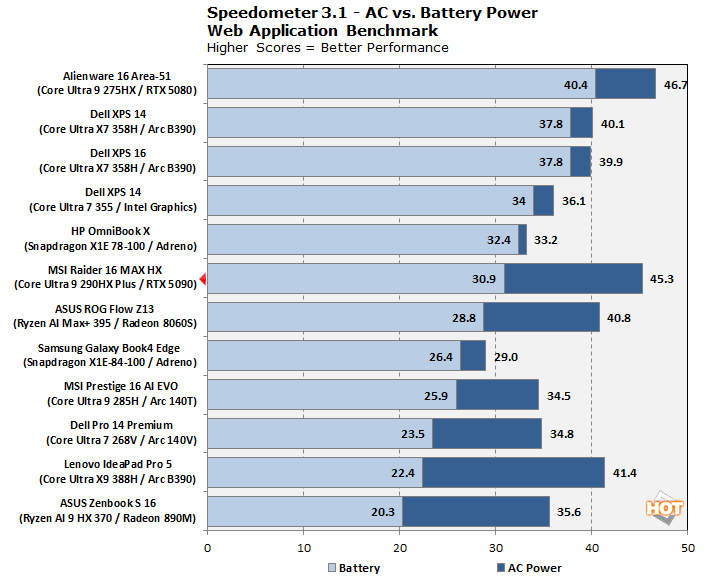
Since MSI emphasizes that this is a machine for work as well as play, we also tested the Raider 16 MAX HX on battery in a couple of benchmarks to see how it holds up. Falling back to battery power, it loses a LOT of responsiveness as the CPU conservatively constrains clocks to save power, but 30.9 isn't a terrible result; it's still faster than the Snapdragon X Elite even when that machine is on wall power. It does fall far behind the Alienware 16 Area-51, but that machine gleefully sacrificed battery life for performance, as you'll see.
MAXON Cinebench 2026 3D Rendering Benchmark
Next up is the latest-generation 3D rendering benchmark from Maxon, based on the Cinema 4D rendering engine. It's a purely CPU-based test that doesn't make use of the graphics processor at all, and it scales very well with additional CPU cores. We ran both single- and multi-threaded tests on all of the machines in the charts.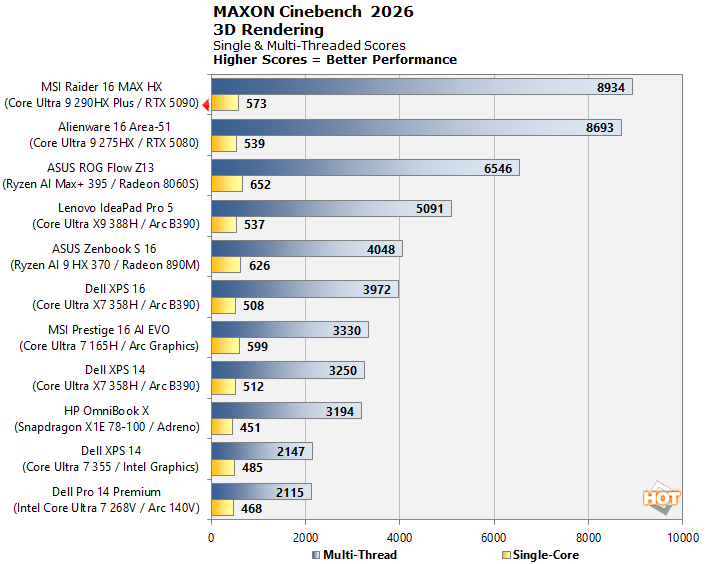
In Cinebench 2026, the Raider 16 MAX HX flexes its cooling might to put up a very impressive multi-core score. For the single-core scores, remember that we're testing single-core, not single-thread; the CPUs with hyper-threading see a significant boost here. Frankly, the fact that we're looking at 573 on a single thread is downright gobsmacking. Very impressive stuff from Intel and MSI here.
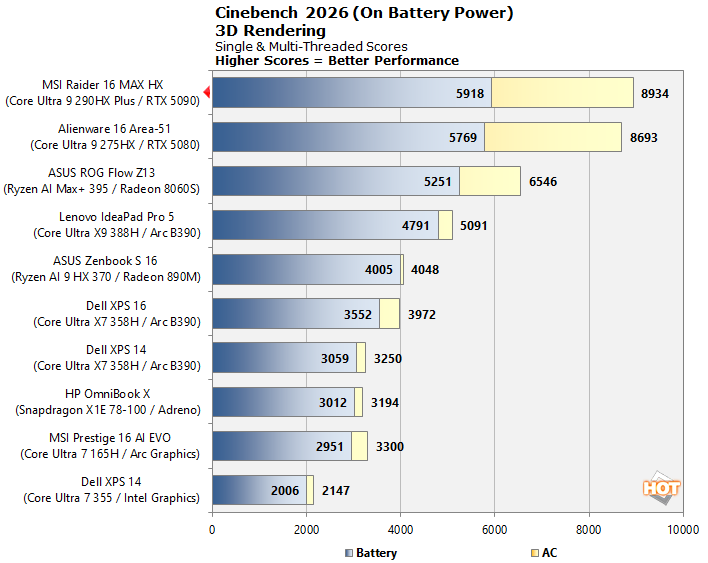
We also tested Cinebench on battery power, and it's a very different story from Speedometer. While we're still slashing performance by fully 1/3 compared to being plugged-in, it remains the fastest machine on the chart. We actually do have some higher results both on battery and wall power, but they're larger 18" desktop replacement-class machines that didn't seem completely fair to compare here.
Geekbench 6 CPU Performance Benchmark
Geekbench is a cross-platform benchmark that simulates real-world workloads in a wide variety of tasks, including encryption, image processing, physical simulation, machine learning, and many more. We tested the systems featured here with the latest Geekbench 6 version to get an idea of their overall system performance.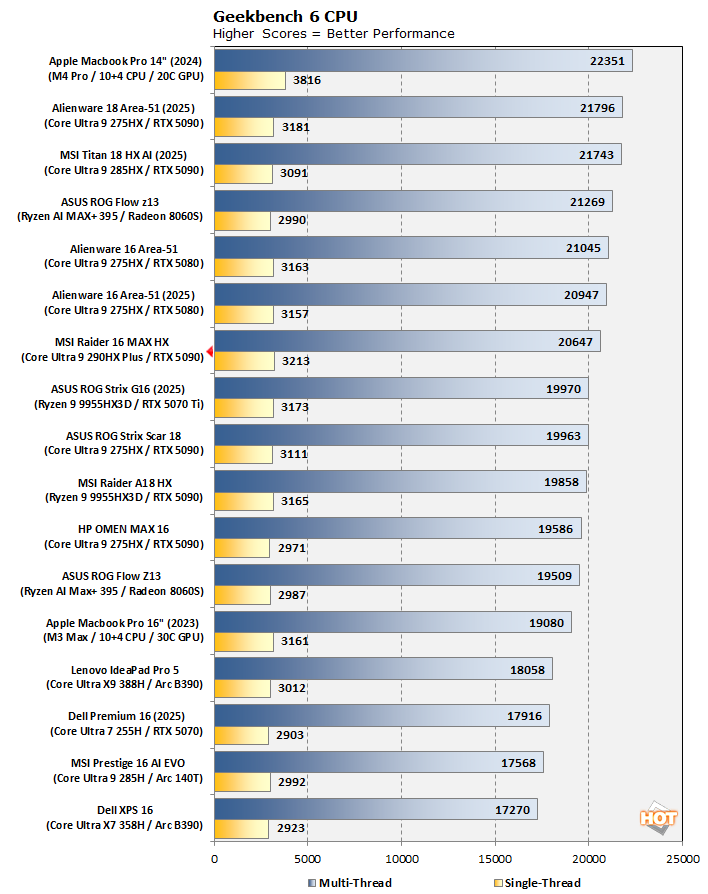
In Geekbench, the multi-core results are a little underwhelming. We're chalking this one up to the relatively slow DDR5-5600 SODIMM memory that MSI had to ship thanks to the ongoing RAMageddon; Geekbench is very sensitive to memory speed and timings, and this RAM is not the hot-clocked CSODIMMs that this system optimally supports. The single-core result is still very good, though, beating everything else on the chart save for the Apple M4 Pro, and we've written plenty about our feelings concerning Apple products and Geekbench results.
Geekbench AI Machine Learning Benchmarks
The Geekbench AI benchmark provides a straightforward look at how well a device handles a variety of AI-assisted tasks. This quick and easy test gives you a numerical snapshot of the CPU, GPU, and NPU's ability to power through real-world machine learning workloads, factoring in both speed and accuracy. The higher the score, the better the device's AI chops, whether it's image recognition, object detection, or natural language processing.Results are presented in three levels of numerical precision: single precision or FP32, half precision or FP16, and quantized or INT8. All results that the benchmark provides are geomean scores from multiple runs of each test workload.
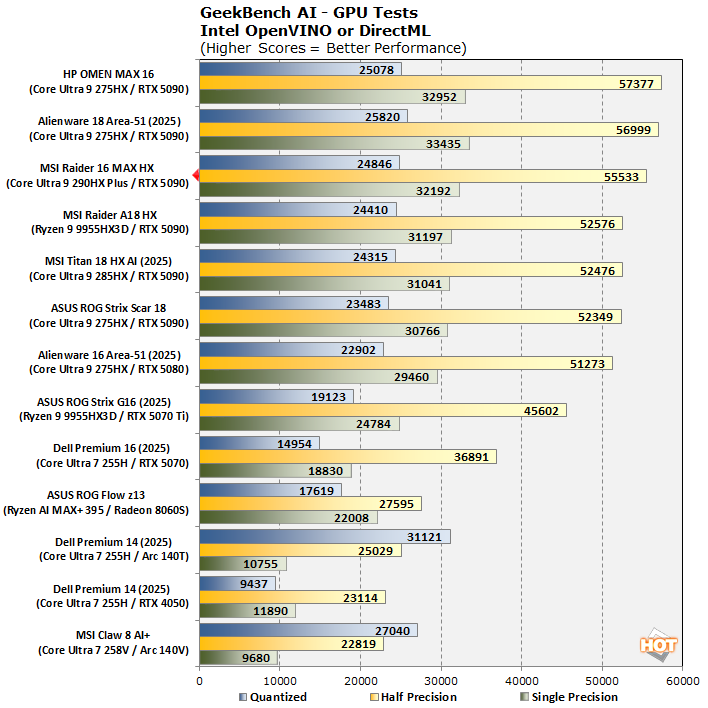
In the GPU testing, well, the GeForce RTX 5090 rules. MSI's machine puts up markedly better results than several significantly larger laptops with the same GPU; it's entirely possible that NVIDIA may have made significant driver updates improving AI performance since those tests. In any case, all these machines (including the very similar-performing Alienware 16 Area-51) are capped at 175W GPU power, and so performance is nearly identical.
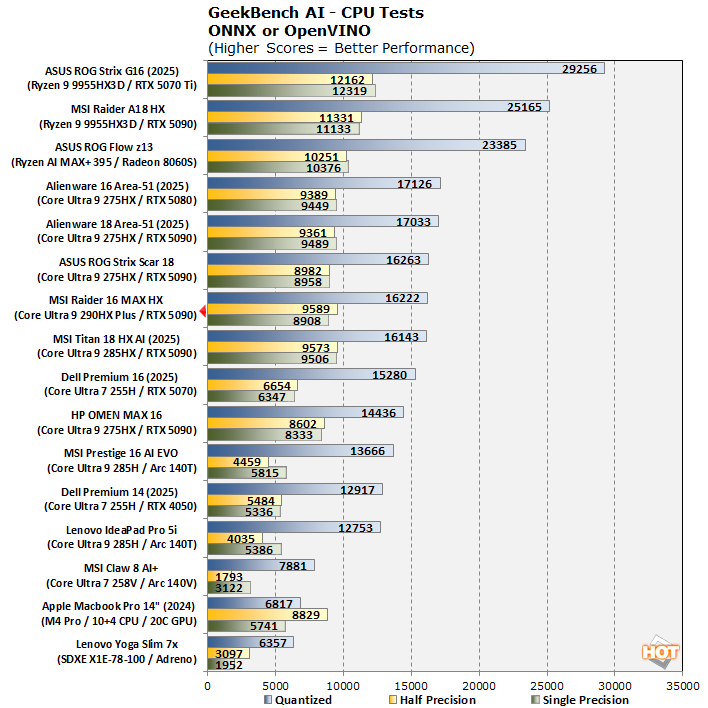
In CPU testing, the Core Ultra 9 290HX Plus performs basically identically to its close cousins, the non-Plus Arrow Lake chips. AI processing is mostly about memory bandwidth and compute throughput, so it's there's really nothing to see here; everything is performing as expected. AMD's support for AVX-512 is why its chips are crushing these benchmarks.
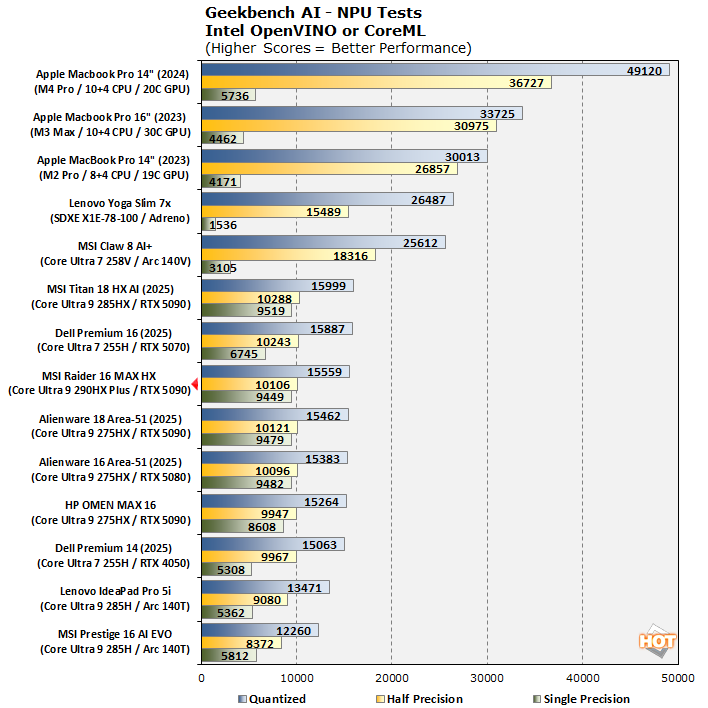
Finally, in the NPU tests, well, the Core Ultra 9 290HX Plus doesn't have the upgraded NPU from Lunar Lake or Panther Lake, so it gets punked in these tests. At least this chip is performing right around the same as its siblings. Unlike Apple and Qualcomm's Arm chips, Intel and AMD's x86 CPUs tend to be paired with powerful dGPUs, which make the NPU a little redundant.
UL PCMark Applications Office Benchmarks
We've started using the PCMark 10 Applications benchmark a bit more because it measures performance in Office and Edge using native instruction set-compatible versions of the apps for optimal performance across both x86 and Arm architectures. The following results should paint a picture of Microsoft Office productivity performance with the best foot forward from all systems tested.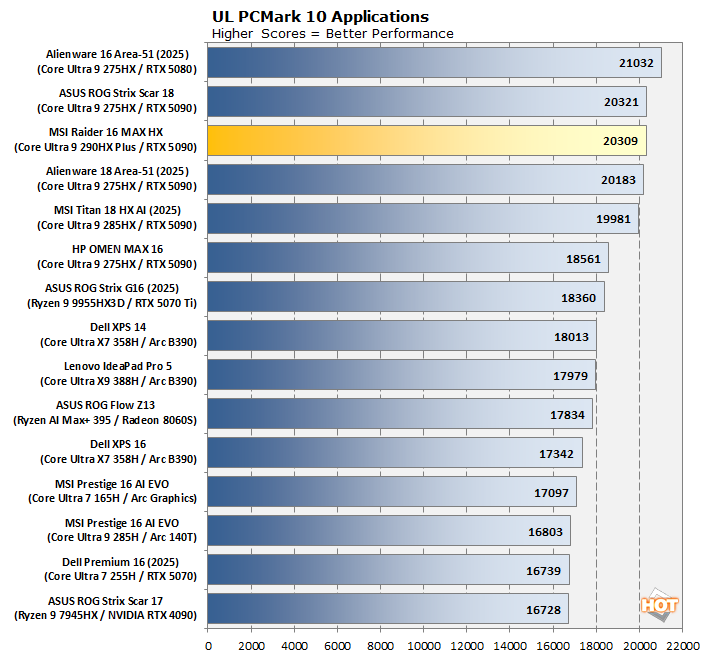
As with most of the rest of our testing, the MSI Raider 16 MAX HX ends up nestled in tightly against the rest of the Core Ultra 9 machines in this benchmark. The newer Panther Lake machines (Core Ultra 300 series) are very impressive for how little power they use, but as they say, "there's no replacement for 24 cores and 125 watts."
Puget Bench For Creators: Davinci Resolve
Next up, we have some video editing and encoding tests using the Puget Bench for Creators and Davinci Resolve. Puget Systems has been developing benchmarks that leverage real-world applications and workloads since 2020. These tests are highly regarded by creators, and leverage popular creative tools like the Adobe applications as well as Blackmagic's Davinci Resolve. Here, we used the free version of Davinci Resolve that features less hardware acceleration and relies heavily on CPU, GPU and memory performance.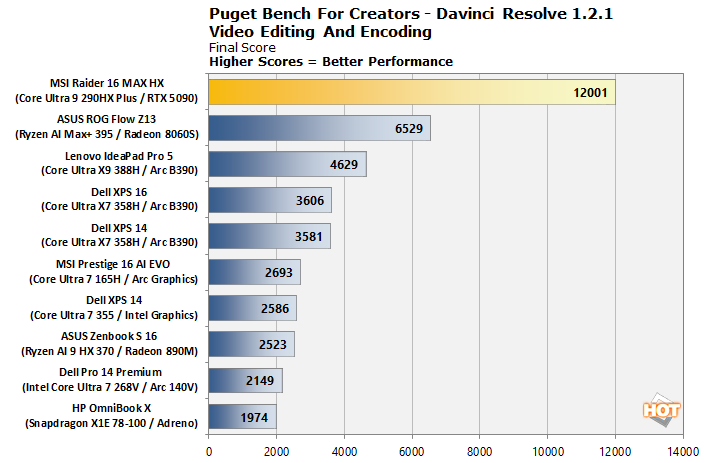
We don't have comparative results for any of the other big and powerful gaming laptops here, but this serves to show what kind of performance uplift you can see going from a thin & light machine to a proper productivity PC in Davinci Resolve. The benchmark score is nearly double that of AMD's Ryzen AI Max+ 395, and nearly five times that of the Dell XPS 14. A fair comparison? Not even a little bit on the portability, power, and price axes. But it just goes to show; if you want to do real work, a real workstation can provide a massive boost.
UL 3DMark Synthetic Gaming Benchmarks
3DMark has a wide variety of graphics and gaming related tests available. To best match up with the historical benchmark data that we have hanging around, we ran the Fire Strike Extreme QHD DirectX 11 benchmark, the Time Spy QHD DirectX 12 benchmark, and the Port Royal DXR ray-tracing benchmark. First up, Fire Strike Extreme: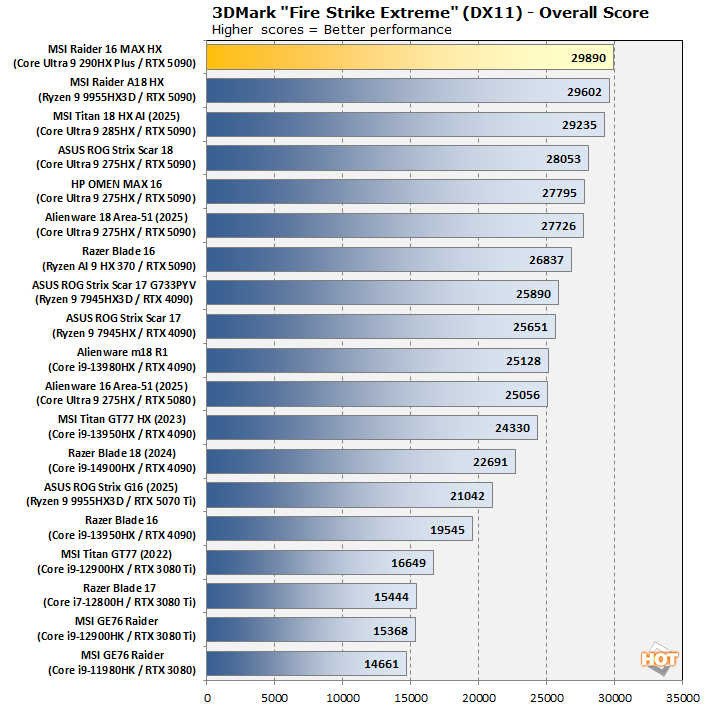
MSI's system actually tops the chart in Fire Strike Extreme, which is all the more impressive because I didn't set the system to "extreme performance" for benchmarking. Instead, we left it on the default "MSI AI Engine" setting, which purports to adjust system settings in response to the workload. Whatever it did for this test, it did some good for these results.
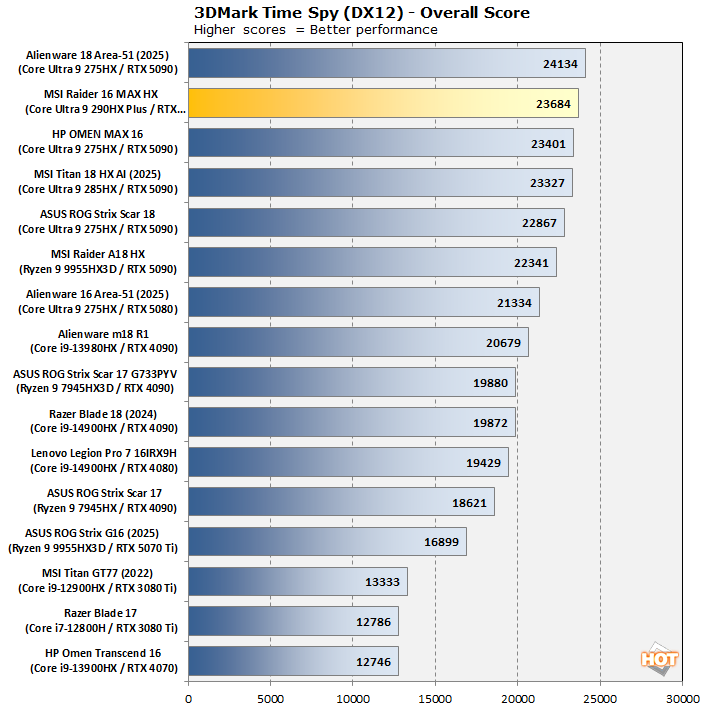
In 3DMark Time Spy, the Raider 16 MAX HX falls a spot, felled by the beastly Alienware 18 Area-51. The Raider 16 MAX HX still offers the best performance of 16" class machines that we've tested, though. Ultimately all of the systems with GeForce RTX 5090 GPUs do pretty similarly.
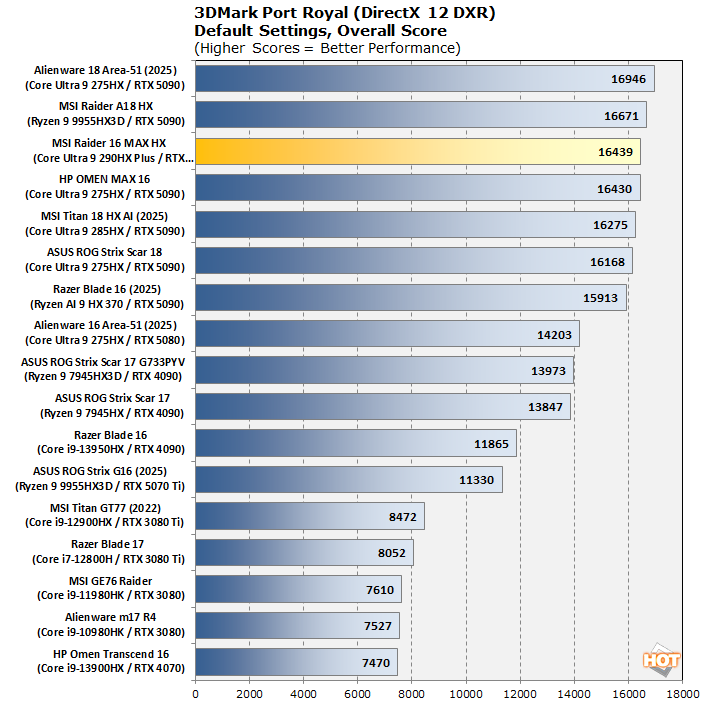
In the Port Royal ray-tracing benchmark, we see an even tighter clustering of systems with GeForce RTX 5090 GPUs, and there's a clear demarcation between the RTX 5090 and RTX 5080 systems, and then again between the RTX 4090 and slower GPUs. Real-time ray tracing has come a hell of a long way since it was first introduced with NVIDIA's Turing architecture some eight years ago.
Middle-earth Shadow of War DirectX 11 Benchmarks
Middle-earth: Shadow of War is an ultra-violent open-world action title set in J.R.R. Tolkien's Lord of the Rings universe. To test the game's performance relative to other systems, we set the visuals to the High preset and tested in 2560×1440 exclusively, because the 1080p results simply aren't relevant or practical on a system like this. The frame rates here are the average reported by the built-in benchmark.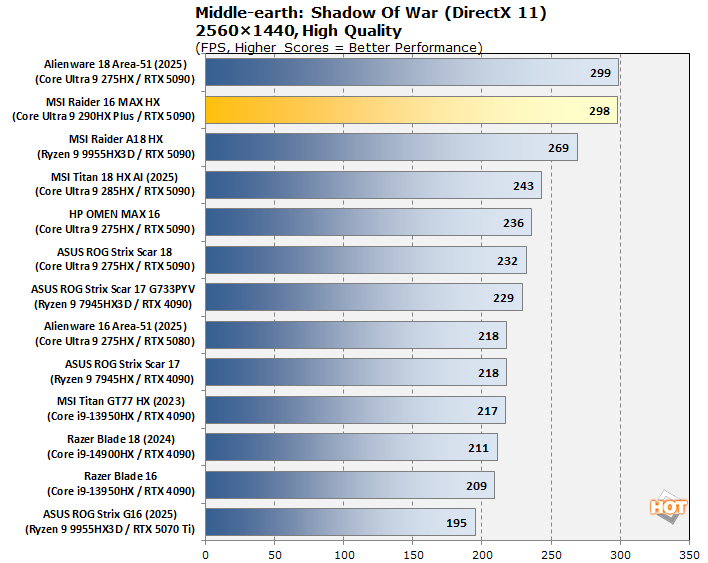
This game is pretty old at this point, and we'd not still be using it as a benchmark if we had comparative data for newer titles. We're working on it. Regardless, you can see that the Raider 16 MAX HX offers outstanding DirectX 11 gaming performance, standing essentially equal to the greatest we've ever tested. Frankly, we're surprised it didn't outpace the Alienware 18 given the 3DMark Fire Strike showing, but either way this is phenomenal.
Shadow of the Tomb Raider DirectX 12 Benchmarks
Shadow of the Tomb Raider is easily the best-looking of the rebooted Tomb Raider trilogy, and it also has the least obnoxious whining from Lara. While it's a bit older, the developers continued to update the game for years after its launch, and so it's brimming with fancy tech, including all three vendors' smart upscalers, ray-traced shadows, and even Tobii eye-tracking support. To test this game out, we turned the visuals up to their highest preset and tested at 2560x1440. Note that this doesn't include the aforementioned ray-traced shadows.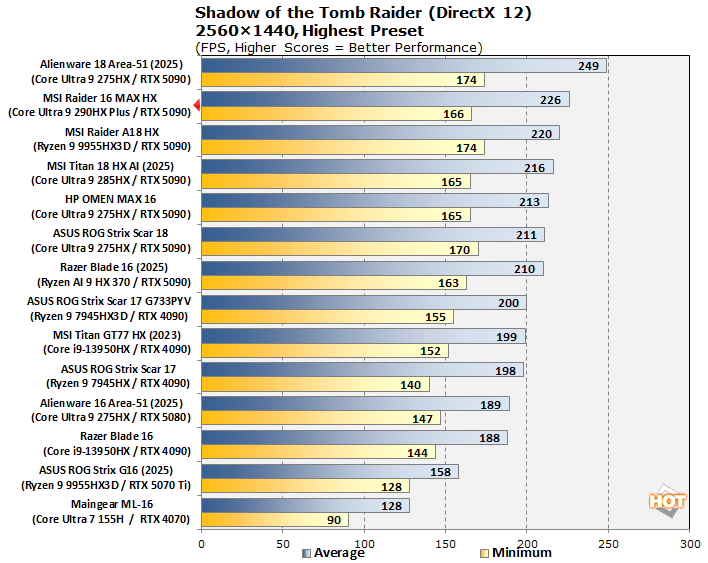
Marvel's Guardians Of The Galaxy DXR Benchmarks
Marvel's Guardians of the Galaxy is an action-adventure game where you play as Star-Lord and lead the rest of the nominative Guardians from mission to action-packed mission, just full of that series' trademark quirky humor. The game's minimum requirements only call for a Radeon RX 570 or GeForce GTX 1060-class GPU, but it also supports some of the latest graphics technologies, including DXR and DLSS, so it's still serving as our ray-traced gaming test, for now.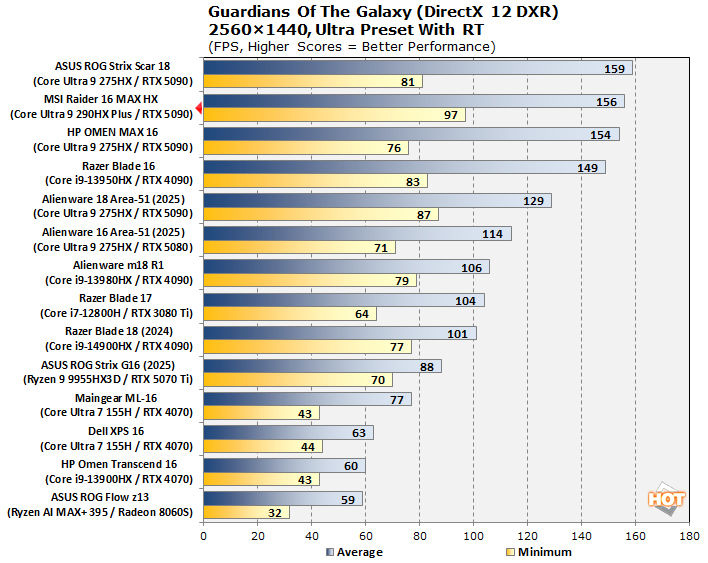
A very unusual trend here; we see the MSI Raider absolutely killing this game in terms of both average frame rates and 1% lows. This game has had weird benchmark behavior for a long time now, and we've been meaning to retire it, but we don't have any of the older machines still on-hand to retest it. We intended to settle on the Monster Hunter Wilds benchmark, but CAPCOM pulled the rug out from under us on that one. We'll be updating our test suite for gaming laptops soon, so don't fret if you don't find these results very informative. At least, you can be confident that the CPU and GPU are offering the performance that you expect given the specs.
F1 24 Formula One Racing DLSS Benchmarks
The previous iteration of Codemasters' annual officially-licensed F1 racing game carries forward the gorgeous custom ray-traced global illumination (RTGI) solution from F1 23 while improving texture quality and performance across the board. Many environmental objects have had their detail improved, and the tracks look a lot more like their real-world versions in this release, especially after a major graphics patch back in December 2024.We also wanted a test to demonstrate the benefits of NVIDIA's DLSS technology in terms of performance, and F1 24 presents the perfect opportunity to do so. We stuck to comparing systems with Blackwell GPUs because it was the most apples-to-apples comparison given that the Blackwell architecture performs frame generation in a different manner than the older Ada Lovelace architecture from the RTX 40 series.
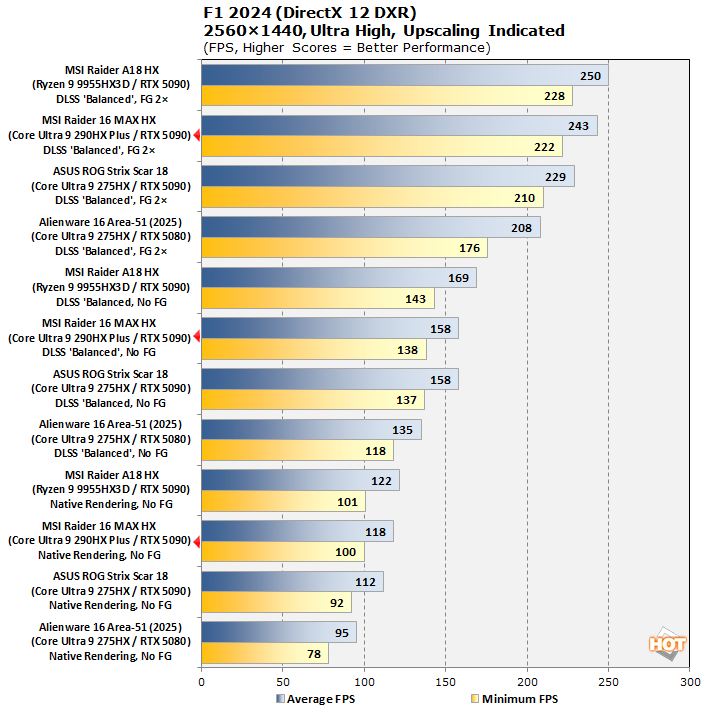
The MSI Raider 16 MAX HX actually wallops the Alienware 16 here, but that's no surprise; the Alienware system has a GeForce RTX 5080 inside. More impressively, it also keeps pace with the ASUS ROG Strix Scar 18 and MSI's own Raider A18 HX, both systems with the same GeForce RTX 5090 GPU but larger chassis with, in theory, more room for cooling. DLSS upscaling and 2x frame generation take this game from a paltry 118 FPS all the way up to 243 FPS, exceeding even the 240-Hz refresh rate of the OLED screen.
In summary, the performance of the Raider 16 MAX HX is basically beyond reproach. It's not the fastest laptop we've ever tested overall, but it might just be the fastest 16" laptop we've had on the bench. Let's see how it holds up in our thermal, acoustic, and battery tests next.