Intel SSD 670p Review: Snappy, Budget-Friendly NVMe Storage

Unlike some of the more recent ultra-high-end PCIe Gen 4 SSDs to be released recently, complete with insanely high sequential transfer speeds north of 7GB/s, the Intel SSD 670p eschews the blazing sequentials in favor of optimized performance for random transfers at low queue depths that are more common in every day computing task and contribute to better overall system responsiveness. That’s not to say the Intel SSD 670p is a slow SSD, though – it still offers peak transfers north of 3GB/s.
Here’s a breakdown of the drive’s main features and specifications and we’ll move on to some benchmarks in a just a bit...
|

The Intel SSD 670p will initially be offered in three capacities, 512GB, 1TB, and 2TB. We have the highest-capacity 2TB model represented here represented in the pictures below and tested a little later on.

As mentioned earlier, all of the drives in the 670p family leverage Intel’s latest 144-layer QLC 3D NAND flash memory, which is more economical to produce than previous-gen TLC or MLC NAND. Paired to the NAND is a small DRAM cache, and a native NVMe PCI Express controller built by Silicon Motion (SMI) – the SMI 2262, to be exact.

If you inspect the pics here, you'll notice there's virtually nothing happening on the back of the drive, and the front is home to the controller, the QLC NAND, and DRAM cache. The native NVMe-controller has a x4 PCIe Gen 3.0 interface (max bandwidth of 4GB/s – this isn’t a PCIe Gen 4 drive) and the drives support all of the features you’d expect from a modern SSD, like TRIM, garbage collection, S.M.A.R.T., etc.
Like many drives that use TLC NAND, Intel configures a portion of the NAND on these drives to act as an SLC cache for faster write throughput. Depending on the unused capacity of the drive, however, the ultimate size of the SLC cache will dynamically adjust up or down. Though there is a base level that remains constant, the overall amount of SLC available to accelerate writes changes based on the total and unused capacity of the drive. The slide below outlines where it falls on all three models.

Should the SLC cache be exhausted, write performance will degrade, however, doing so requires relatively large sequential writes. If you’re not copying or writing large amounts of fresh data, the size of the SLC cache is plenty for day-to-day consumer workloads.
Intel warranties the SSD 670p series drives for 5 years, which is on par with other NVMe PCIe solid state drives, and endurance is rated for 185 TBW per 512GB of capacity, which is an 85% improvement over the older 660p series. It is somewhat lower versus come competing drives though, but endurance should still be plenty for most consumers.


Intel SSD 670p 2TB Benchmarks
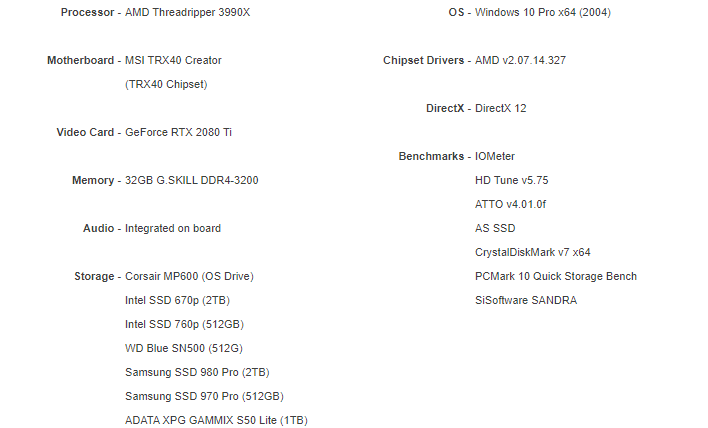
Under each test condition, the SSDs tested here were installed as secondary volumes in our testbed, with a separate drive used for the OS and benchmark installations. Our testbed's motherboard was updated with the latest BIOS available at the time of publication. The SSDs were secure erased prior to testing (when applicable), and left blank without partitions for some tests, while others required them to be partitioned and formatted, as is the case with the ATTO, PCMark, and CrystalDiskMark tests. Windows firewall, automatic updates, and screen savers were all disabled before testing and Windows 10 Quiet Hours / Focus Assist was enabled.

|
|
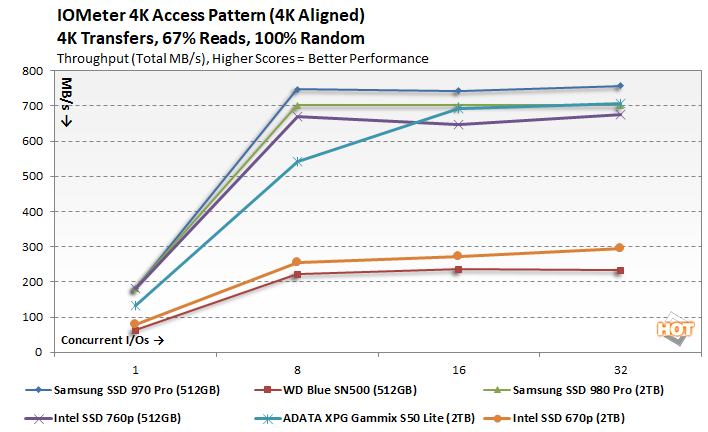
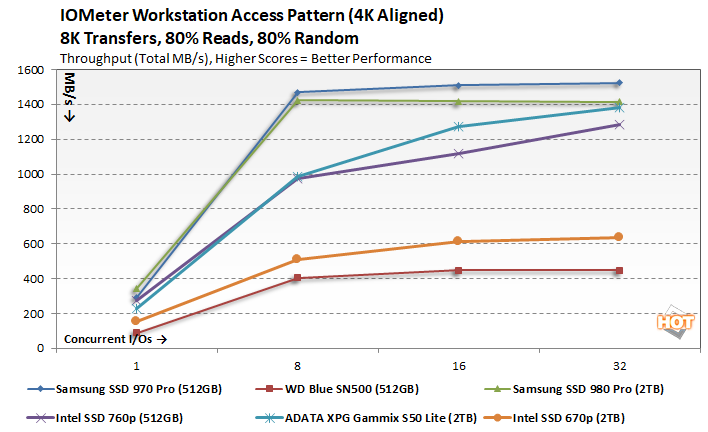
In the following tables, we're showing two sets of access patterns; a custom Workstation pattern, with an 8K transfer size, consisting of 80% reads (20% writes) and 80% random (20% sequential) access and a 4K access pattern with a 4K transfer size, comprised of 67% reads (33% writes) and 100% random access. Queue depths from 1 to 32 were tested...

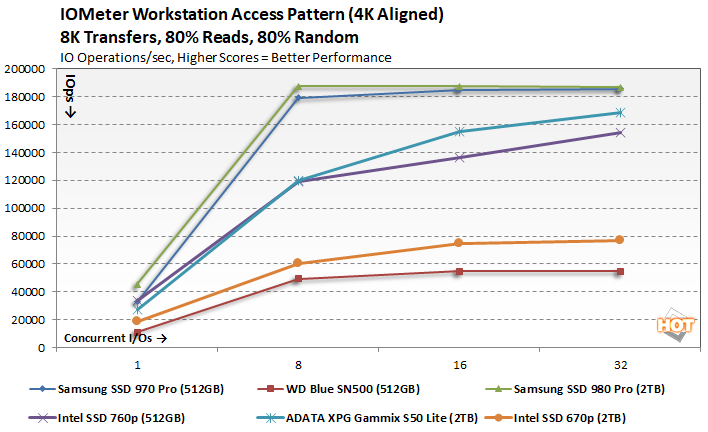
Although the Intel SSD 670p is optimized for random transfers at low queue depths, the read / write mix and access patters we used has the drive performing below all of the others we tested, save for the entry-level WD Blue SN500.
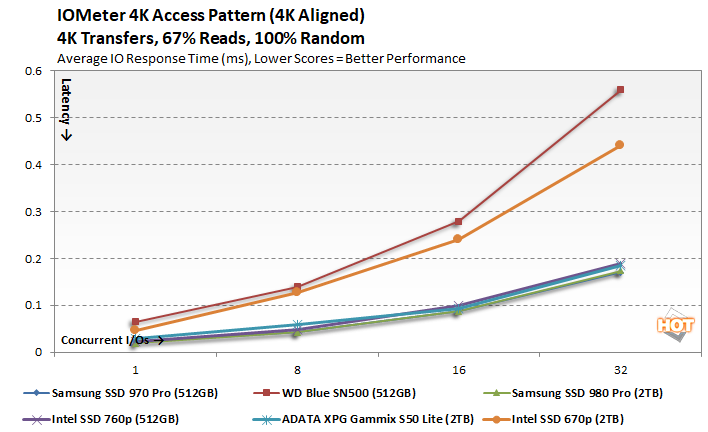
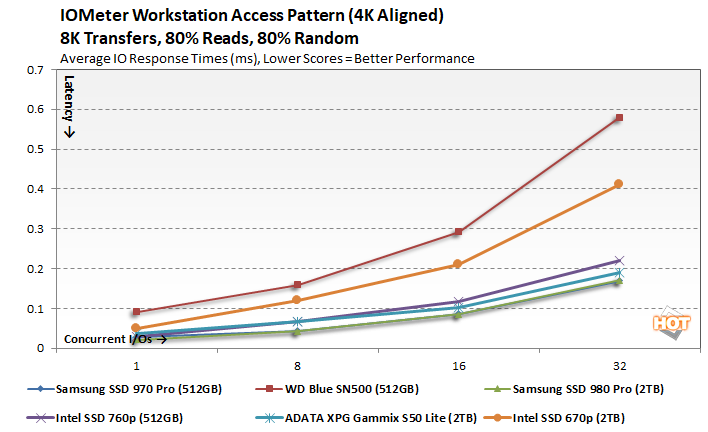
The latency characteristics of the 2TB Intel SSD 670 are better then the WD Blue SN500, but trail the other drives -- at least according to IOMeter.
|
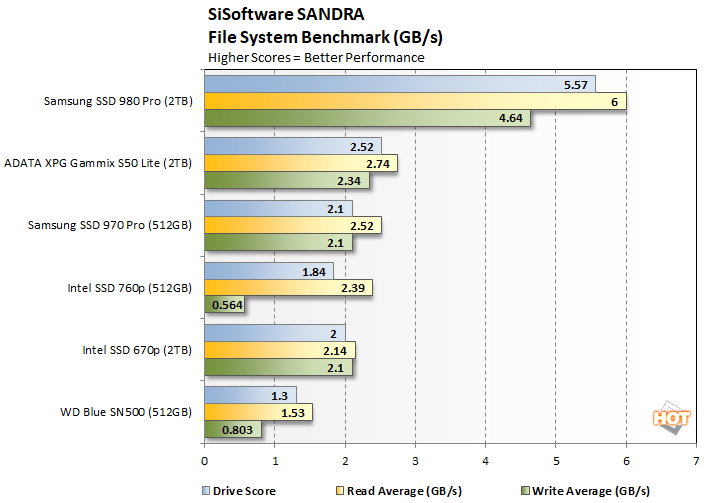
The Intel SSD 670p offered much better reads and has a better overall drive score than the Intel SSD 760p and WD Blue SN500. It's actually in the same neighborhood as the excellent Samsung SSD 970 Pro, save for its peak read performance.
|
ATTO is another "quick and dirty" type of disk benchmark that measures transfer speeds across a specific volume length. It measures raw transfer rates for both reads and writes and graphs them out in an easily interpreted chart. We chose .5KB through 64MB transfer sizes and a queue depth of 6 over a total max volume length of 256MB. ATTO's workloads are sequential in nature and measure raw bandwidth, rather than I/O response time, access latency, etc.
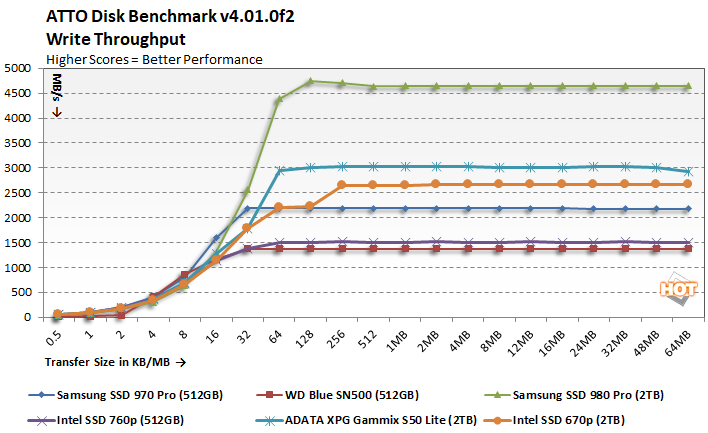
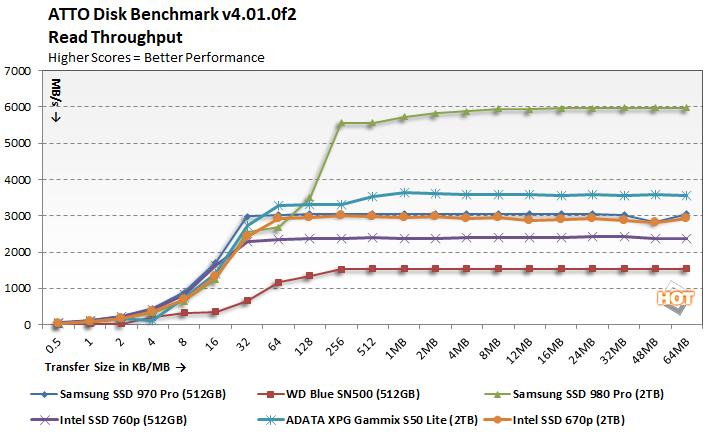
In ATTO's read and write bandwidth tests, the new Intel SSD 670p lands right about in the middle of the pack, on-par with or slightly better than the Samsung SSD 970 Pro. Reads peaked in the 3GB/s range with writes hovering around 2.7GB/s, at least with the larger transfer sizes. With 4K transfers all of the drives are tightly grouped.
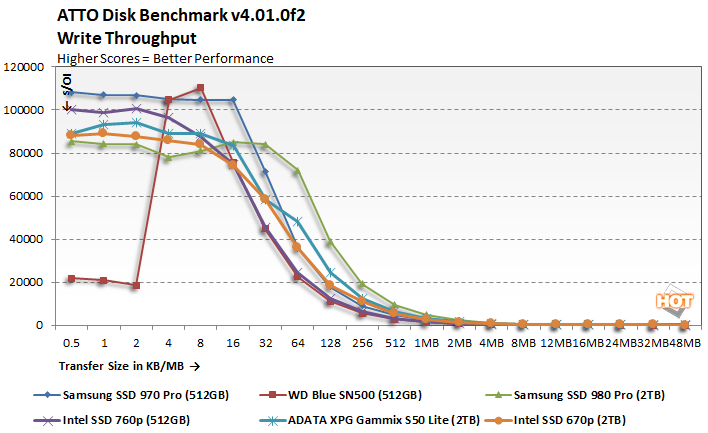
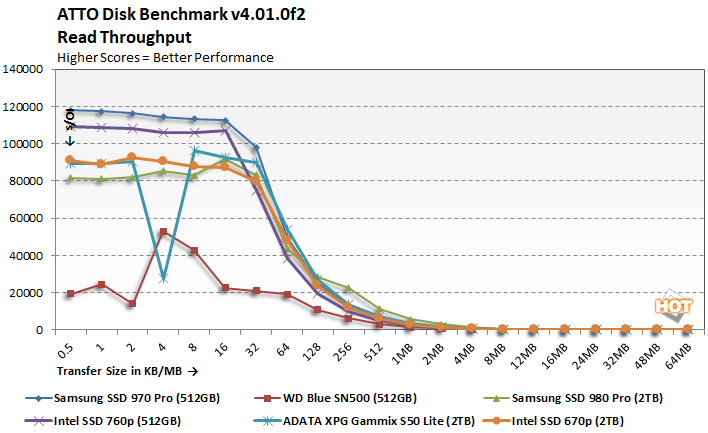
IO performance according to ATTO also has the Intel SSD 670p performing right about in the middle of the pack. Overall, IOs are roughly in-line with the mainstream, PCIe Gen 4 ADATA XPG GAMMIX S50 Lite.
|
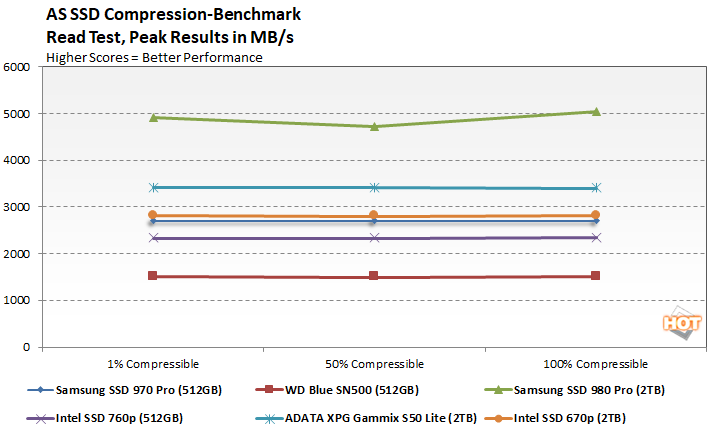
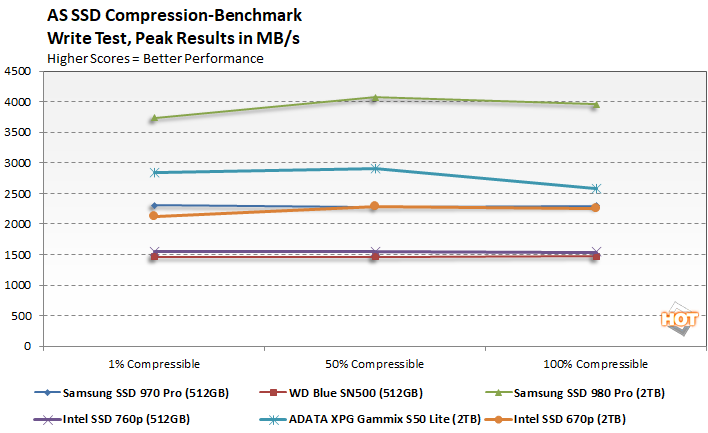
Next up we ran the Compression Benchmark built-into AS SSD, an SSD specific benchmark being developed by Alex Intelligent Software. This test is interesting because it uses a mix of compressible and non-compressible data and outputs both Read and Write throughput of the drive. We only graphed a small fraction of the data (1% compressible, 50% compressible, and 100% compressible), but the trend is representative of the benchmark’s complete results.