Intel Core i9-11900K And i5-11600K Review: Rocket Lake-S Liftoff
For our next series of tests, we moved on to some game-related metrics with 3DMark, specifically the physics benchmark that's part of the Time Spy test, along with a handful of actual games. For the 3DMark Physics test, we simply create a custom 3DMark run consisting solely of the physics test, which is CPU dependent, and report the results...
|
|
|

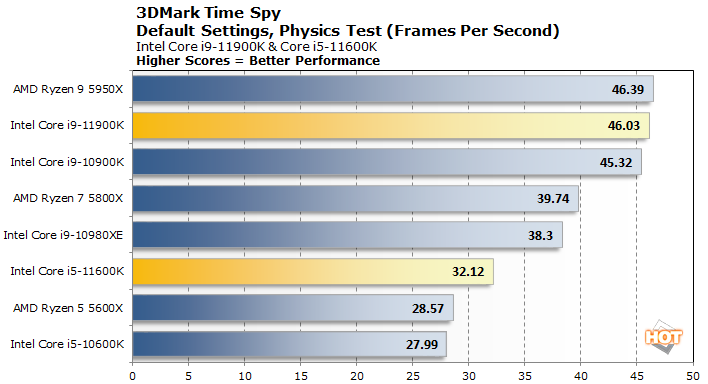
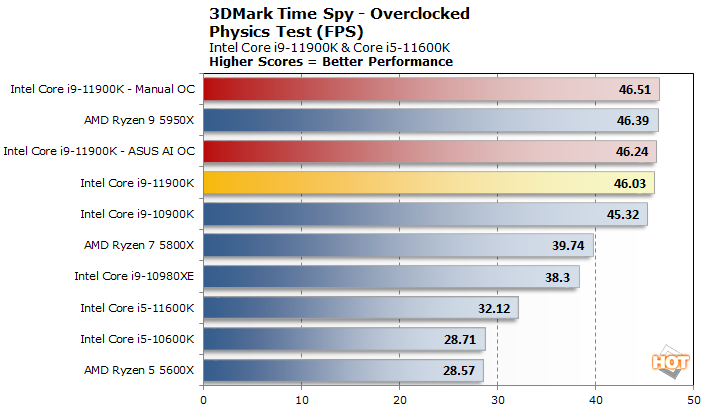
The multi-threaded 3DMark game physics tests has the Core i9-11900K finishing ahead of the Core i9-10900K and Ryzen 7 5800X, but just a hair behind the Ryzen 9 5950X. The Core i5-11600K continued to outrun its previous-gen counterpart and it outpaced the Ryzen 5 here as well.
|
We also ran some mid and high-resolution game and graphics tests on our test rigs with 3DMark, Gears Tactics, and Metro Exodus. We used 3DMark's default Time Spy preset, and both of the games were run in two different configurations -- either 1080p with Medium details, or 4K with High/Very High/Ultra details. The lower resolution tests are more CPU bound, while the higher resolution tests are more GPU bound.
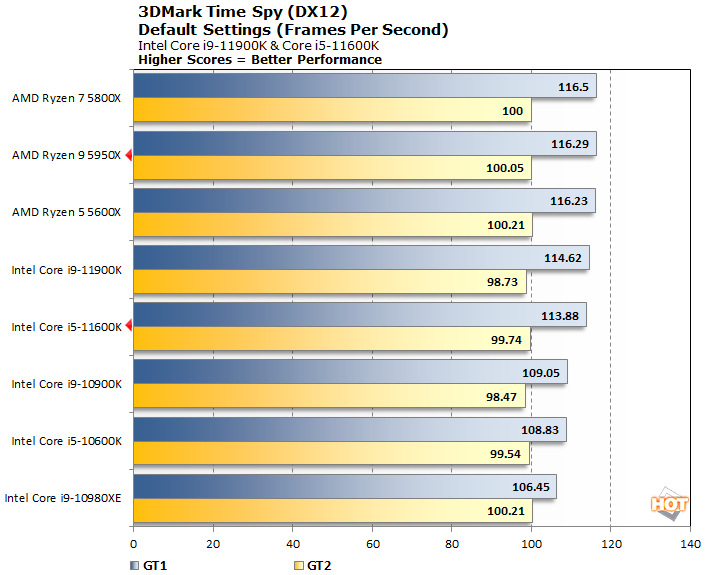
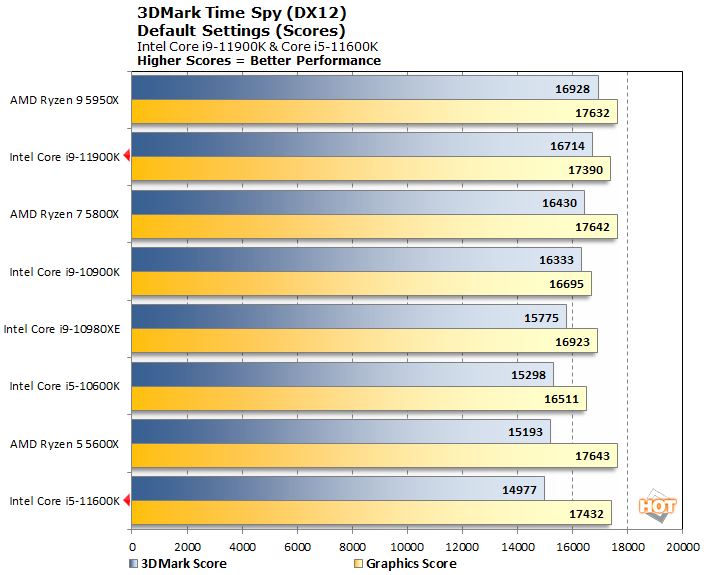
Time Spy had the Core i9-11900K finishing in second place, behind only the 16-core Ryzen 9 5950X. The Core i5-11600K technically finished last, but note its actual frame rates and the graphics score. The overall score was somewhat lower (and that's how the chart is sorted), but the graphics score and actual frame rates put it in the fourth position.
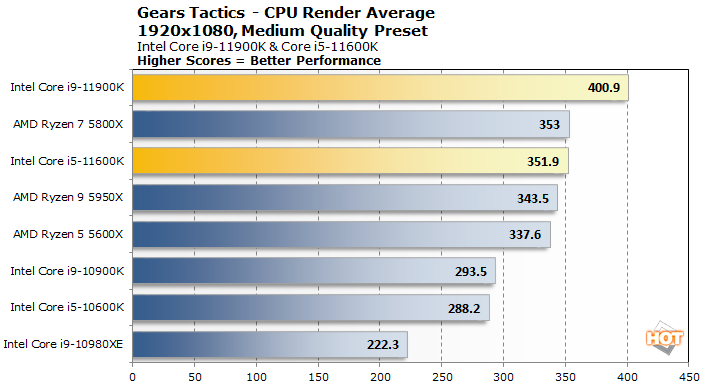

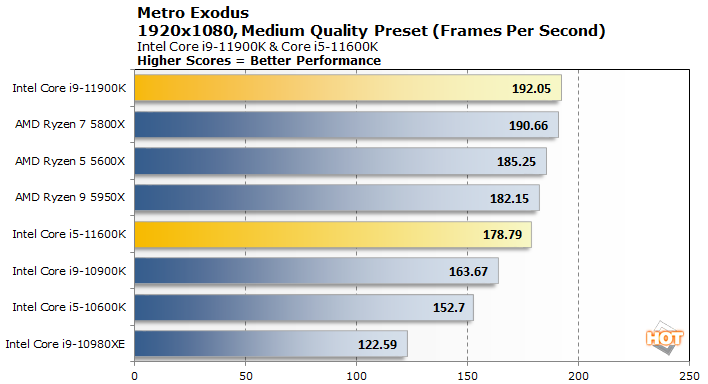
The medium-quality, high-framerate 1080p in-game tests also show the Core i9-11900K performing well, leading the pack in both games. The Core i5-11600K also puts up some good numbers, landing about in the middle of the pack, but right in the mix with the higher-end parts.
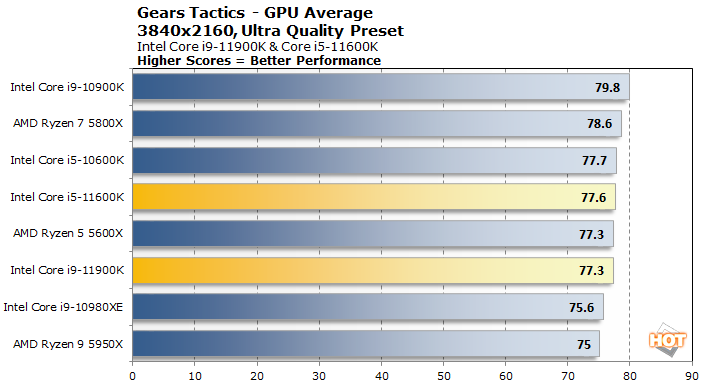
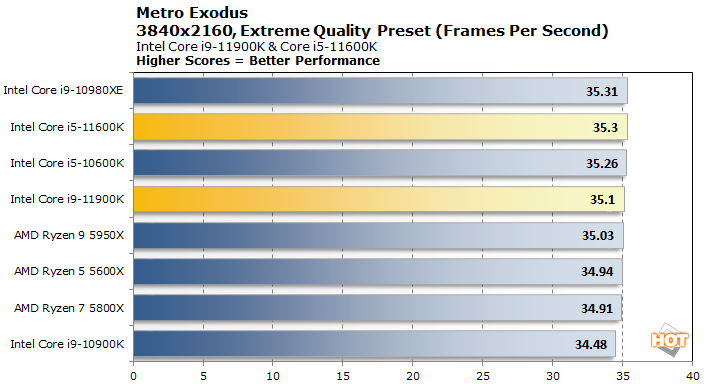
When you crank up the resolution and image quality, and shift the performance bottleneck onto the GPU, framerates level off significantly and all of the systems perform within a couple of frames per second of one another.
Integrated Graphics Performance
We also ran a couple of tests on both the Core i9-11900K and Core i5-11600K using their integrated graphics and compared them to a handful of numbers we had available using older Intel solutions and an array of Radeon IGPs.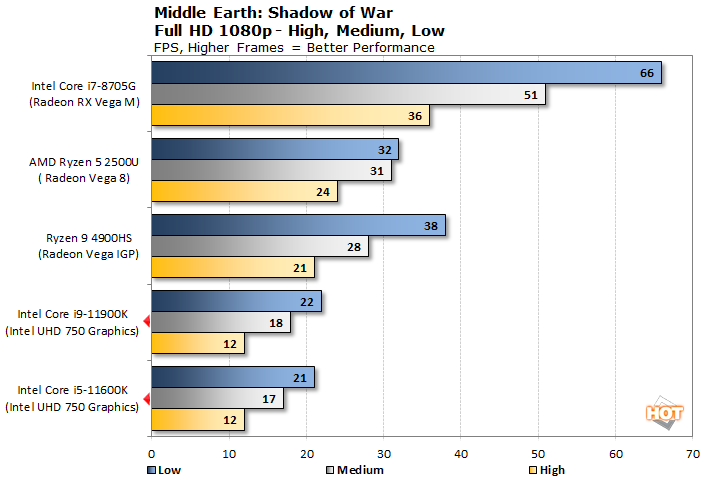
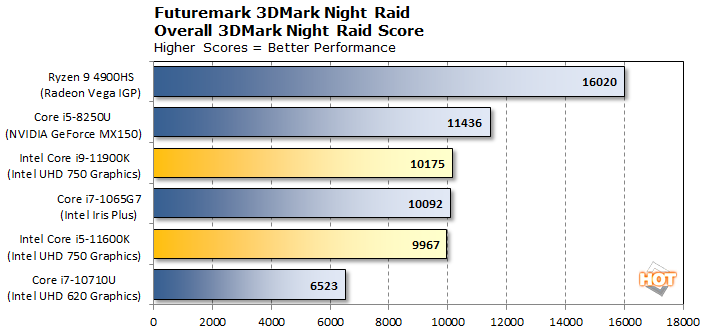
The Intel UHD 750 Graphics in new 11th Gen Core desktop processors is significantly faster than Intel's UHD 6x0 solution and is right about on-par with the 10th Gen Iris Plus graphics. The various Radeon IGPs were markedly faster, but the discrete NVIDIA MX150 was within striking distance.
|
We also spent some time overclocking the Core i9-11900K using the Asus Maximus XIII Hero motherboard and Corsair H80i v2, to see what kind of additional horsepower the processor had lurking under its hood...

Technically, overclocking a Core i9-11900K processor is similar to any other previous-gen Intel K-SKU processor from the last couple of generations. Because the 11900K is unlocked (like all K-SKUs), overclocking it is a matter of altering a few multipliers, tweaking voltages, and dealing with the additional heat and power requirements. These processors can be overclocked by adjusting BCLK frequencies as well, so it's possible to really fine tune the end result, but manipulating the multipliers is where the largest gains will typically come from.
Intel has introduced a large number of new features into its XTU, Extreme Tuning Utility GUI, as outlined on the slide above. In particular, there are a number of memory-related tools available, including a "Gear 2" mode with wider timings, which should allow for significantly higher frequencies than previous-gen Intel processors. In addition to the new features, however, just about all of the tools you'd use to overclock via the system's BIOS are also available in XTU.

Core i9-10900KS Overclocked To 5.3GHz All-Core
To ensure our results would repeatable by most consumers, we took a somewhat conservative approach to overclocking the Core i9-11900K using an off-the-shelf Corsair H80i AIO liquid cooler with the motherboard and processor installed in a mainstream NZXT mid-tower case, with a couple of intake and exhaust fans, though the side-panel was removed. That didn't really matter, however, because manual overclocking didn't yield any additional performance over and above what Intel's algorithms and hardware monitoring could using Adaptive Boost.

Core i9-11900K Sotck Clocks and Temps
In its stock configuration, the Core i9-11900K idled at around 38-40°C (give or take a coupe of degrees across the 8 cores) and peaked in the upper-80s. Enabling Adaptive boost didn't affect the peak temperature, but did result in more Power Limit throttling. And when we tried manual overclocking, our end results were typically just a hair better than what the system could do with Adaptive Boost. We tried a wide array of multipliers for individual cores, different voltages, BCLK adjustments, both with and without all-core sync and were unable to squeeze any significant additional performance from our chip. We tried ASUS' AI overclocking utility too. In the end, we stuck with the two best cores set to a 54x multiplier, with all of the rest at 51x. Pushing any further resulted in consistent instability. With these settings, we typically saw all-cores boost to ~5.1GHz.
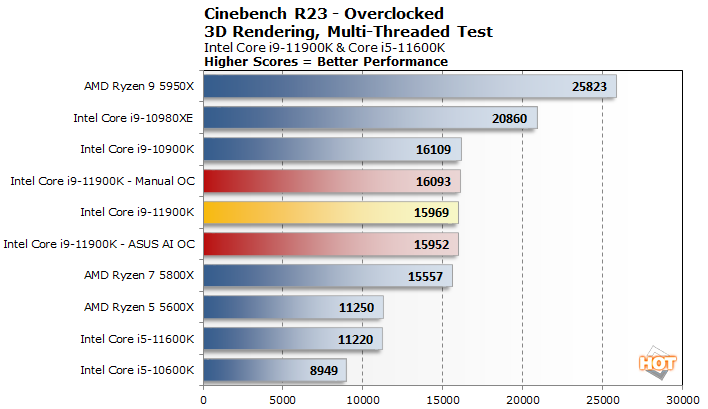
While we experimented with various overclocking settings we re-ran a few benchmarks and saw only minor performance improvements or flat performance overall. Intel -- at least with our particular chip -- seems to have wrung maximum performance from the Core i9-11900K. Achieving much more is going to require some seriously capable cooling.
|
Throughout all of our benchmarking and testing, we also monitored how much power our Intel 11th Gen-based rig was consuming with a power meter, versus the other systems we used for benchmark comparisons.
Our goal was to give you an idea as to how much power each configuration used while idling at the Windows desktop and while under a heavy CPU workloads across one and all cores. Keep in mind, this is total system power consumption being measured at the outlet and not the the individual power being drawn by the CPUs alone.
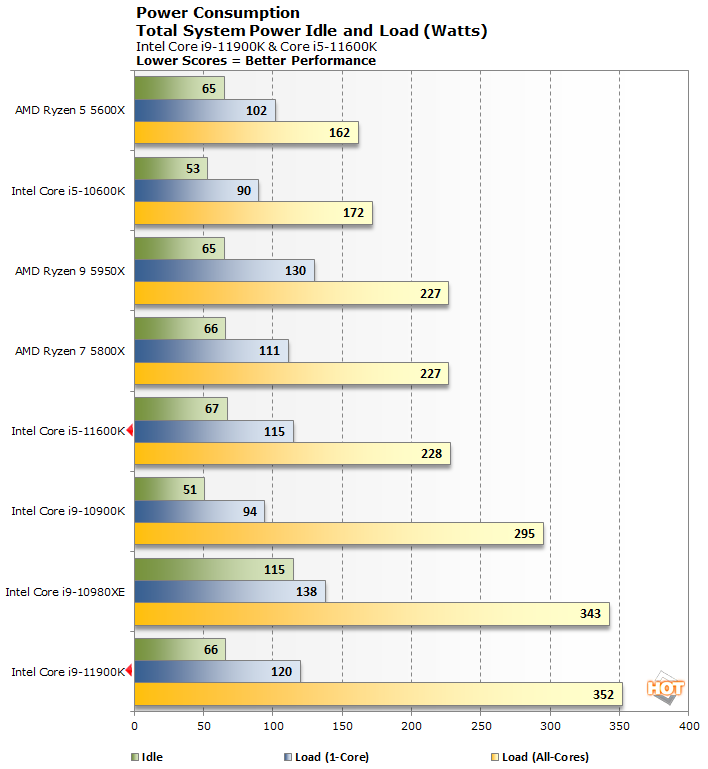
While the Core i9-11900K's peak power consumption isn't appealing in light of its overall performance relative to the competition, it is not so high as to be a major hindrance. Anyone considering a processor in this class is also likely to spring for adequate cooling, which will probably be quiet as well. That said, the chip's power consumption characteristics aren't pretty and how this processor can be rated for a 125W TDP is quizzical.
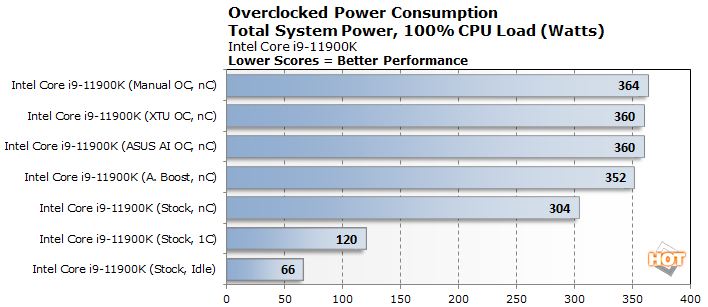
To provide a bit more data and insight, we also monitored power while overclocking and and using various settings with the Core i9-11900K. Disabling Adaptive Boost brought peak power down to 304 watts, which puts the 11900K just ahead of the Core i9-10900K, but that's with two fewer cores. All of the various overclocking tools we tried resulted in peak power within a few watts of each other.
A Closer Look At Core i9-11900K Frequency, Power And Thermal Characteristics

What Rocket Lake-S' new boost modes and power consumption characteristics do for frequencies and thermals, across a variety of workloads, is detailed in the plots above. What you're looking at (click for an enlarged version) are the actual frequencies, temperatures, and package power of the Core i9-11900K and Core i9-10900K, while they're burning through PCMark 10's various workloads, in their stock configurations. This data was captured with both processors in the exact same test machine -- the only difference is the processor itself.
As you can see, the Core i9-11900K is more aggressive about shifting though various frequency boost modes, though with fewer cores and some of the lightly threaded workloads on PCMark 10, that's not really a surprise. The Core i9-11900K's peak temperature is also about 5-7°C higher than the Core i9-10900K, but averaged out over the course of the workloads, it's not too different. Peak power is significantly higher though -- notice the 10900K plot tops out at about 260W, whereas the 11900K's plot goes over 350W.