ASUS ROG Zephyrus G15 Review: A Mighty Zen 3 Gaming Laptop
|
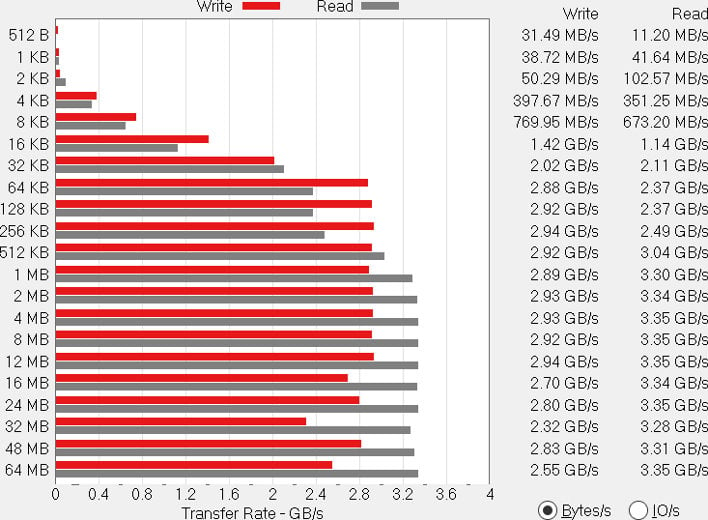
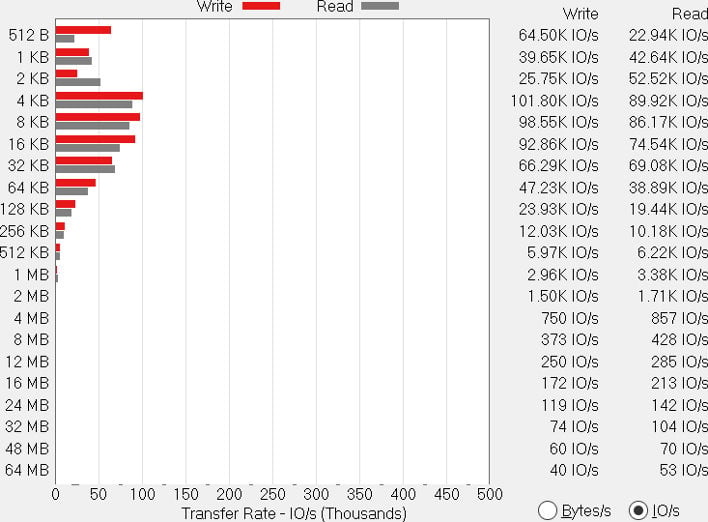
The drive in our sample was a Samsung P981a, which is a very popular and quite speedy NVMe SSD available in a variety of notebooks in the M.2 2280 form factor. The performance of this drive doesn't quite rival that of PCIe 4.0 drives that we've tested, but it does a very nice job providing fast sequential read and write speeds that push and exceed 3 GB per second. IOs at the 4 kB block top out at around 100k operations per second, which is also typical of notebooks that carry this drive.
For external USB testing, we used the Addlink S70 in an NVMe PCIe 3.0 x4 to 10 Gbps enclosure. Since the USB-C and USB-A ports on the Zephyrus G15 are all 10 Gbps ports, the drive performed similarly regardless of where we plugged it in.


As is the case with this drive when we've tested it on other systems, reads and writes top out at over 900 MB per second. That's less than one-third what the drive was capable of in an M.2 slot, but it's about as good as it gets for 10 Gbps USB 3.0. IOs also take a hit, but an M.2 drive in an external enclosure is plenty fast for something like a Steam games library drive. The system has a pair of M.2 slots internally, so we'd populate those first if you don't need to rely on external storage, but this is good for a third option.
|

Normally we would not include an ultraportable notebook in our gaming benchmarks, but you've got to look to Tiger Lake-based notebooks for web browser performance to rival the Zephyrus G15. The 35-Watt Ryzen 9 5900HS rivals the 28-watt Core i7-1185G7 in the MSI Prestige 14 EVO, and flat-out dominates everything else. The ASUS notebook was a full 20% faster than everything outside of Tiger Lake, which bodes well for lightly-threaded performance elsewhere. Turbo does almost nothing, but in a lightly threaded load we didn't expect much uplift. As long as the cooling system is doing its job, we don't figure the CPU-only benchmarks will benefit much at all, since there's ample thermal headroom without an 80 Watt GPU pumping heat into the cooler.
|
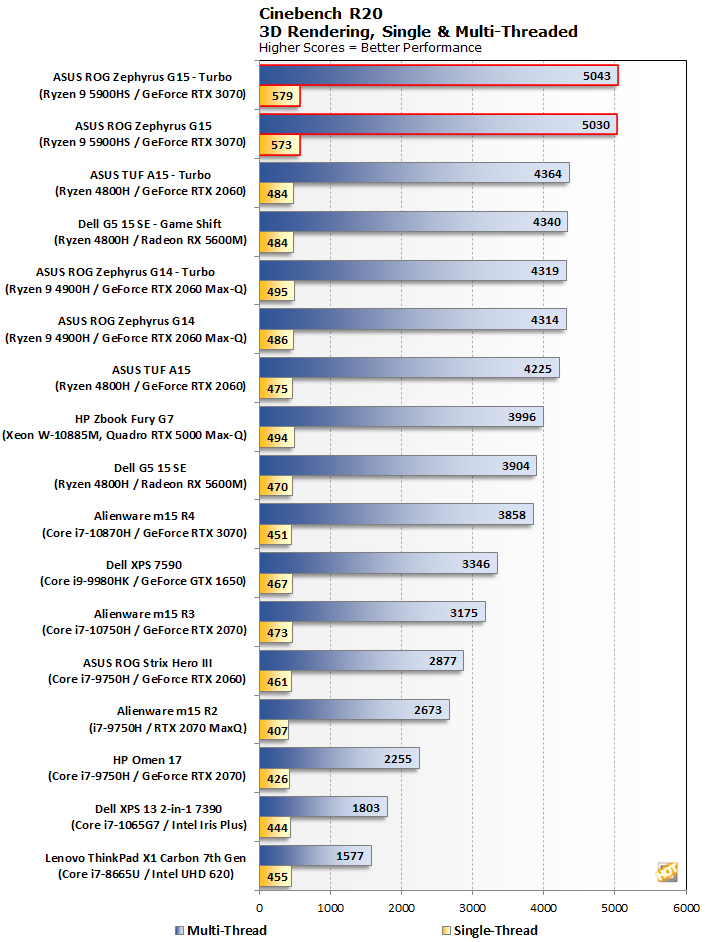
Cinebench has favored AMD's Zen-based processors in the past, but we're also seeing incredible 20% generational leaps between the Ryzen 9 5900HS and the previous-generation Ryzen 7 4800H with its larger 45-Watt thermal budget. Single-threaded and multi-threaded performance tell the same tale, where there's the ASUS ROG Zephyrus G15 and then there's everything else. The Ryzen 9 5900HS is really on a roll, and this system is the benefactor. As before, Turbo does little, even in multi-threaded mode. We'll expect more in the gaming benchmarks but this isn't a surprise in a CPU-only load.
The newest benchmark from Maxon, Cinebench R23, renders the same scene as R20 but with the company's latest rendering engine with support for all current gen hardware.
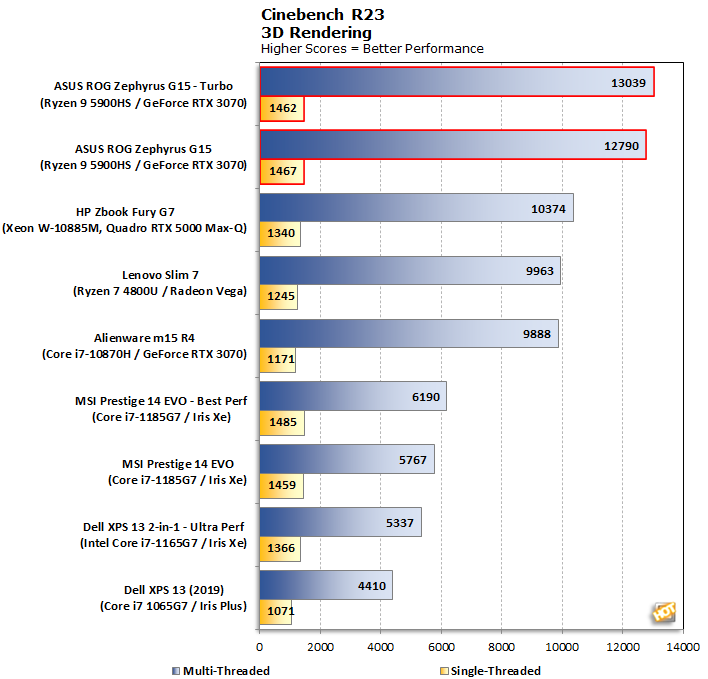
Once more, it's impressive how much faster the ROG Zephyrus G15 is than everything else. Due to the newness of the latest Cinebench, we have all our Tiger Lake-based ultra-portables on this chart, and Zen 3 notebooks are evenly matched with Tiger Lake. Remember that the Core i7-1185G7 in the Prestige 14 EVO is a 28-Watt part, so the two machines are on pretty even thermal footing. That notebook edges the Zephyrus on the single-threaded test by a whole percentage point, but then it just can't compete once we get to the multi-threaded tests where the Ryzen has eight cores and 16 threads thanks to SMT.
|
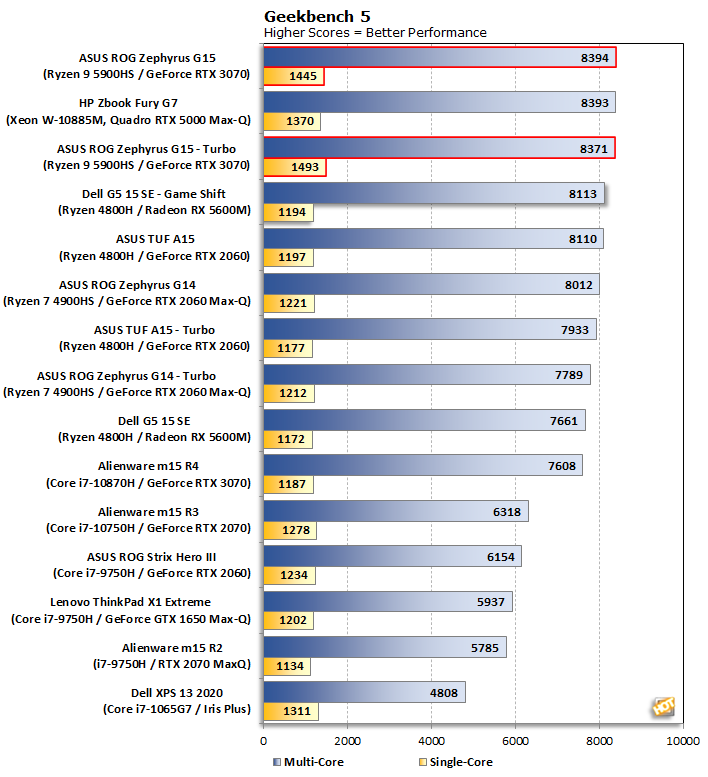
With eight full cores and great single-threaded performance, the ROG Zephyrus G15 once again cleans up. It's essentially tied with the Zbook Fury 15 G7 and its octo-core Xeon multi-threaded score, but the Ryzen's single-threaded performance is higher than everything else on this list. Zen 3 flies, which is nothing new, but it's a big deal in a gaming notebook where Intel doesn't currently have its Tiger Lake architecture available yet.
|
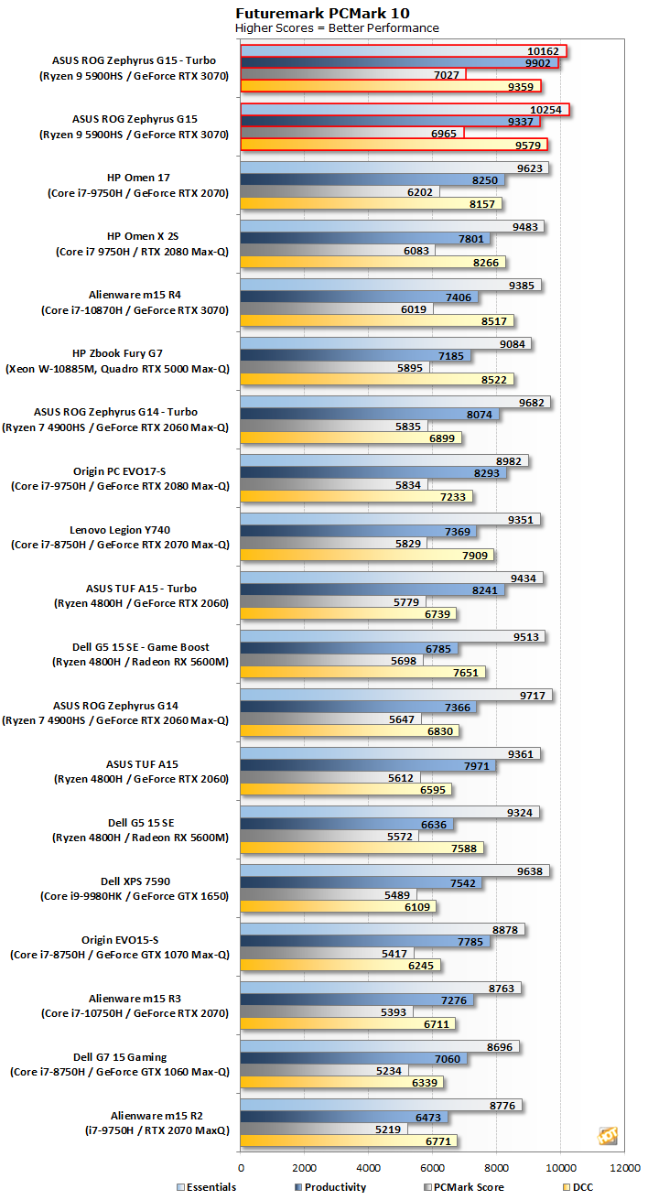
The ROG Zephyrus G15 is the fastest notebook we've ever tested in PCMark, without any contest. It beats out all of the other notebooks by a minimum of 10% in the overall score, and the notebook enjoys a similar lead in each of the subtests too. From a productivity standpoint, it just doesn't get any better than this ASUS notebook out of the models we've tested.
Now it's finally time to get down with some 3D graphics and gaming tests.
|

Outside of the Alienware m15 R4, the ASUS ROG Zephyrus G15 lines up somewhere between the fastest Turing-based notebooks and the Ampere-toting Alienware m15 R4. The higher 125-Watt thermal budget of the Alienware's RTX 3070 gives it a pronounced advantage, but the ASUS is not slow by any means.
Next up, let's take a look at the Extreme preset for the punishing 3DMark Fire Strike test. This DirectX 11 test has been around for a while, but it's still pretty challenging.
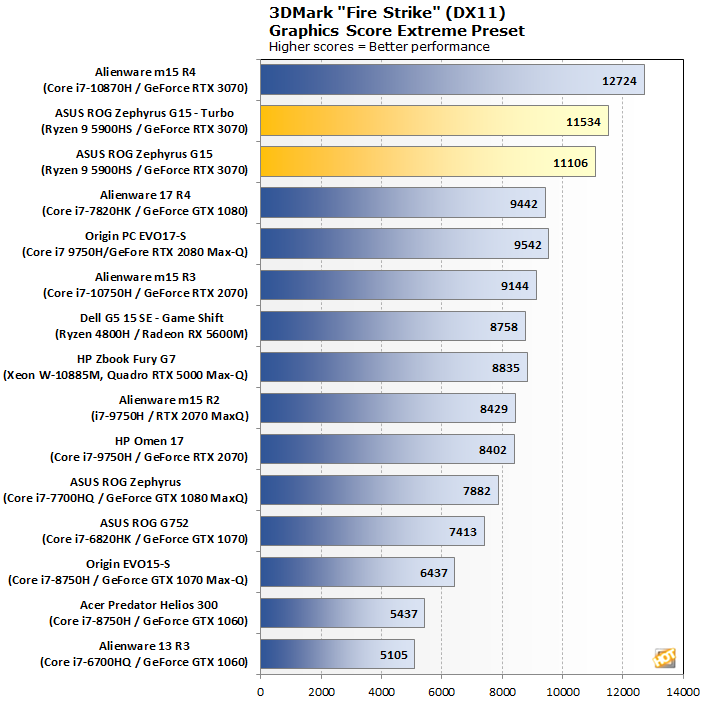
Once again, the ROG Zephyrus G15's performance bridges older designs to the higher-power Alienware. On its own merit, the notebook is among the fastest we've tested, and only loses out by around 7% from the top spot.
Lastly, the Port Royal test uses DirectX Ray Tracing (DXR) to illuminate a scene. So far, the only notebook GPUs that can power this benchmark come from the NVIDIA camp, since AMD's Big Navi graphics core architecture hasn't made it into a mobile platform yet.

The Ampere GPUs all pull away from Turing, with the ASUS ROG Zephyrus being around 15% faster than the last-gen GeForce RTX 2070 in the HP Omen 17. The difference between the Zephyrus and the Alienware is a much tighter nine percentage points, despite a much bigger difference in thermal budget. It seems ASUS made a good choice by sticking with a lower-powered variant of the RTX 3070.
|
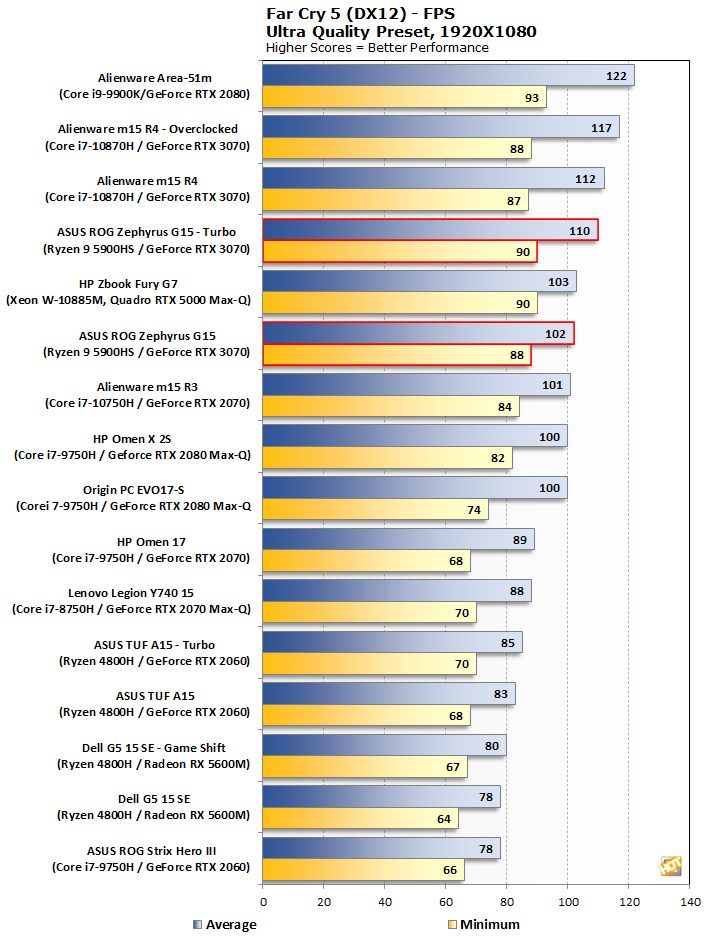
Our first true gaming benchmark shows good performance for the Zephyrus G15, but not the mind-blowing speeds of the Alienware. That's because of the relatively modest 80 Watt TGP of this iteration of the GeForce RTX 3070. Without DXR to process, the other top-end GPUs weave their way into the results. Regardless, over 100 fps in this title is more than playable, and it likely means that the native 1440p resolution would still push greater than 60 fps.
|
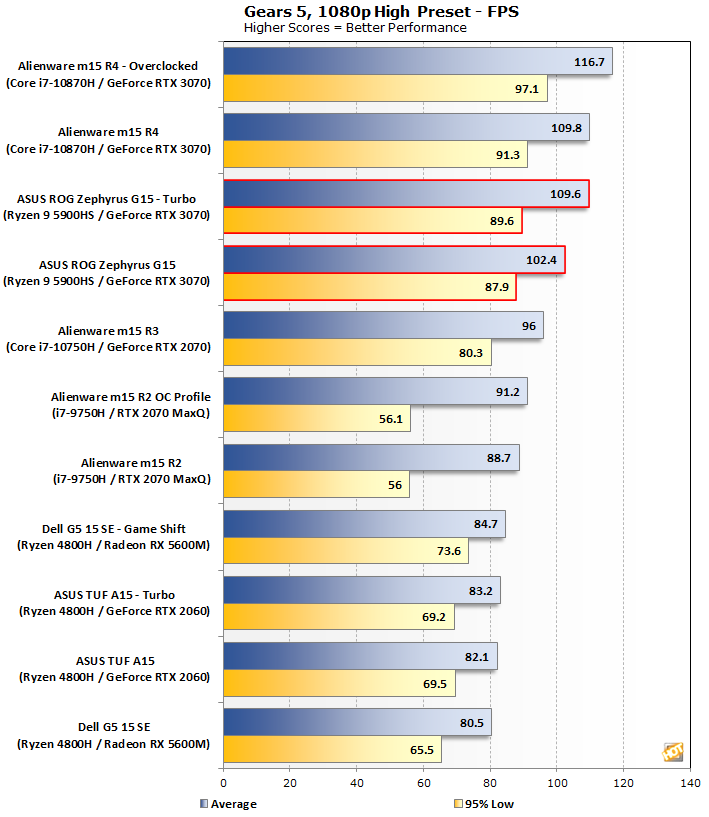
Gears 5's performance very much mirrors that of FarCry 5. In fact, the ASUS notebook's frame rates are nearly identical between the two games. We once again see a modest boost from Turbo that is almost enough to make up the difference between the Alienware and the ROG Zephyrus G15.
|

|

At this point, there's not much mystery. The ASUS ROG Zephyrus G15 trails the Alienware m15 R4 by a small but consistent amount, and the performance on its own merits is admirable, once again eclipsing 100 fps.
|

We start out with a 1440p resolution and the Ultra quality preset without any ray tracing effects enabled in this game. Without ray tracing, the Zephyrus G15 is essentially tied with the Alienware m15 R4 in Turbo mode. That turbo profile provides a big boost to performance, too, as it's nearly 15% faster than the default profile, which pulls in dead last. The frame rates at the native 1440p resolution of the Zephyrus's display are plenty playable either way, but the Turbo boost provides a tangible benefit.
However, since this GPU supports DXR and the game features extensive use of ray tracing, let's turn on the effects and also enable DLSS so that the frame rate is still somewhat playable.

Again we find that the Zephyrus G15's lighter thermal load causes it to trail the m15 R4, but it's a modest downshift. In both the minimum frame rate as well as the average, the Alienware's higher-power version of the GeForce RTX 3070 gets a modest but repeatable lead over the ASUS system. Turbo once again adds a bit of extra performance.
|
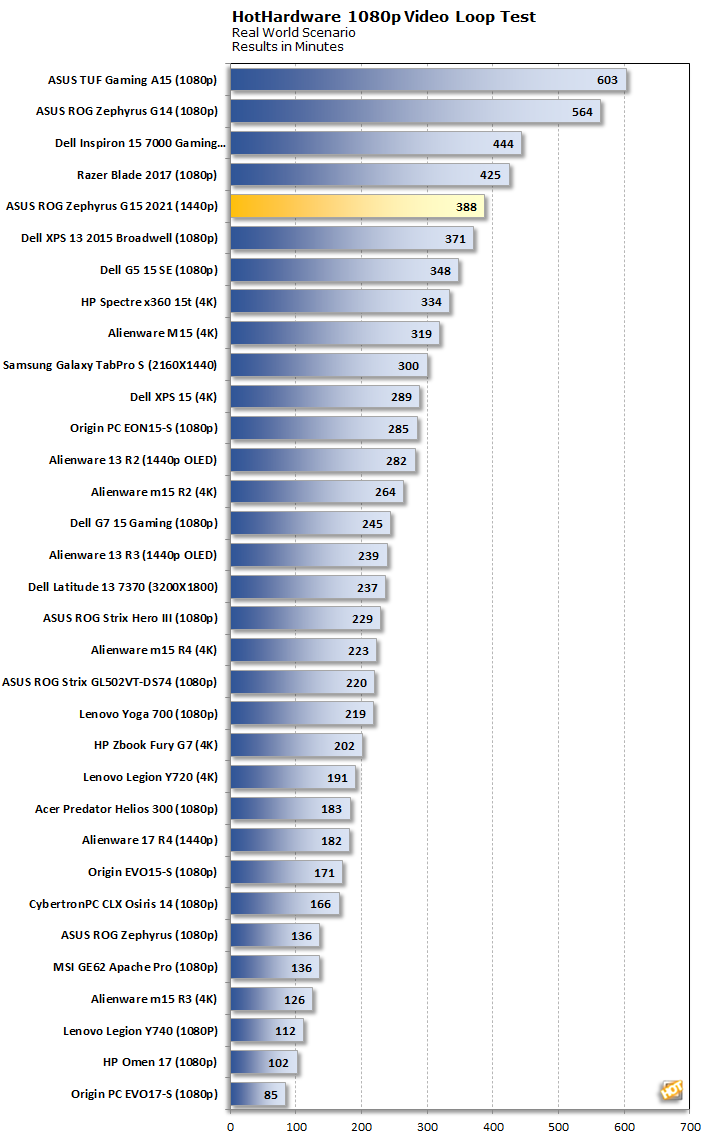
Battery life was extremely solid. Compared to the Alienware m15 R4, the Ryzen CPU has a lower TDP than the Core i7, and this notebook has a much lower GPU TGP. Overall, it draws less power so it's not a surprise it lasts longer. But just how much longer is impressive. We got more than six hours of video playback out of a gaming notebook, which is something we'd expect from much lower-power machines. The 90 Watt-hour battery no doubt has an effect on the system's longevity, but it lasted a full three hours longer than the Alienware m15 R4 and its similar spec. That notebook had to drive a 4K OLED display, however, and the 1440p workload is no doubt a little less strenuous.
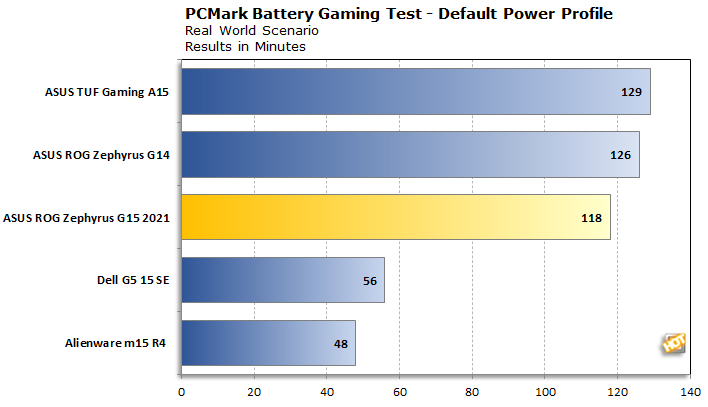
The PCMark 10 Gaming battery test was a very pleasant surprise. In fact, we had to run 3DMark Fire Strike just to be sure it wasn't relying on integrated graphics while on battery power. That was not the case, however, as the system scored over 8,000 in Fire Strike's Extreme preset on battery reserves, which is well within reason. So that means this system lasts nearly two full hours on battery while gaming. Performance is down quite a bit from the plugged-in frame rates we saw above, but that's to be expected when it's trying to conserve power.
Overall, the ASUS ROG Zephyrus G15 is a very speedy notebook with solid battery life. Now let's move on to the tear-down section and see how its thermal system keeps everything cool.