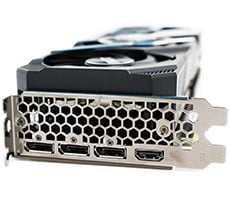
AMD Radeon Pro W5700 Review: Affordable Navi For Workstations
Futuremark’s VRMark is designed to test a PC’s readiness for the HTC Vive and Oculus Rift virtual reality headsets. The benchmark does not, however, require that one of the headsets is attached to the PC to run and it uses an in-house graphics engine and content to ensure comparable results between different platforms. We ran the "Blue Room" VRMark test at defaults settings here, which is currently the most taxing test offered by the tool.
|


The Quadro RTX 4000 clearly outpaces the Radeons here, but the Radeon Pro W5700 jumps out in front of the Radeon Pro WX 8200, by nearly 20%.
Superposition is powered by the UNIGINE 2 Engine. It offers an array of benchmark modes, targeting gaming workloads as well as VR, with both DirectX and OpenGL code paths. Unigine Superposition uses the developer’s unique SSRTGI (Screen-Space Ray-Traced Global Illumination) dynamic lighting technology, along with high quality textures and models, to produce some stunning visuals. We ran Superposition in its "VR Future" benchmark mode to compare the performance of all of the graphics cards featured here...


Superposition's VR benchmark tells the same story as VRMark. The Quadro RTX 4000 outruns both of the Radeons, but the Radeon Pro W5700 leads the previous-gen Radeon Pro WX 8200 by a wide margin.


None of these GPUs featured here are meant for gaming PCs, but developers will often need to assess performance of their projects (or just blow off some steam) so we ran 3DMark's DX12 "Time Spy" benchmark on them to see how they'd behave in a game-like scenario. Here, the new Radeon Pro W5700 finishes well out in front, outpacing both the Quadro RTX 4000 and Radeon Pro WX 8200 across the board.
|
|
|
Before bringing this article to a close, we'd like to cover a couple of final data points -- namely, power consumption and noise. Throughout all of our benchmarking and testing, we monitored acoustics and tracked how much power our test system was consuming using a power meter. Our goal was to give you an idea of how much power each graphics configuration used while idling and also while under a heavy workload. Please keep in mind that we were testing total system power consumption at the outlet here, not the power being drawn by the graphics cards alone.


