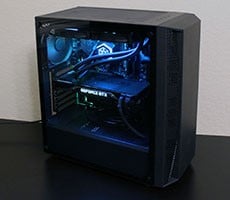
Digital Storm's Core i5 System Reviewed
One of the unique features Digital Storm claims it provides is the option to optimize Windows Vista (or Windows 7) performance. According to the company, this involves fine-tuning the services and processes running in the background of the operating system. In theory, this improves system speed and response time without compromising stability or functionality in any way. To be honest, it wasn't a claim we paid much attention to one way or the other initially, until we saw the PCMark Vantage scores below. In the graph, the "OEM" label refers to the performance of the Core i5-750 system when the OS has been reinstalled using the provided company restore discs. "Retail" refers to our performance results when the system was loaded with a retail version of Vista from a standard pressed disc. Both systems used identical drivers, hardware, and were fully patched.
Despite being identically patched and using identical drivers, our standard Vista install fell well short of the system's first score with an 8450. Multiple Windows reinstalls and OEM image installations confirmed that the 10.5 percent difference in PCMark Vantage was consistent. As for where the differences occur, the distribution is not random. PCMark Vantage's final score is calculated based on the system's performance in seven distinct categories. These are:
- Memories
- TV & Movies
- Gaming
- Music
- Communications
- Productivity
- HDD
Are The Optimizations Real?
In order to check against the possibility of some benchmark shenanigans, we installed and ran PC World's Worldbench 6, Beta 2. Although the finalized version of the benchmark shipped about a month ago, Beta 2 was the only release available for over two years. As such, it's been thoroughly vetted against several years of hardware and proven itself consistent and comparable over time. Unlike PCMark Vantage, which runs all of its tests within a customized shell, Worldbench relies entirely on standard desktop applications. This doesn't guarantee against some form of trickery, but it at least makes it less likely. Worldbench 6 returns an aggregate score measured against PC World's original baseline testbed, but also returns the individual times, in seconds, that it took a system to complete each application test.

Again, we see a performance gain of approximately 16 percent. If we break out the results of each individual application, the two OS installations track each other closely in virtually all cases; the second-largest gap is 6.8 percent in Roxio Videowave 1.5 percent. The OEM image only smashes our baseline install's performance in Worldbench's Nero 7 Ultra test.

There are three basic variables in play here. The performance differences we've seen could be the result of changes to the hard drive, customized driver optimizations, or changes to Windows and how it performs certain operations. We can throw the first out immediately—we have not changed hard drives, updated firmware, or changed default block sizes. The second remains a possibility, the third is the company's explanation. To be frank, we'd be happier if we'd been able to duplicate (or come within a reasonable margin of duplicating) the company's results based on the changes we've made to the OS environment.
So are the performance differences "real?" As far as we can tell thus far, yes. The degree of performance acceleration is consistent, we see it when particular types of operations are performed, and we've yet to uncover evidence that the company is somehow warping test results. Furthermore, these changes do not appear to have a downside. Over the course of testing this system we've copied, moved, pushed, pulled, and teleported hundreds of gigabytes of data across SATA, USB2, DVD, CAT6, and llama. The only troublesome part was the llama, which refused to haul data at 4.8GB/s. At no time did we encounter a problem or stability issue in performing these operations, and the actions in question never appeared to be occurring at abnormally slow rates.
At this point, we'd state—with considerable caution—that the results appear valid, which is to say that these numbers are reflected in reality, not merely within benchmark results. Even if Digital Storm had concocted a unique secret sauce to boosting performance (and the company makes no such claim), the results could still be accurate. If we find evidence to suggest anything to the contrary, you'll definitely hear about it.


