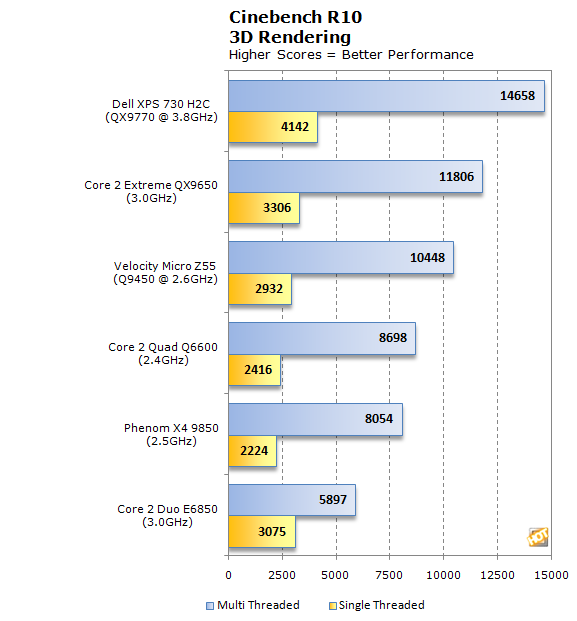
Cinebench R10 is an OpenGL 3D rendering performance test based on Maxon's Cinema 4D--a 3D rendering and animation tool suite used by 3D animation houses and producers like Sony Animation and many others. It's very demanding of system processor resources and is an excellent gauge of pure computational throughput.
 |
| Cinebench R10 |
| 3D Rendering |
|
This is a multi-threaded, multi-processor aware benchmark that renders a single 3D scene and tracks the length of the entire process. The final scores produced by each test system to render the scene is represented in the graph below.
The Edge Z55's performance in our second 3D rendering test was very similar to its performance in Kribibench. Once again, raw processing speed and the number of processor cores are the driving force of the processor-intensive test. The results for Kribibench and Cinebench should be a good indication of the kind of performance you can expect to see from CPU-bound applications as they start to become available with multi-threading support for four cores (or more).
 |
| Futuremark 3DMark06 CPU |
| Synthetic DirectX Gaming |
|
3DMark06's built-in CPU test is a multi-threaded DirectX gaming metric that's useful for comparing relative performance between similarly equipped systems. This test consists of two different 3D scenes that are processed with a software renderer that is dependent on the host CPU's performance. Calculations that are normally reserved for your 3D accelerator are instead sent to the CPU for processing and rendering. The frame-rate generated in each test is used to determine the final score.
We're beginning to sound like a broken record here, but 3DMark06's CPU test is also most-heavily influenced by raw processor speed and the number of processor cores. As such, once again the Edge Z55's quad-core 2.66GHz Q9450 readily outguns the 3GHz E6850 dual-core-based system.


