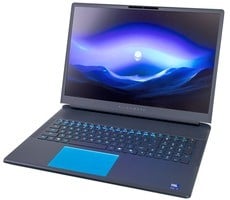
MSI Titan 18 HX AI Review: Monster Power For Gamers And Creators

MSI Titan 18 HX Gaming Laptop Benchmarks
Before running any benchmarks on a system, we apply all of the latest Windows and driver updates available for it. Our particular MSI Titan 18 HX AI sample shipped with Windows 11 Pro 24H2 and needed minimal updating, save for the latest Game Ready GeForce drivers, Windows Store updates, and some MSI Center related stuff. Other than applying those updates (like most consumers would), we run all of our tests with out-of-the-box settings. Our goal is to test the system as it ships, but after auto-updating, to accurately reflect what buyers can expect from a retail experience.
Like many other high-end gaming notebooks, however, the MSI Titan 18 HX AI adds an additional wrinkle. As we mentioned on the previous page, this machine gives users the option to configure the discrete GPU to operate in a hybrid mode (NVIDIA Optimus), which switches between the Core Ultra 9 285HX’s integrated Intel iGPU and the GeForce RTX 5090 dGPU depending on the workload, or in an always-on mode that keeps the GeForce powered up and directly connected to the display to provide the best performance. All of our benchmarks were run with the always-on discrete graphics mode enabled. This will show optimal performance in most benchmarks, but worst-case scenario battery life and thermals.
Like many other high-end gaming notebooks, however, the MSI Titan 18 HX AI adds an additional wrinkle. As we mentioned on the previous page, this machine gives users the option to configure the discrete GPU to operate in a hybrid mode (NVIDIA Optimus), which switches between the Core Ultra 9 285HX’s integrated Intel iGPU and the GeForce RTX 5090 dGPU depending on the workload, or in an always-on mode that keeps the GeForce powered up and directly connected to the display to provide the best performance. All of our benchmarks were run with the always-on discrete graphics mode enabled. This will show optimal performance in most benchmarks, but worst-case scenario battery life and thermals.
ATTO Disk Benchmark
We'll start off the barrage of benchmarks with ATTO. The ATTO disk benchmark is a fairly quick and simple test which measures read/write bandwidth and IOPS across a range of different data sizes. While we don't typically compare these results across multiple machines, it's useful to gauge whether a particular notebook's storage subsystem is up to snuff.The triple Samsung NVMe Gen 4 RAID 0 drive setup (3 x 2TB) in the particular Titan 18 HX AI configuration we tested put up some big numbers, laptop or otherwise. Reads peaked at over 15GB/s with maximum write speeds in the 8.3GB/s range. While big numbers are always fun to see, we'd prefer a single PCIe Gen 5 drive (perhaps something based on the Phison E28) for the OS, with a companion Gen 4 drive for secondary purposes. While RAID 0 can be great for sequential transfers, if any one of the three drives fails, the whole array will go down and be unrecoverable.
Speedometer 3 Browser Benchmark
We use BrowserBench.org's Speedometer test to take a holistic look at web application performance. This test automatically loads and runs a variety of sample web apps using the most popular web development frameworks around, including React, Angular, Ember.js, and even plain-Jane JavaScript. This test is a better example of how systems cope with real web applications versus a more compute-focused JavaScript test like JetStream. All tests were performed using the latest version of Chrome.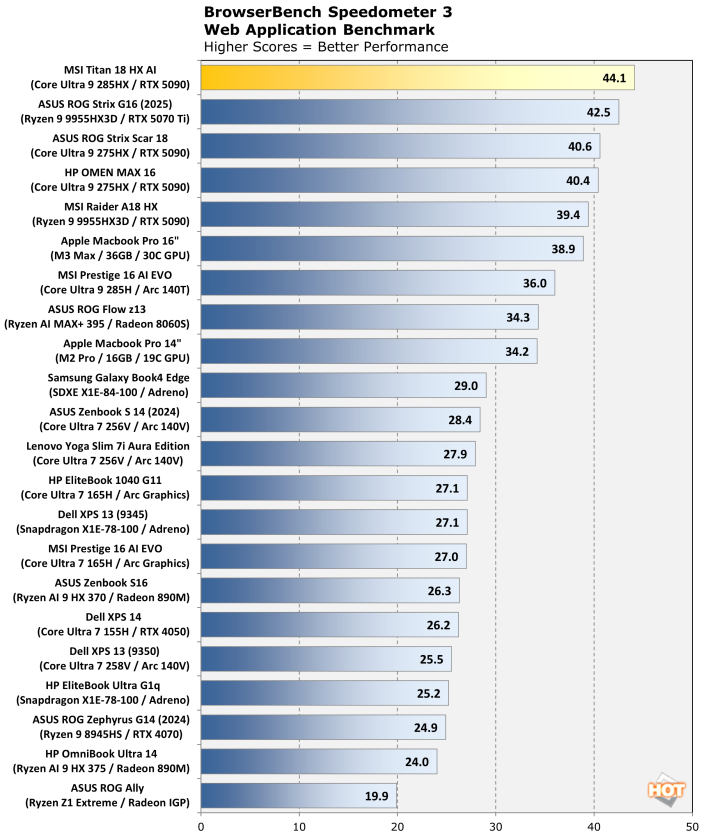
The MSI Titan 18 HX AI's Core Ultra 9 285X put up the best score we've seen from a notebook in the Speedometer 3 browser benchmark. Since the Ultra 9 285HX is essentially a desktop CPU in mobile clothing, it's no surprise to see such high performance here.
MAXON Cinebench 2024 3D Rendering Benchmark
Next up is the latest-generation 3D rendering benchmark from Maxon, based on the Cinema 4D rendering engine. It's a purely CPU-based test that doesn't make use of the graphics processor at all, and it scales very well with additional CPU cores. We ran both single- and multi-threaded tests on all of the machines in the charts.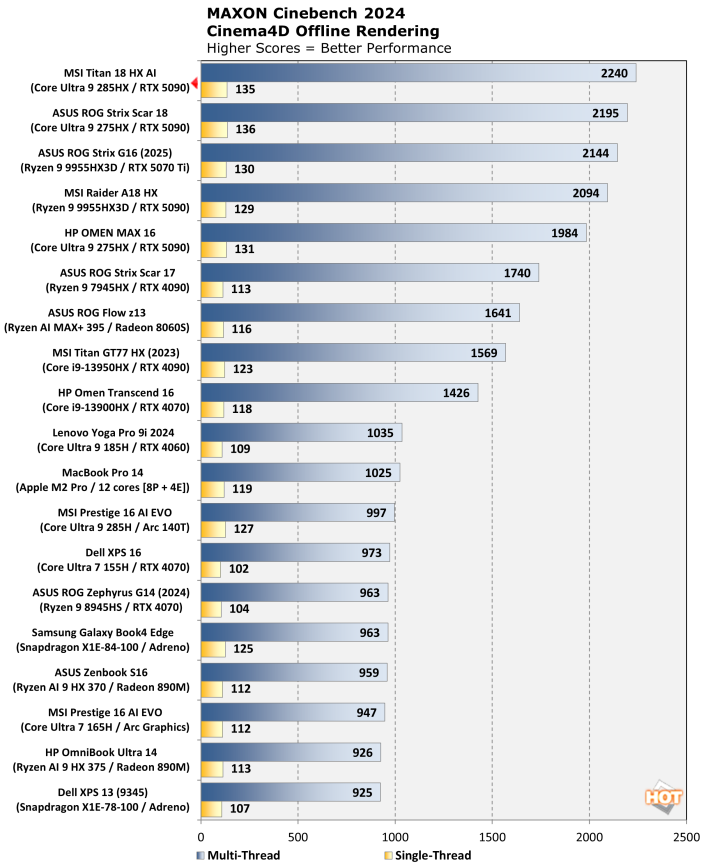
Once again, we see the MSI Titan 18 HX AI coming out on top in Cinbench 2024. The capable cooling system and relatively large volume of the MSI Titan 18 HX AI let its CPU run as well as can be expected in a laptop form factor, and as such, the MSI Titan 18 HX AI take the pole position—at least when sorted by multi-threaded scores. Technically. the MSI Titan 18 HX AI lands in second place in terms of single threaded performance here, but by a delta of only 1 point, which falls well within the margin of error for this benchmark.
Geekbench 6 CPU Performance Benchmark
Geekbench is a cross-platform benchmark that simulates real-world workloads in a wide variety of tasks, including encryption, image processing, physical simulation, machine learning, and many more. We tested the systems featured here with the latest Geekbench 6 version to get an idea of their overall system performance.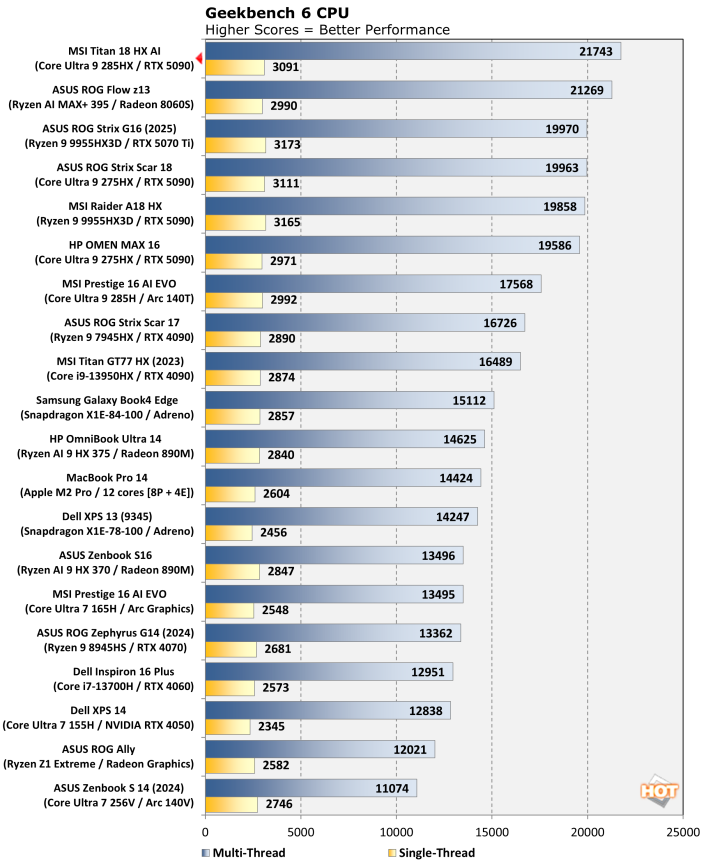
In Geekbench, we actually have a new record for multi-threaded performance in a laptop. The MSI Titan 18 HX AI once again takes the top spot, besting every other notebook we tested. Like we saw with Cinebench though, single-thread performance, while very good, didn't lead and the system actually trailed an Asus system built around the Core Ultra 9 275HX and a couple of AMD-based systems.
Geekbench AI Machine Learning Benchmarks
The Geekbench AI benchmark provides a straightforward look at how well a device handles a variety of AI-assisted tasks. This quick and easy test gives you a numerical snapshot of the CPU, GPU, and NPU's ability to power through real-world machine learning workloads, factoring in both speed and accuracy. The higher the score, the better the device's AI chops, whether it's image recognition, object detection, or natural language processing.Results are presented in three levels of numerical precision: single precision or FP32, half precision or FP16, and quantized or INT8. All results that the benchmark provides are geomean scores from multiple runs of each test workload.
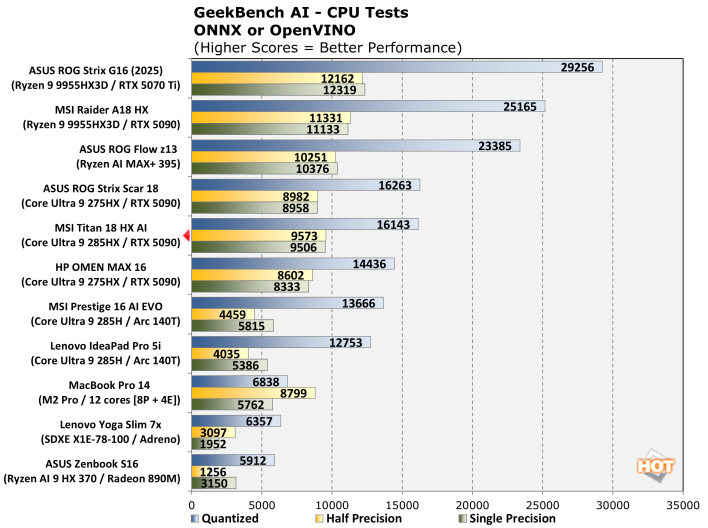
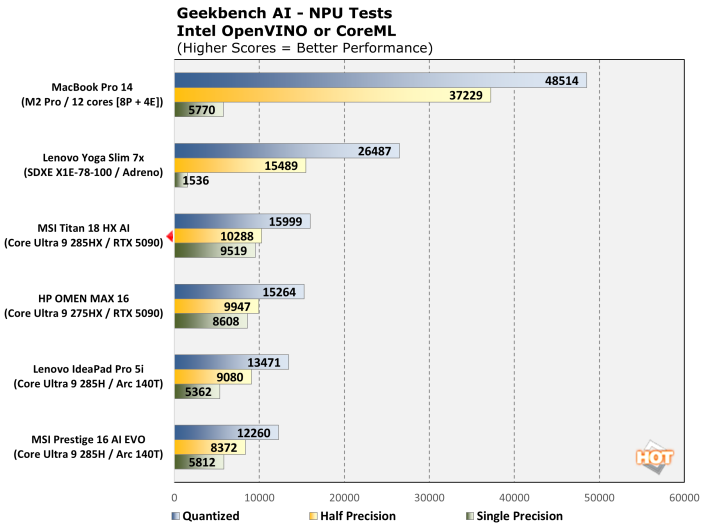
In the CPU tests, we see the MSI Titan 18 HX AI landing in between a couple of other Intel Core Ultra 9 powered gaming laptops we've previously tested, but well behind the AMD Ryzen 9 9955HX3D based systems. There's just no substituting for 16 full-fat Zen 5 cores and their AVX-512 acceleration with this workload. In terms of NPU performance, the MSI Titan 18 HX AI's Core Ultra 9 285HX just edges out a 275HX-based HP system, but the NPU on Arrow Lake isn't beefy enough to catch the likes of Apple or Qualcomm.
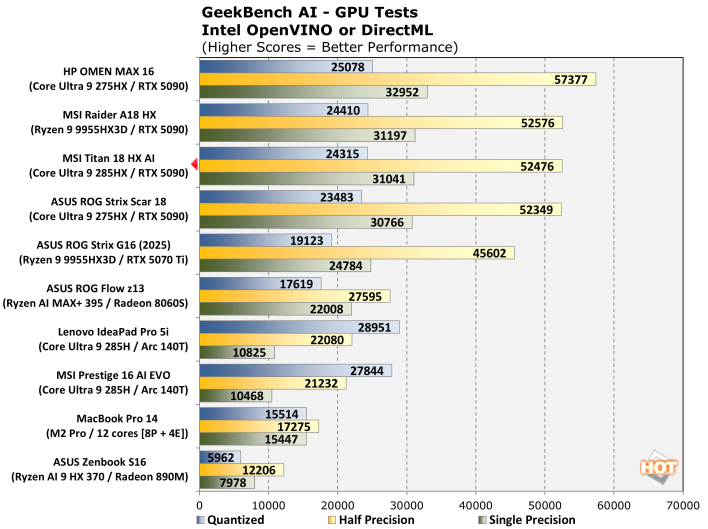
In GPU-based AI, we see the MSI Titan 18 HX AI and its powerful GeForce RTX 5090 right in the mix with other systems featuring the same GPU, save for the HP Omen which performed particularly well in the Half Precision test.
UL PCMark 10 Productivity Benchmark
The standard PCMark 10 benchmark uses a mix of real-world applications like OpenOffice and Zoom as well as simulated workloads to establish how well a given system performs productivity and content creation tasks, including (but not limited to) image and video editing, web browsing, teleconferencing, document creation, and so on. We ran it on all these machines to see which one is the best for creative work.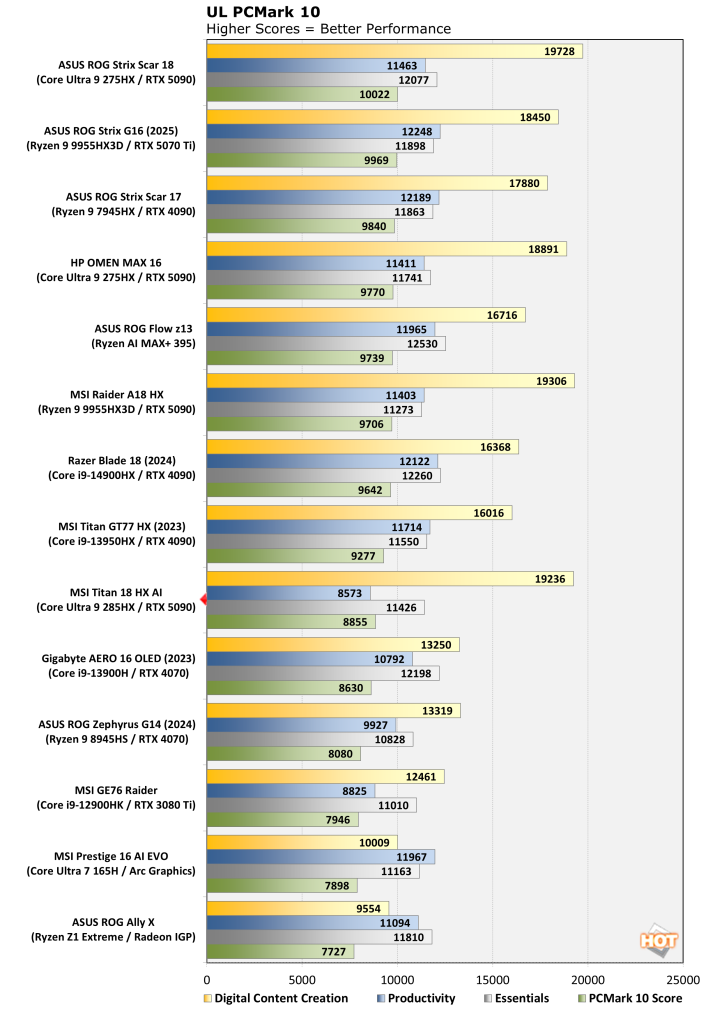
The MSI Titan 18 HX AI landed about in the middle of the pack in the default PCMark 10 test, which is somewhat lower than expected. We suspect the RAID 0 storage setup and slightly lower single-threaded performance we've seen from the system held it back here. RAID 0 configurations often exhibit slightly higher latency than single drives and lower single-threaded performance will impact the majority of PCMark's sub-tests, save for DCC, where the MSI Titan 18 HX AI actually finishes in second place.
UL PCMark Applications Office Benchmarks
We've started using the PCMark 10 Applications benchmark a bit more because it measures performance in Office and Edge using native instruction set-compatible versions of the apps for optimal performance across both x86 and Arm architectures. The following results should paint a picture of performance with the best foot forward from all systems tested.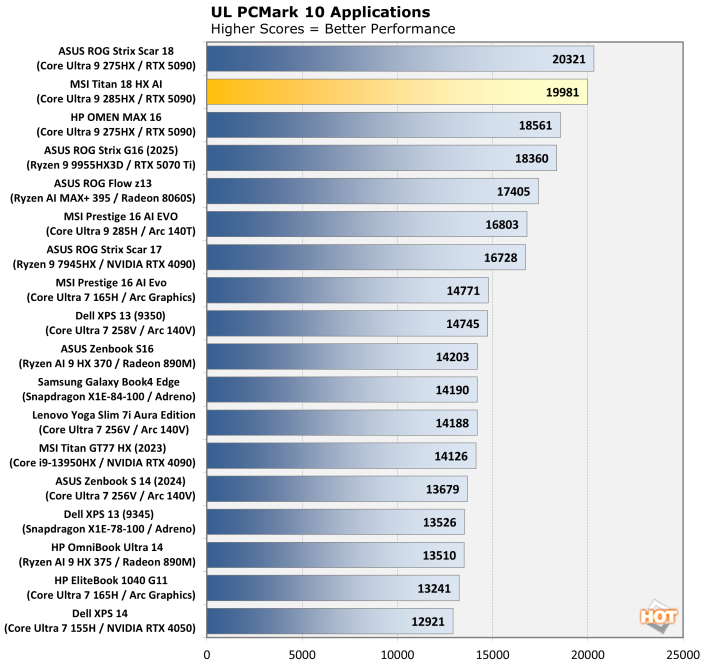
In the PCMark 10 Applications test, we see the MSI Titan 18 HX AI land in second place, behind the HP system packing a Core Ultra 9 275HX. The delta separating the machines is very small though, and obviously all of the systems represented here will have no trouble running Microsoft Office applications.
UL 3DMark Synthetic Gaming Benchmarks
3DMark has a wide variety of graphics and gaming related tests available. To best match up with the historical benchmark data that we have hanging around, we ran the Fire Strike Extreme QHD DirectX 11 benchmark, the Time Spy QHD DirectX 12 benchmark, and the Port Royal DXR ray-tracing benchmark. First up: Fire Strike Extreme: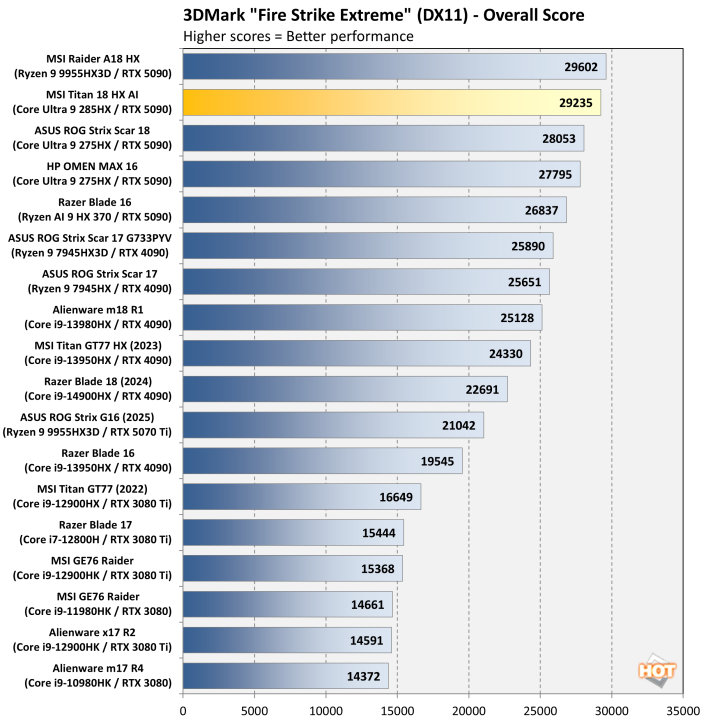
In the senior 3DMark Fire Strike test, we see the MSI Titan 18 HX AI taking silver, behind only a similar MSI Raider 18" notebook packing and AMD Ryzen 9 9955HX3D.
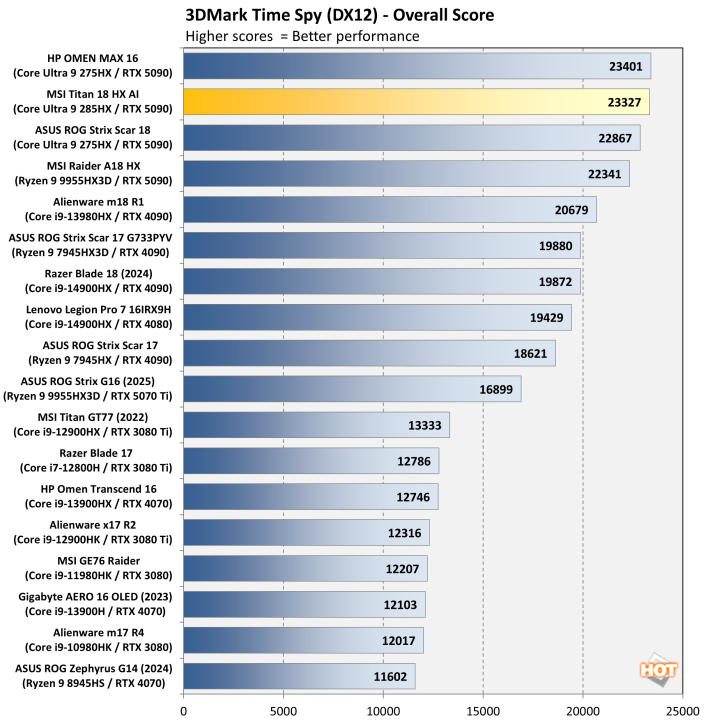
In Time Spy, the GeForce RTX 5090-powered MSI Titan 18 HX AI takes second place once again, this time finishing behind the HP Omen Max 16, also featuring a Core Ultra 9 processor and RTX 5090. The difference here is margin-of-error, so fundamentally, "two 175W GeForce RTX 5090 Laptop parts perform identically" isn't really a revelation.
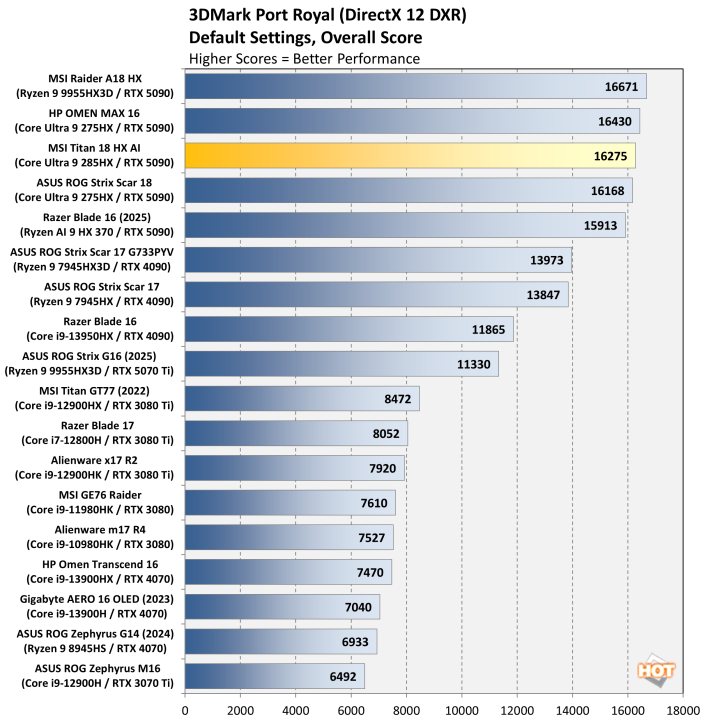
The Port Royal benchmark is about as close as you can get to a pure ray-tracing benchmark, so the biggest, current-gen GPU will always come out on top. Here, the MSI Titan 18 HX AI takes the bronze, finishing slightly behind a couple of other systems outfitted with the GeForce RTX 5090.
Middle-earth Shadow of War Benchmarks
Middle-earth: Shadow of War is a fun and beautiful title set in J.R.R. Tolkien's Lord of the Rings universe. To test the game's performance relative to other systems, we set the visuals to the High preset and tested in both 1080p and 2560×1440. The frame rates here are the average reported by the built-in benchmark.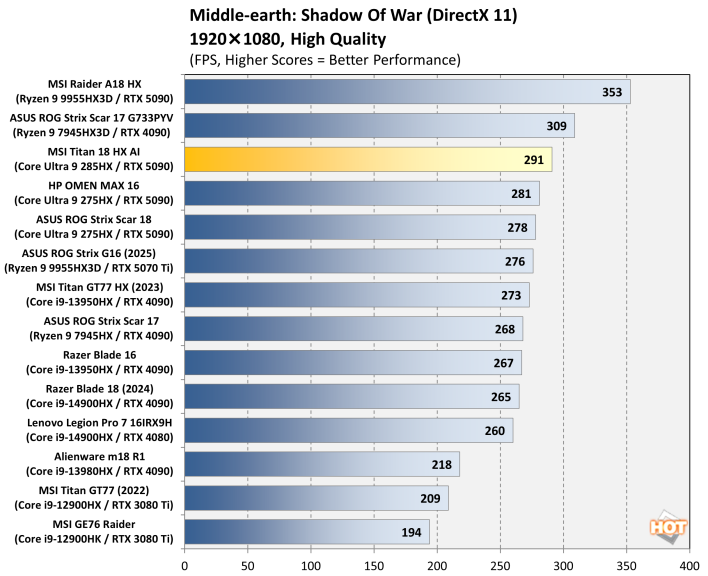
Middle-Earth: Shadow of War in 1080p isn't a workout for systems of this class. Here, we see the MSI Titan 18 HX AI and its GeForce RTX 5090 landing in third place, behind a couple of AMD Ryzen X3D-based machines. For CPU bound gaming workloads, that massive complement of L3 cache boosts gaming performance significantly and the Core Ultra 9 / RTX 5090 can't quite catch up.
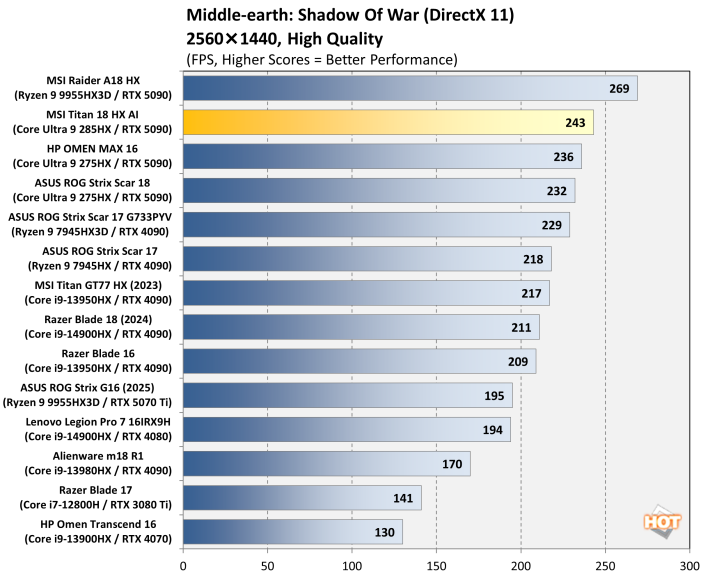
Stepping up to QHD resolution increases the workload on the GPU by nearly double, and the MSI Titan 18 HX AI creeps up a notch. As you'll see, in real-world gaming scenarios, there's just no catching the Ryzen 9 9955HX3D, when similar GPUs and power envelopes are also used.
Shadow of the Tomb Raider Benchmarks
The finale in the rebooted Tomb Raider trilogy, Shadow of the Tomb Raider is easily the best-looking of the bunch. It's also brimming with fancy tech, including all three vendors' smart upscalers, ray-traced shadows, and even Tobii eye-tracking support. To test this game out, we turned the visuals up to their highest preset and tested at 1080p and 2560x1440.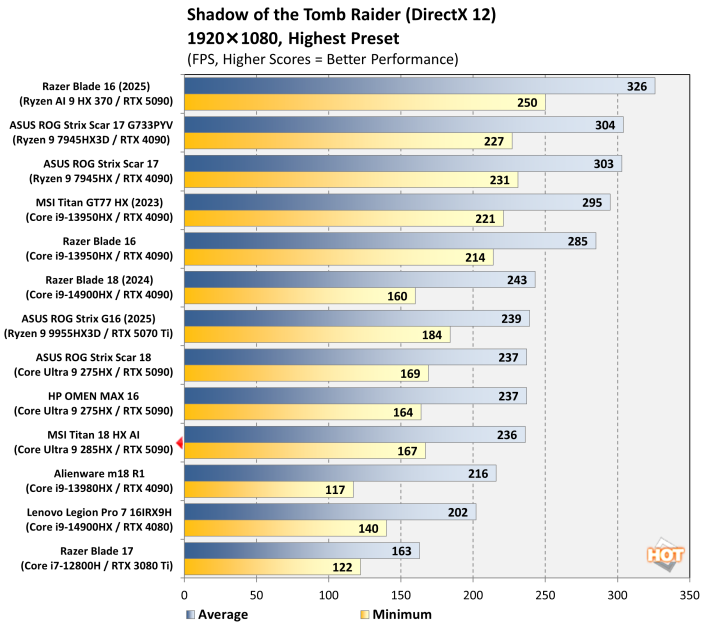
Shadow of the Tomb Raider doesn't run particularly well on Arrow Lake when it's mostly CPU bound. Here, the MSI Titan 18 HX AI is tightly clustered with other Core Ultra 9-based machines, in the bottom half of the graph.
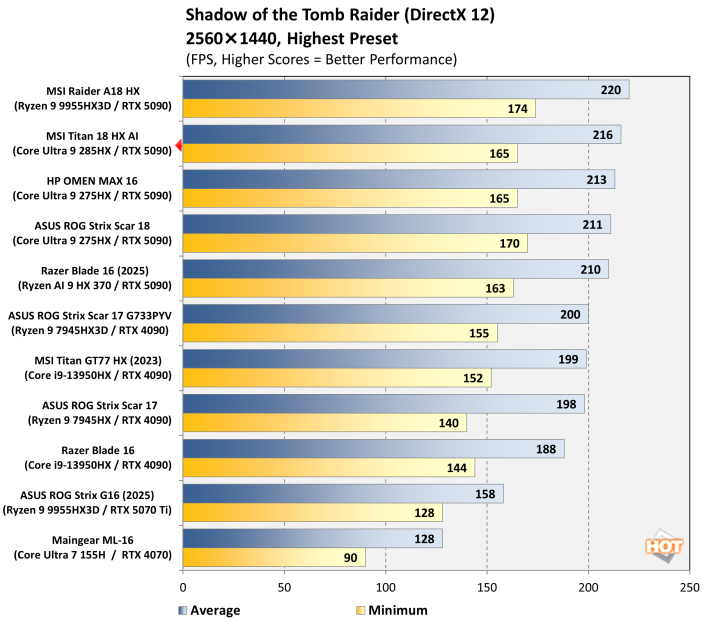
When cranking things up to QHD resolution, the story is somewhat different. Framerates decrease by a few percentage points, but the GeForce RTX 5090 in the MSI system is able to muscle its way past previous gen GPUs and the Titan 18 HX AI lands in second place.
F1 24 Formula One Racing Benchmarks
The previous iteration of Codemasters' annual officially-licensed F1 racing game carries forward the gorgeous custom ray-traced global illumination (RTGI) solution from F1 23 while improving texture quality and performance across the board. Many environmental objects have had their detail improved, and the tracks look a lot more like their real-world versions in this release, especially after a major graphics patch back in December 2024.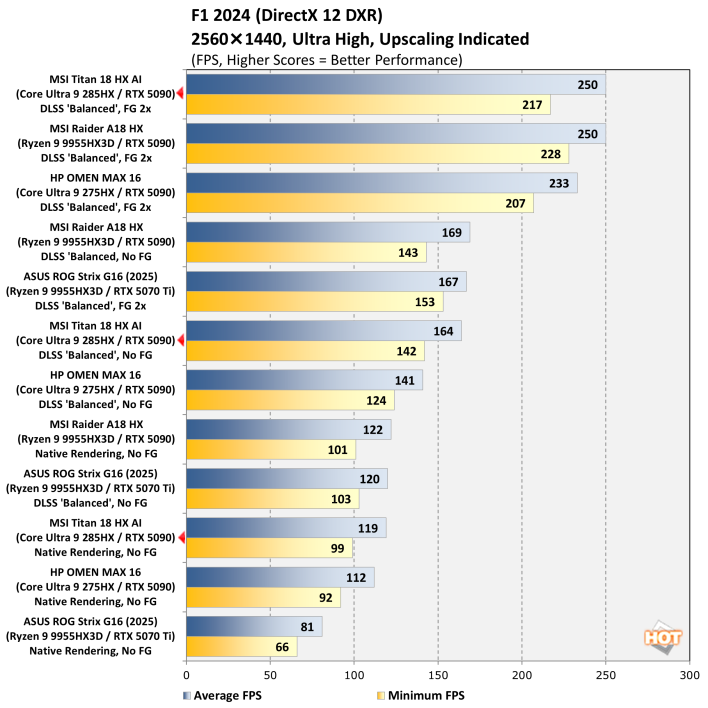
We also wanted a test to demonstrate the benefits of NVIDIA's DLSS technology in terms of performance, and F1 24 presents the perfect opportunity to do so. We stuck to comparing systems with Blackwell GPUs because it was the most apples-to-apples comparison given that the Blackwell architecture performs frame generation in a different manner than the older Ada Lovelace architecture from the RTX 40 series.
In these tests, the MSI Titan 18 HX AI and its GeForce RTX 5090 are right in the mix with some of the fastest gaming laptops we've ever tested. Its minimum framerates trail the Ryzen 9 9955HX3D-based systems, but average framerates are among the best at all settings.