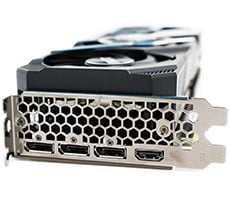
AMD Radeon R9 Fury Review: Fiji On Air Tested
Our test system this time around is based on Intel’s X99 platform, built up with an Intel Core i7-5960x and 8GB of G.Skill DDR4 Ripjaws RAM running at 2400MHz, on top of an ASUS X99-Deluxe motherboard. All of our benchmark tools and games are launched from a Samsung 850 EVO SSD, and we’re running a fresh and fully updated version of Windows 8.1.
To ensure maximum performance, we loaded up clean installations of AMD’s Catalyst 15.15.1004 and NVIDIA’s GeForce 353.30 drivers (note that due to a significantly reduced review window, we were unable to test the Fury using AMD’s recently released Catalyst 15.7 WQHL drivers). All cards included in our benchmarks were retested using these newer drivers since both AMD and NVIDIA frequently massage a bit more performance out of their hardware with each new revision.
In terms of actual Fury cards tested, our review only includes results and analysis for Sapphire’s overclocked Tri-X version, as Asus was unable to deliver a sample in time for thorough testing. However, you can expect future impressions of their Strix implementation from the team here at HotHardware.
|
|
|
| Hardware Used: Intel Core i7-5960X (3.0GHz, Eight-Core) ASUS X99-Deluxe Sapphire Tri-X R9 Fury Radeon R9 Fury X Radeon R9 390x GeForce GTX 980 GeForce GTX 980 Ti 8GB Corsair DDR4-2400 |
Relevant Software: Windows 8.1 Pro x64 DirectX Redist AMD Catalyst v15.15.1004 NVIDIA GeForce Drivers v353.30 Benchmarks Used: Unigine Heaven v4 3DMark "Fire Strike" Tomb Raider Middle Earth: Shadow of Mordor Metro: Last Light Redux Grand Theft Auto V |
|
|
|
While no synthetic test can give us as accurate a performance picture as real gaming, Fire Strike remains a reliable gauge of a video card’s potential and a strong reflection of its place in the competitive landscape.
Let’s break down these results with some illuminating percentages. The Fury is 16% faster than the GTX 980 for 10% more cost, but only 8% slower than the 980 Ti for 15% less money. And the kicker? It only lags behind the Fury X by 5% with a $100 price gap between them.
The picture gets even brighter as we ramp up to Fire Strike Ultra, with the Fury coming in 18% faster than the 980, and only 5% slower than the 980 Ti. Let’s see if this turns into a trend.


