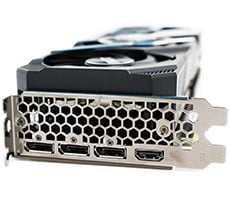
BFG's GTX 295 H2OC: Water-Cooled Graphics
We'd like to cover a few final data points before bringing this article to a close. Throughout all of our benchmarking and testing, we monitored how much power our test systems were consuming using a power meter. Our goal was to give you an idea as to how much power each configuration used while idling and under a heavy workload. Please keep in mind that we were testing total system power consumption at the outlet here, not just the power being drawn by the motherboards alone.
Understanding Peak Power
Most of the time, editors and testers reference a product's idle power (aka, the power it consumes when doing nothing, but outside any sort of sleep state) and its load power. Video card power consumption figures are usually tested by use of whatever game the reviewer feels best does the job—do a bit of data gathering, and you'll often find that the figures average out pretty evenly across multiple titles. Often, however, does not mean always. There are specific feature tests in 3DMark 2006 that create what appear to be near-worst-case scenarios for both ATI and NVIDIA cards. For NVIDIA, the first pixel shader test in 3DM2K6 is a worst-case scenario, while the Perlin Noise test in that same benchmark is ATI's thermal Achilles heel. Without an easy way to fold these numbers into existing metrics, we list them separately as "Peak" power.
|

There's not much new here, save for the addition of peak power data. If you flip back to the temperature difference we saw between load and peak, you'll see its mirrored here in the relative power consumption of each mode.


