Intel NUC 11 Extreme SFF PC Review: Unleashing Beast Canyon
Intel’s Visual BIOS can be navigated using either a mouse or keyboard (or touch if you’ve got a compatible display), and i'st home to array of information about the processor and memory configuration, as well as other system specifics and hardware-health data.


Intel NUC 11 Extreme Beast Canyon BIOS Menus
All of the integrated peripherals can be enabled / disabled from within the Visual BIOS, fan curves can be tweaked should you want to dial-in a specific thermal and acoustic profile, and there are a handful of power related options available, should you want to fine-tune the system’s power characteristics, which in turn will affect the system's performance.
For our testing, after updating, we left the NUC 11's BIOS at its optimal defaults, which has max performance mode enabled. For all intents and purposes, the Beast Canyon NUC 11 Extreme’s BIOS is designed for enthusiasts, and it mimics what Intel used to offer in its full-sized HEDT motherboards, minus a few advanced overclocking-related options.
Because the NUC 11 Extreme is a small-form-factor machine powered by a mix of mobile and desktop hardware, figuring out exactly where it fits in terms of performance presents some challenges. As such, to paint as clear a picture as possible, we decided to compare its performance to an array of mobile machines, desktop systems, and previous-gen NUCs where we had data available....
SiSoft SANDRA 2021 Benchmarks
We began our testing with the latest version of SiSoftware's SANDRA 2021, the System ANalyzer, Diagnostic and Reporting Assistant. We ran two of the built-in sub-system tests that partially comprise the suite with the NUC 11, CPU Arithmetic and Multimedia.


| Intel Core i9-11900KB Processor Arithmetic |
Intel Core i9-11900KB Multi-Media |
SANDRA's CPU Arithmetic benchmark shows Core i9-11900KB jumping out to a big lead over previous-gen Intel H-series processors, with an aggregate score of about 294.1GOPs. The same holds true in the Multi-Media test as well, where the NUC 11 Extreme puts up an aggregate score just shy of 1GPix/s.
Speedometer 2.0 Browser Benchmark
We recently moved on to BrowserBench.org's Speedometer test, which takes a holistic look at web application performance. This test automatically loads and runs several sample webapps from ToDoMVC.com using the most popular web development frameworks around, including React, Angular, and Ember.js. This test is a better example of how systems cope with real web applications, as opposed to a pure JavaScript compute test like JetStream. All tests were performed using the latest version of the Chromium-based Edge browser.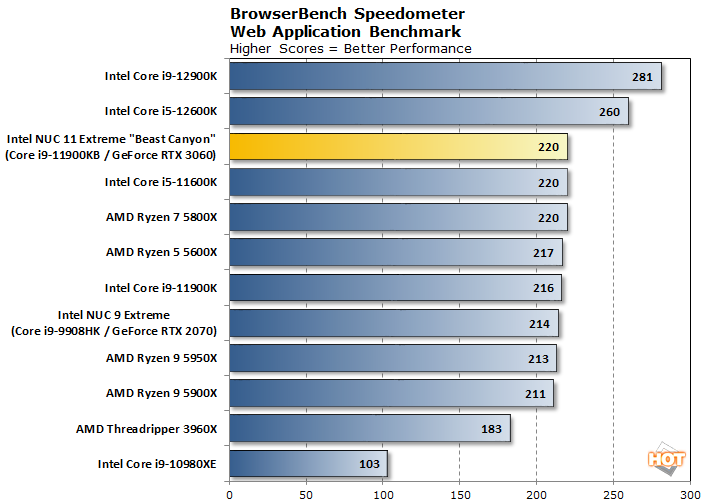
Cinbench 3D Rendering Benchmarks
Cinebench provides a glimpse into the system's parallel compute throughput. The tests are based on Maxon’s Cinema 4D modeling software that’s used in movie production studios...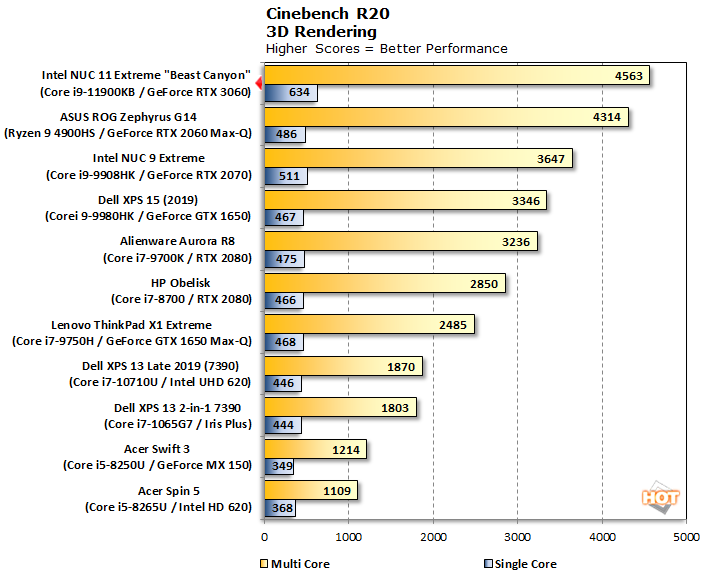
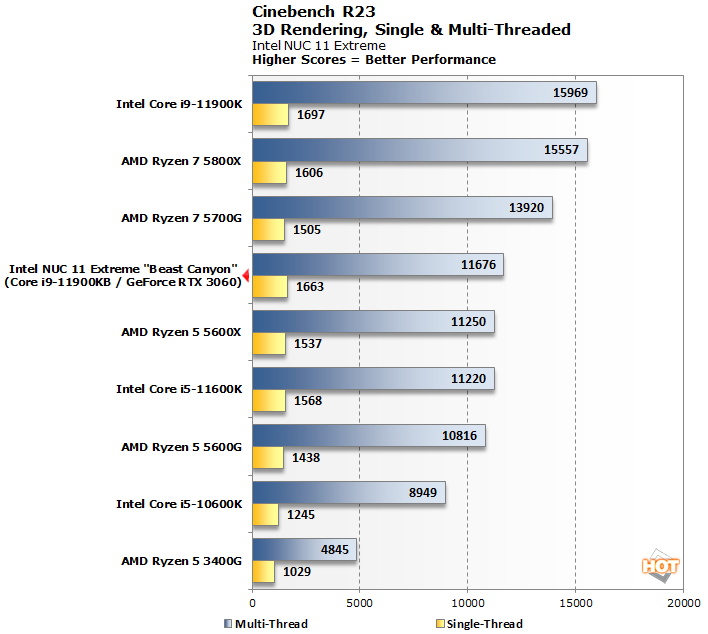
We're mixing up the systems here for the newer Cinebench R23 scores. Versus this group of desktop systems, the Intel NUC 11 Extreme lands just ahead of the Ryzen 5 5600X and trails only the 8-core desktop chips overall.
Geekbench 5 Benchmark Results
Geekbench 5 is a cross-platform benchmark that simulates real world processing workloads in image processing and particle physics scenarios. We tested the systems here with Geekbench 5’s single and multi-core test workloads.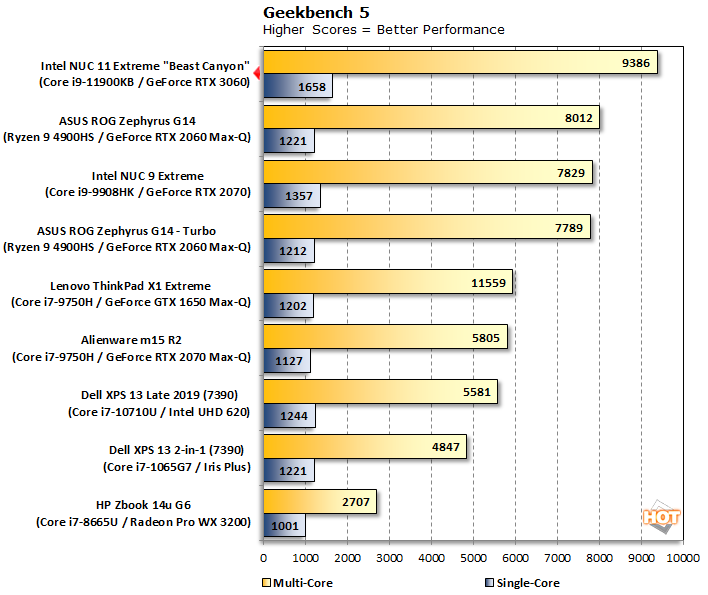
UL PCMark 10 System-Level Benchmarks
UL benchmarks have been popular go-to system level tests since the late ‘90s, when they were made by MadOnion and later Futuremark. We ran the NUC 11 Extreme through PCMark 10, which is designed to gauge the system's performance in common, everyday computing tasks with GPU-acceleration enabled, and with 3DMark tests on the next page to assess its graphics and gaming chops.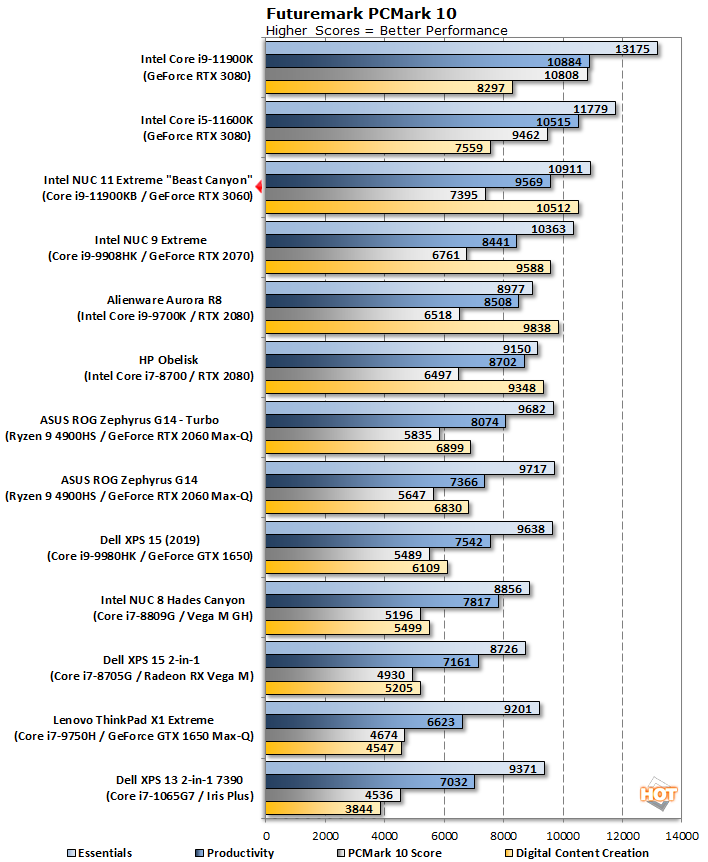
In PCMark 10, the Intel NUC 11 Extreme outruns the previous-gen NUC 9 Extreme to land just behind the full-power 11th-gen Core desktop processors. For mainstream computing tasks like those featured in PCMark, the NUC 11 Extreme is an extremely capable little system that can hang with some of today's highest-end hardware.