Intel Core i9-14900KS Review: The Fastest Desktop CPU Yet

UL 3DMark CPU Physics Benchmark
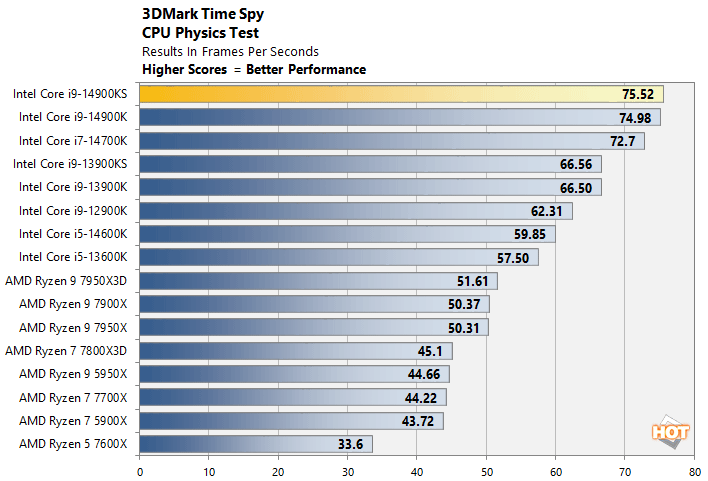
Our results in 3DMark's Physics test look much like the computational fluid dynamics benchmark on the previous page. Once again we see the Core i9-14900KS in the overall lead, but with only a tiny delta separating it from the existing Core i9-14900K.
High And Low Resolution Gaming & Graphics Benchmarks
We also ran some mid and high-resolution game and graphics tests on our test rigs with 3DMark, F1 2021, Metro Exodus, Shadow Of War and Shadow Of The Tomb Raider. We used 3DMark's default Time Spy preset, and the games were run in two different configurations -- either 1080p with Medium/High details, or 4K with High/Extreme details. The lower resolution tests are more CPU bound to somewhat isolate processor performance, while the higher resolution tests are more GPU bound.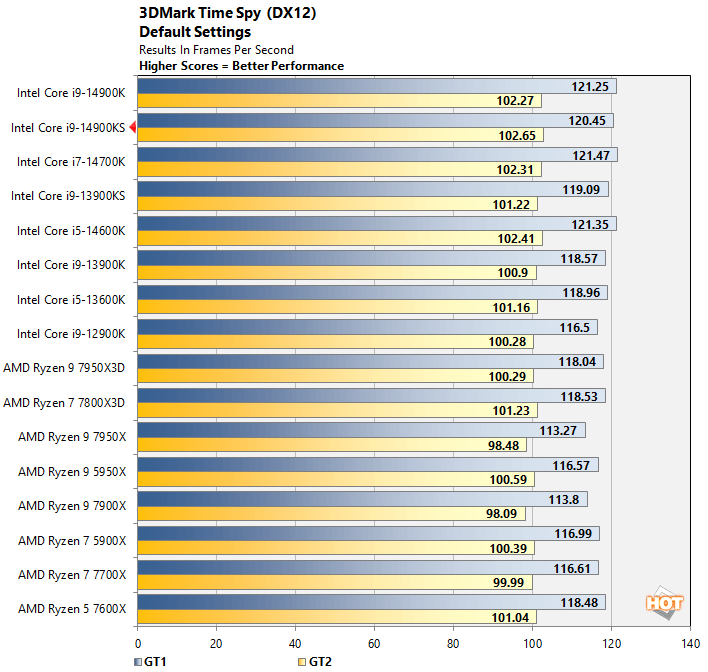
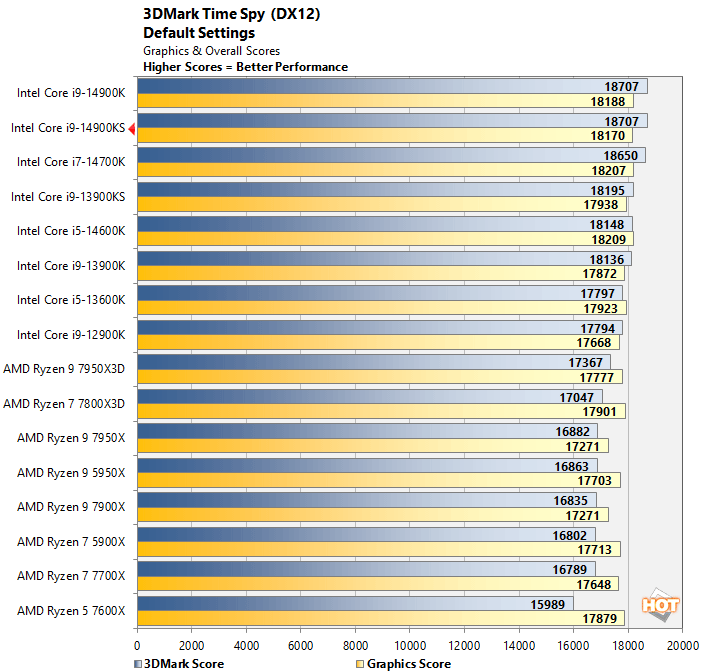
In the overall 3DMark Time Spy scores, the new Core i9-14900KS finishes near the top of the charts, in a dead heat with the 14900K. The 14900KS actually put up slightly slower graphics scores, but a better Physics score, which (remarkably!) resulted in the exact same overall score as the 14900K.
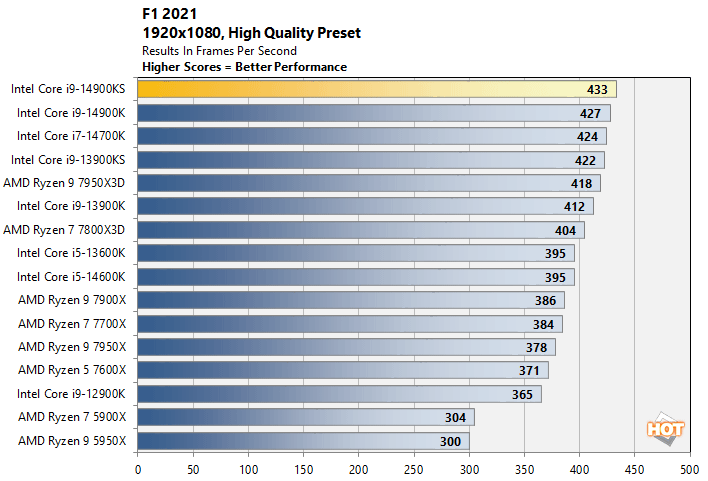
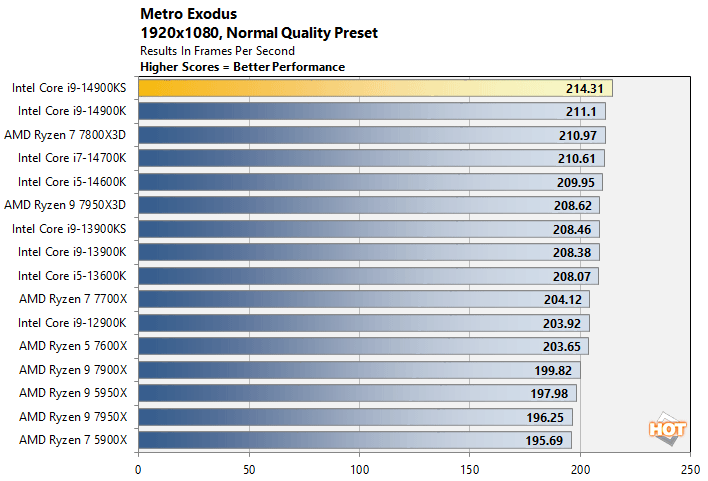
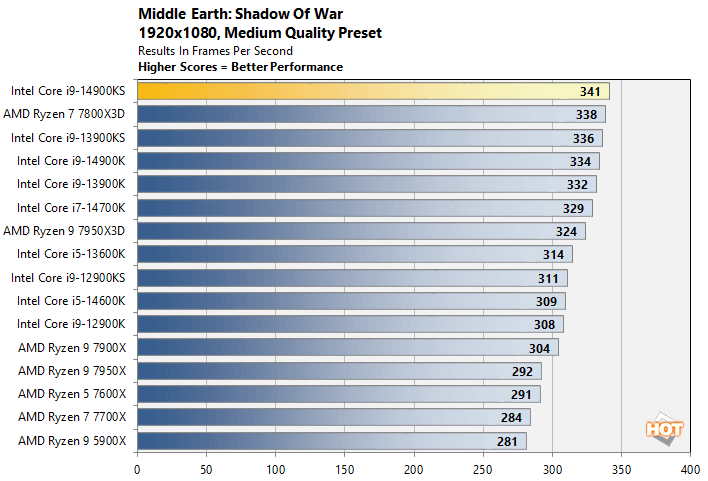
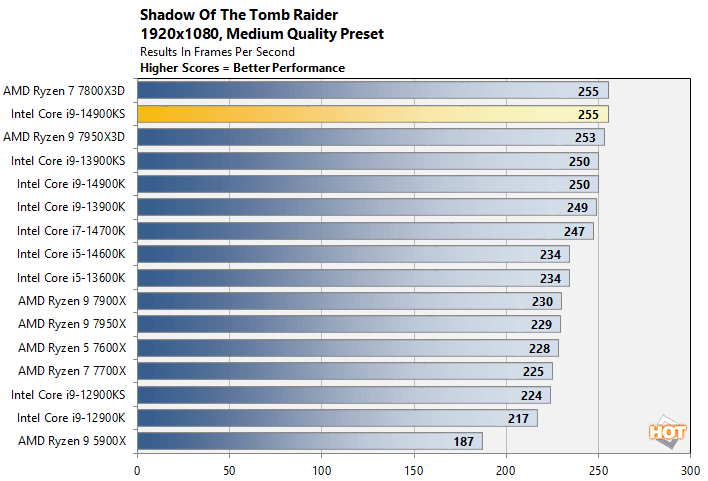
The Core i9-14900KS also performed very well in all of the "low res" 1080p game tests we ran. The Core i9-14900KS led the pack in three of four games, besting all of AMD's processors, except for the Ryzen 7 7800X3D, which put up an identical score in Tomb Raider.
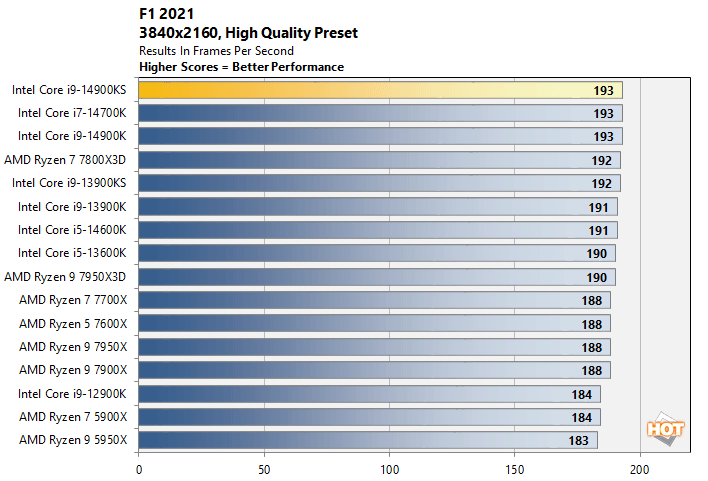
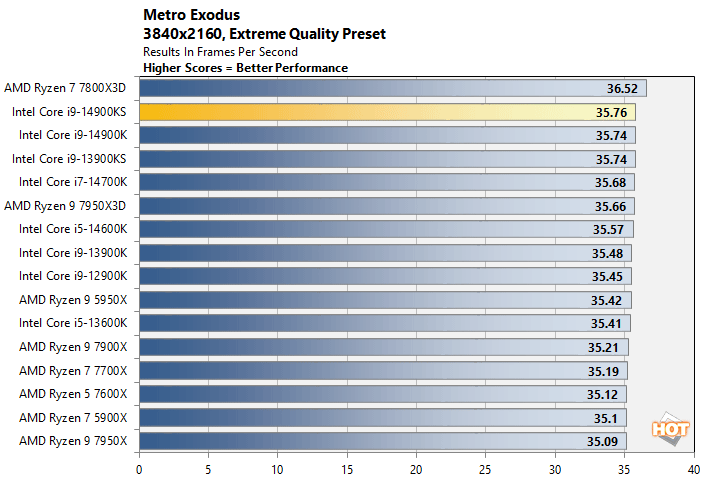
With game resolution increased to 4K and higher image quality settings used, frame rates leveled off and all of the platforms we tested performed similarly. The Core i9-14900KS did technically pull off a first place finish in F1 2021, however, due to the game not being completely GPU bound at 4K. The tables turn in Metro Exodus, with AMD's excellent 7800X3D taking the lead.
Intel Core i9-14900KS Total System Power Consumption
Throughout all of our benchmarking and testing, we also monitored how much power our test rigs were consuming with a power meter. Our goal here is to give you an idea as to how much power each configuration used while idling at the Windows desktop and while under taxing CPU workloads across one or all cores. Keep in mind, this is total system power consumption being measured at the outlet and not the the individual power being drawn by the CPUs alone.
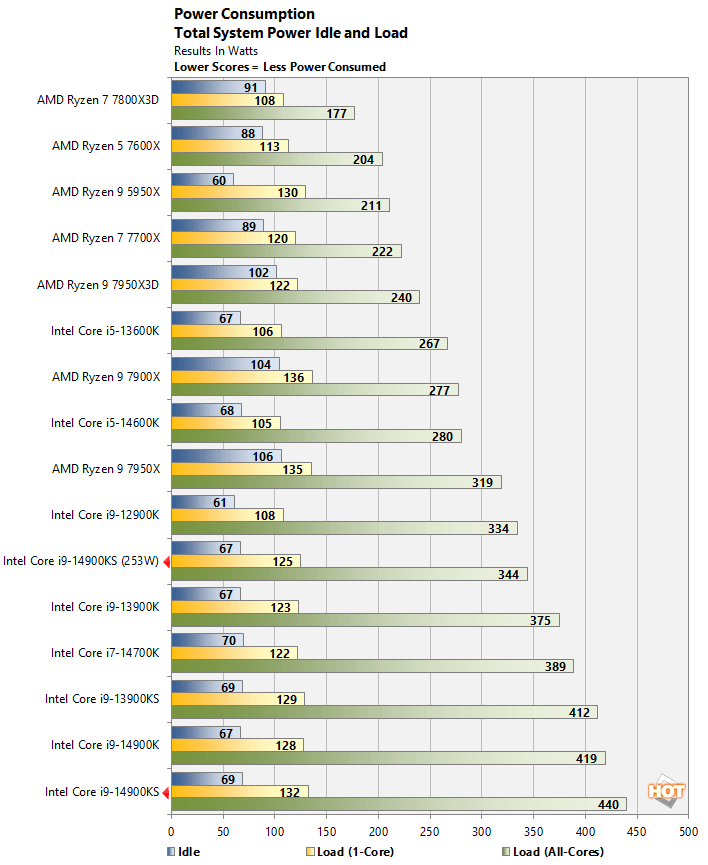
Because its essentially the same slice of silicon used in the Core i9-13900KS and Core i9-14900K -- only clocked higher -- it's no surprise that the Core i9-14900KS consumes more power than any other mainstream desktop CPU. The Core i9-14900KS required slightly higher voltages to maintain its higher clocks, which simply uses more power. Idle and single-core power looks competitive versus AMD's high-end Ryzen parts, but keep in mind we tested the Ryzen 7000s on the top-end X670E chipset, which is a two-chip solution, that consumes much more power than previous-gen platforms. On an X670 or B-series AM5 chipset, power consumption for the Ryzens would be lower in all three scenarios. Also note the second power-related entry for the Core i9-14900KS, with its power limited to 253W. With its power constraints in place, peak power drops by almost 100W. Of course, that affects performance as well. In Cinebench R23, for example, settings a 253W power limit results in a multi-threaded score of 37,450 vs. over 40K when unconstrained. The performance differential is less pronounced in games or lightly-threaded tests, but rest assured, without a quality cooler that can handle the heat that resulst from higher power consumption, performance of the Core i9-14900KS will be affected.

Core i9-14900KS Hardware Details - PCMark10
How power, frequencies, and thermals play out in a variety of workloads with the Core i9-14900KS is presented in the chart above. All of this data is gathered through a full PCMark 10 run. As you can see, the Core i9-14900KS remains nearly pegged at its all-core Turbo frequencies throughout, and temperature and power consumption are relatively tame for the most part. Once the sustained, multi-threaded POV-Ray workload is engaged at the very end, however, power and thermals peak, with the Core i9-14900KS quickly hitting 100°C, even with the Corsair AIO liquid cooler installed in our test system.

Core i9-14900KS Hardware Details - 3DMark Time Spy
With a simulated gaming workload, however, the story is a little different. Because the CPU is never really pegged in the graphics-centric game tests, the Core i9-14900KS maintains a relatively high-frequency, with a relatively tame 70-ish°C temperature, throughout. It's not until the multi-threaded, CPU-only Physics tests where the chip's temperature spikes.