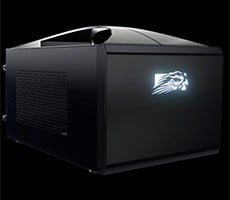
Falcon Northwest FragBox Review: Tiny Gaming PC, Big Performance

We initially began testing the FragBox with last year's full system test suite at 1440p, but soon found that ir significantly outstripped the systems we've tested in the past, making for a poor comparison on performance. This discovery prompting the procurement of an additional 4K monitor and a re-working of our PC benchmark suite. We recently encountered this same issue in our testing of Maingear's MG-1, as its Intel Core i9-13900K and NVIDIA GeForce RTX 4080 made for the fastest pre-built gaming PC we'd tested up to that point. However, as you'll see below, it didn't hold that crown for long.
In order to better determine where newer PCs stand compared to similar-caliber hardware, we’ve put together an updated system test suite, pulling results from our recent CPU and GPU reviews. Thus, most benchmark results below are labeled “HH Test Bench.” Big thanks to Marco Chiappetta for capturing and documenting all these numbers. Thanks to his work, we were even able to include test bench results for Intel’s Core i9-13900KS, which we were very curious to see after publishing our sneak peak of that processor’s performance in the FragBox.
We speculated in that article that the small form factor of the FragBox might limit the thermal capacity of the system and hamper performance under heavy load. We thought that the i9-13900KS might put out higher benchmark scores in our test bench, where there’s more air volume, fans, and distance between the CPU and GPU. However, we were pleasantly surprised to find that the FragBox’s form factor doesn’t appear to be limiting performance, as it consistently scored higher than everything on our test bench, except in a few cases where it took second place. Thus, not only did the FragBox perform slightly better than we thought it might, we’re happy to say that we have a new king of our benchmark suite.
ATTO Disk Benchmark
The ATTO disk benchmark is a fairly quick and simple test which measures read/write bandwidth and IOPS across a range of different data sizes. While we don't typically compare these results across multiple machines, it's useful to gauge whether a particular system’s storage subsystem is up to snuff.
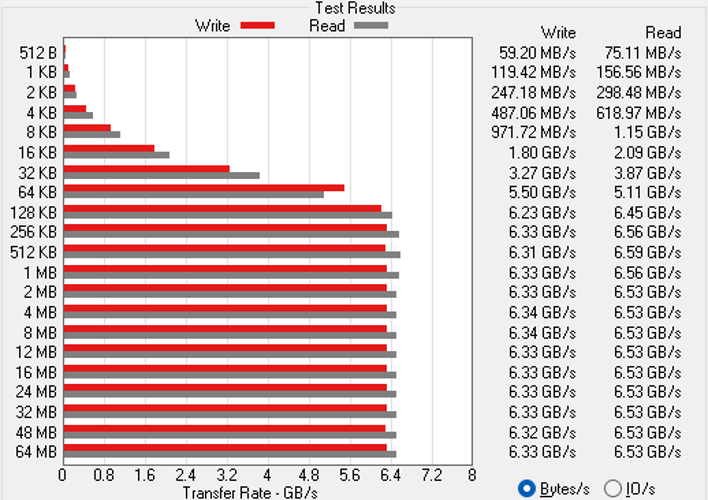
The 2TB Kingstong FURY Renegade PCIe M.2 SSD in the FragBox performed brilliantly, easily achieving a over 6 GB/sec both read and write early on at the 128 KB transfer size. Many systems, including Falcon Northwest’s Tiki from last year, reach 6 GB/sec read speed, but write speed is often more limited. Many SSDs also don’t near their maximum read and write speeds until around the 1 MB transfer size.
Suffice to say, we’re very pleased with these storage speeds. Falcon Northwest will even load up the FragBox with two more M.2 PCIe SSDs at a buyer's request, so long as the configuration allows enough open slots for it. The company can also add to the storage capacity with two 2.5” SSDs and one 3.5” HDD.
Suffice to say, we’re very pleased with these storage speeds. Falcon Northwest will even load up the FragBox with two more M.2 PCIe SSDs at a buyer's request, so long as the configuration allows enough open slots for it. The company can also add to the storage capacity with two 2.5” SSDs and one 3.5” HDD.
Speedometer 2.0 Benchmark
Here we have numbers from the Speedometer 2.0 tests available at browserbench.org. The Speedometer Benchmark Suite uses a wide array of latency and throughput benchmarks to evaluate web application performance, then tabulates all the individual results into a final score. This benchmarks measures performance of an array of browser-based technologies used on modern, rich web applications. Scores in this benchmark are an indicator of the performance users would see when browsing the web and running advanced web apps. All of the systems were tested using the latest version of Microsoft's Edge browser, with default browser settings, on a clean, fully-updated install of Windows 11.
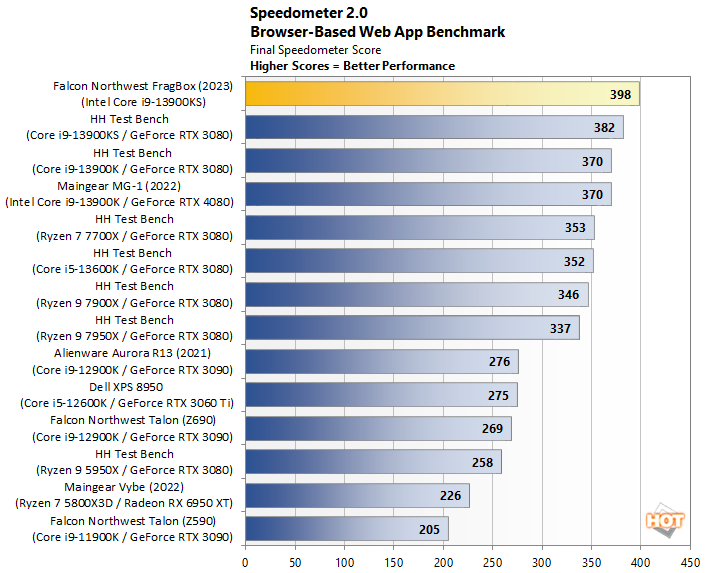
Browser benchmark tests can be somewhat temperamental, as browsers are frequently updated. Our initial testing showed the i9-13900K just slightly outperforming the i9-13900KS in the FragBox. However, after running this test again at a later date, the FragBox’s CPU broke out and shot past not only the i9-13900K, but also the i9-13900KS in our test bench. This result wasn’t a fluke either, as we run all our tests at least three times to check for consistency. As expected, the FragBox shouldn’t have any issues handling browser-based workloads. The only limitation on browser performance might be the system’s 32GB of RAM, if you have way too many tabs open. However, buyers can opt for up to 128GB of RAM.
Cinebench R23 Rendering Benchmark
Cinebench is a rendering performance test based on Maxon's Cinema 4D, which is a 3D rendering and animation tool suite used by animation houses and producers like Sony Animation and many others. It's very demanding on system processor resources, and it can utilize any number of threads, which make it an excellent gauge of computational throughput. This is a multi-threaded, multi-processor aware benchmark that renders and animates 3D scenes and tracks the length of the entire process. The rate at which each test system was able to render the entire scene is represented in the graph below.
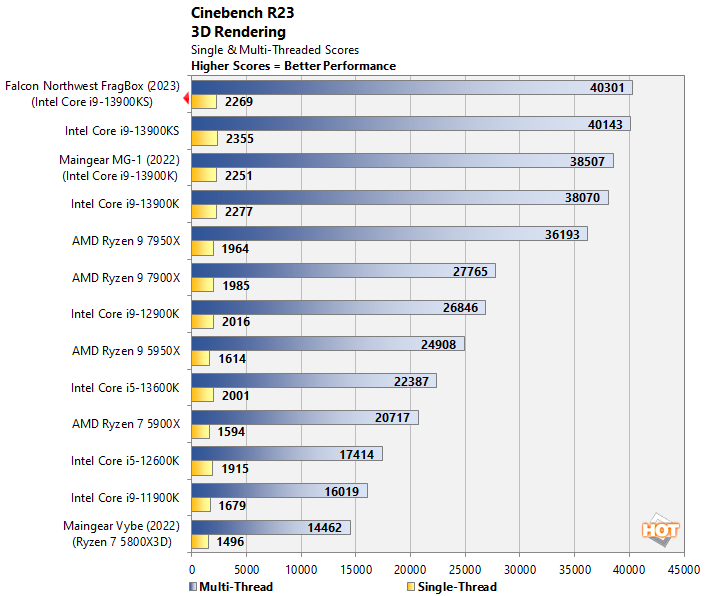
Here the only close competitor for the i9-Core 13900KS in the FragBox is the same CPU in our test bench. The FragBox slightly outperformed our test bench on multi-threaded performance, while slightly under performing on single-threaded performance. Either way, the FragBox still beats out the entire rest of the field.
Blender 3D Rendering Benchmark
Blender is a free and open source 3D creation suite that can handle everything from modeling, rigging, and animation to simulation, rendering, compositing and motion tracking. It has a purpose-built benchmarking tool that includes three pre-built scenes to render out while tracking the time it takes to completely render each scene.
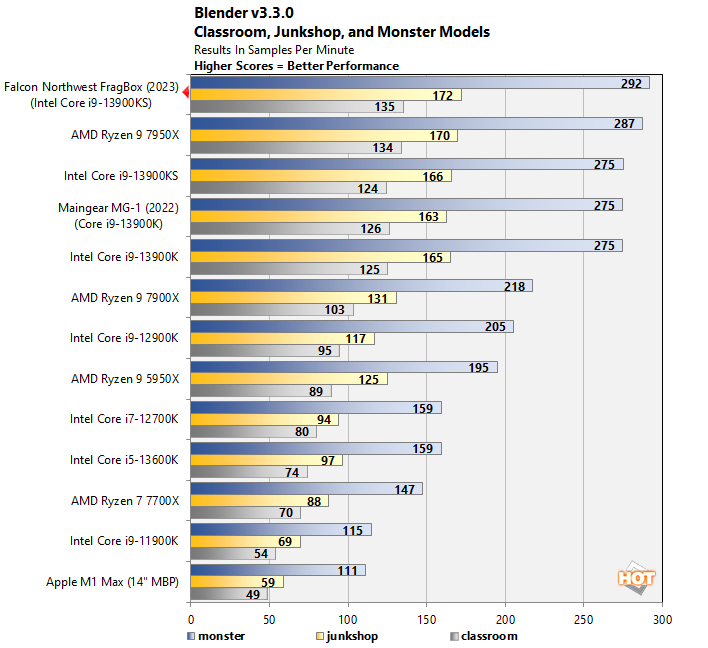
In this test, AMD’s Ryzen 9 7950X managed to edge out a victory over Intel’s Core i9-13900KS in our test bench, but the FragBox puts Intel back on top with the highest scores we’ve seen yet. Given that the other 24-core Raptor Lake chips we’ve tested have all performance almost identically in Blender, it may be fair to say that we won the silicon lottery with the particular chip in our FragBox or driver / system updates have boosted Raptor Lake performance somewhat since our initial review.
Geekbench v5.4.1 System Benchmark
In the GeekBench tests, we're stressing only the CPU cores in a system (not the graphics card/GPU), with both single and multi-threaded workloads. The tests are comprised of encryption processing, image compression, HTML5 parsing, physics calculations and other general purpose compute processing workloads.
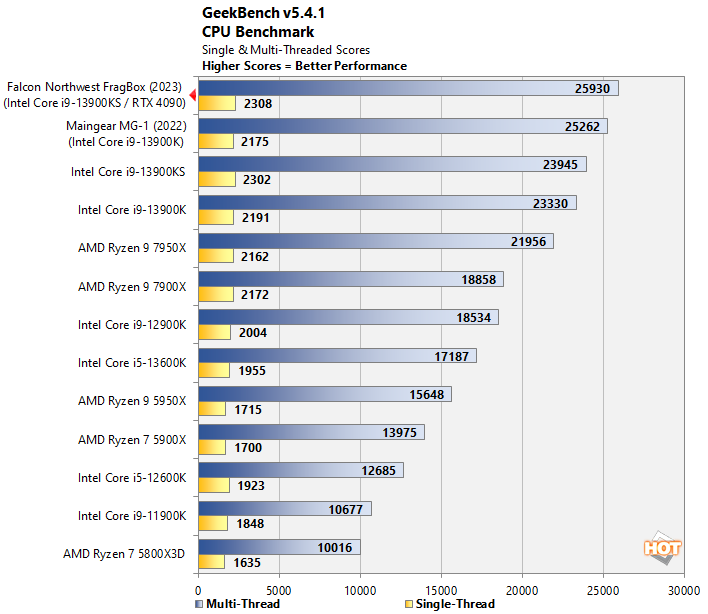
We rank these results by multi-threaded results, and the Core i9-13900K in the Maingear MG-1 pulled off a victory over the i9-13900KS in our test bench. Nonetheless, the “S” variant still put out a higher singled-threaded performance number in our test bench. The chip in the FragBox performed similarly on single-threaded performance, while topping the chart with a higher multi-threaded score than the Maingear MG-1.
PCMark 10 Whole System Benchmark
PCMark 10 uses a mix of real-world applications and simulated workloads to establish how well a given system performs productivity tasks, including image and video editing, web browsing, and OpenOffice document editing. These scores appear to be more neatly clustered than some comparison sets, but we should still note that the systems are sorted by their overall PCMark score, which is the fourth (gray) bar in each cluster.
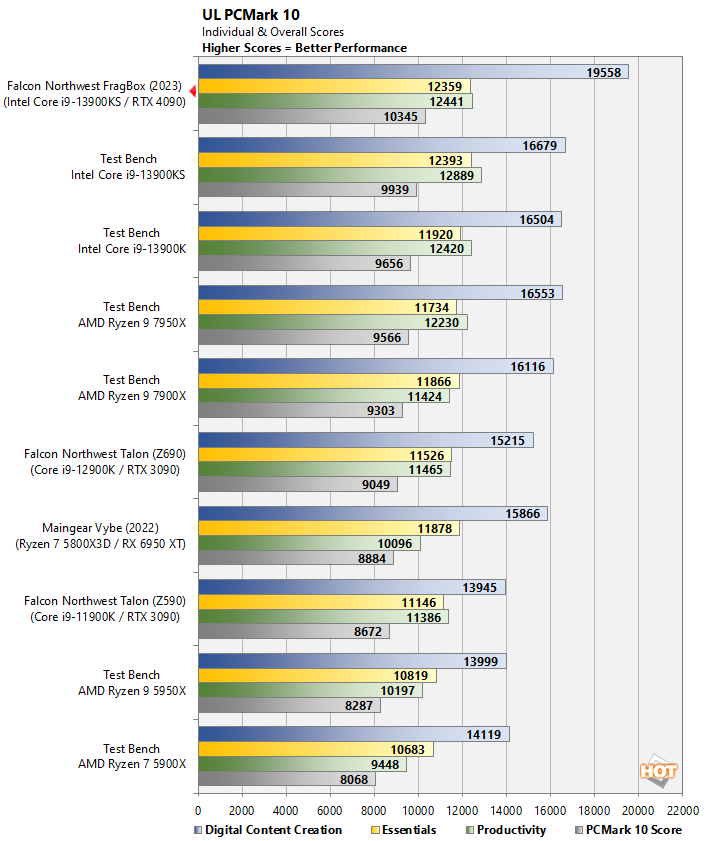
Unfortunately, we ran into issues running this benchmark on the Maingear MG-1, so we don’t have comparison numbers for that system. Even so, we’re still confident in handing the crown to the FragBox on this one, given its record high scores and more powerful hardware.
3DMark Time Spy DirectX 12 Benchmark
As usual, we'll start off our 3D benchmarking with 3DMark. If you're somehow unfamiliar, 3DMark is a synthetic game-like benchmark for assessing gaming graphics (GPU) and physics (CPU) performance. This tool has a wide variety of tests and demos that target various types of graphics workloads, to give a better picture of how a system will handle real games. We used the Time Spy benchmark, 3DMark's DirectX 12 test. This test has multiple presets, but the standard Time Spy test is plenty taxing.
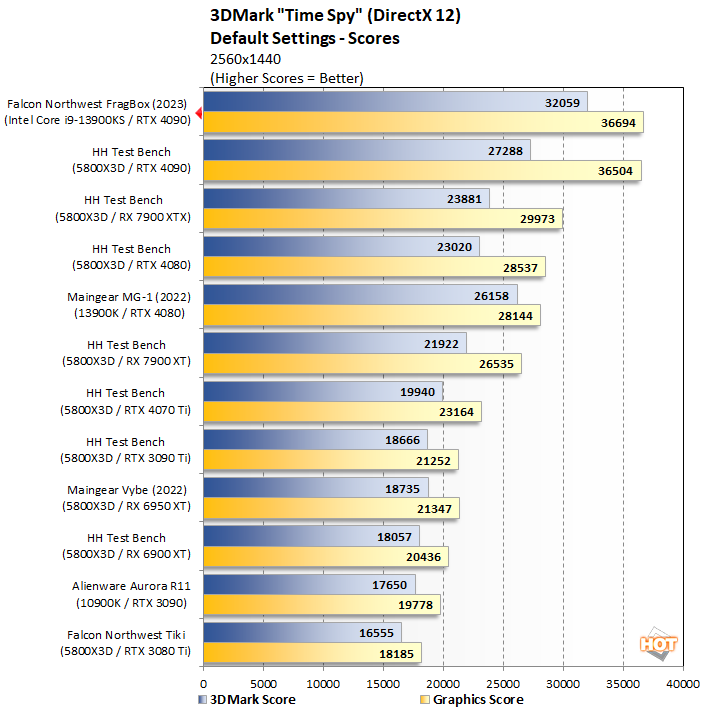
Here the Maingear MG-1 put up a high overall score, but its graphics score held it back in the rankings. Meanwhile, the FragBox just barely topped the chart with its graphics score, while trouncing the overall scores of everything else on the chart.
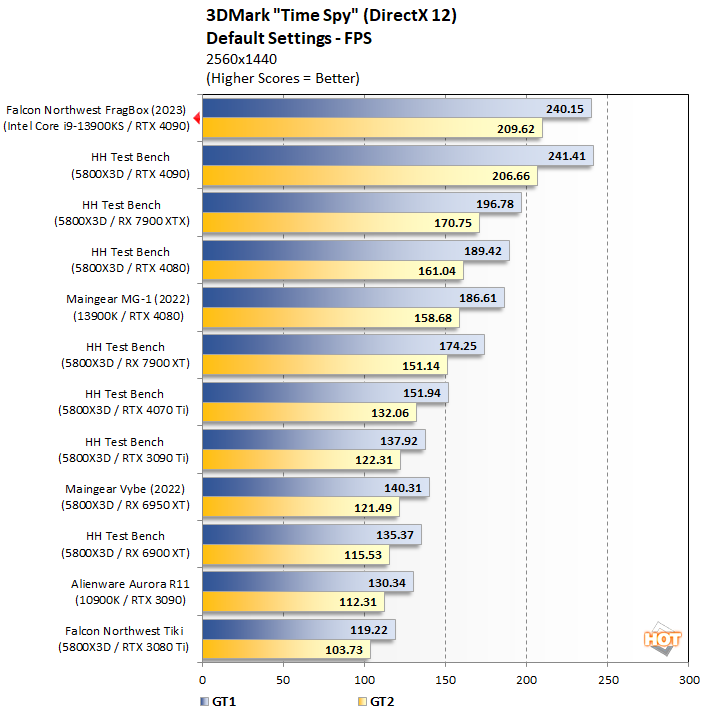
Taking a closer look at the two graphics tests within the larger Time Spy benchmark, the FragBox just barely misses an undisputed first place finish due to a slightly lower FPS average in the first graphics test than the RTX 4090 in our test bench. However, ranking the results according to scores in the second graphics test, the FragBox is on top with its record high FPS average in this test.
3DMark Port Royal DirectX Raytracing Benchmark
Port Royal was released as an update to UL’s popular 3DMark suite. It is designed to test real-time ray tracing performance of graphics cards that support Microsoft DirectX Raytracing, or DXR. Although DXR is technically compatible with all DX12-class GPUs, the graphics card must have drivers that enable support for the feature.
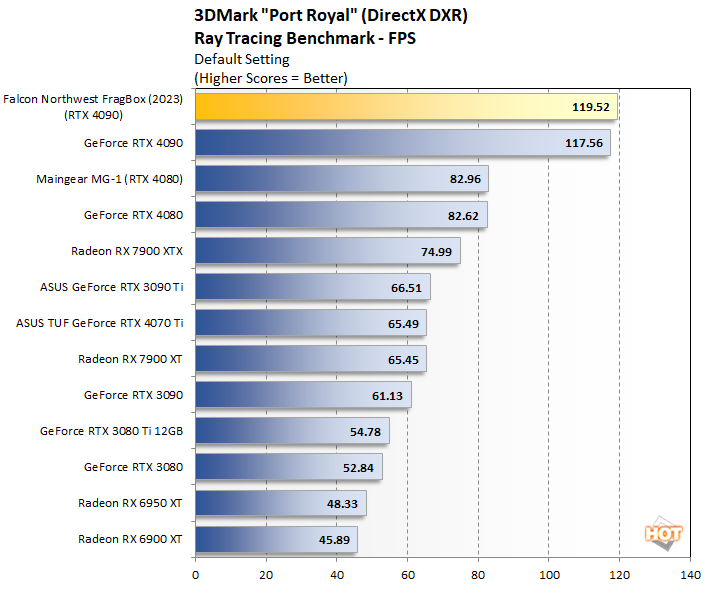
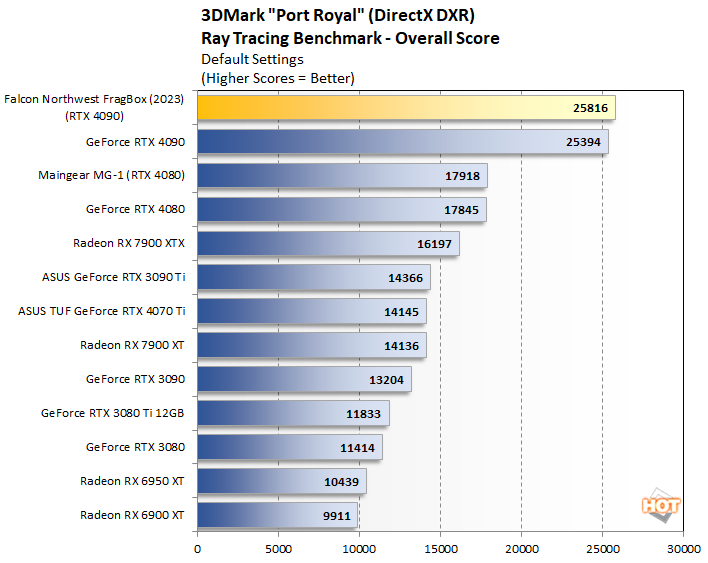
In this benchmark, the overall scores and FPS averages tell the same story, which is that the RTX 4090 is in a class of its own when it comes to ray-tracing. Given that this benchmark relies almost entirely on GPU performance, it makes for a good comparison between our test bench and the FragBox. With a slightly higher score than the 4090 in our test bench, the 4090 in the FragBox doesn’t appear to be undergoing any thermal throttling as a result of the system’s small form factor.
Unigine Superposition VR Benchmark
Superposition is the latest benchmark from Unigine, powered by the UNIGINE 2 Engine. It offers an array of benchmark modes, targeting gaming workloads as well as VR, with both DirectX and OpenGL code paths. There's an extreme hardware stability test built-in too. Unigine Superposition uses the developer’s unique SSRTGI (Screen-Space Ray-Traced Global Illumination) dynamic lighting technology along with high quality textures and models, to produce some excellent visuals. We ran Superposition's VR Future benchmark to compare the FragBox against several systems, as well as our test bench.
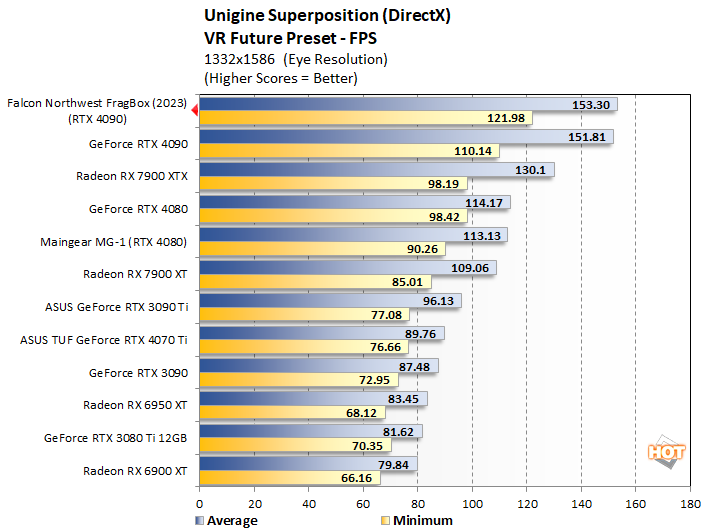
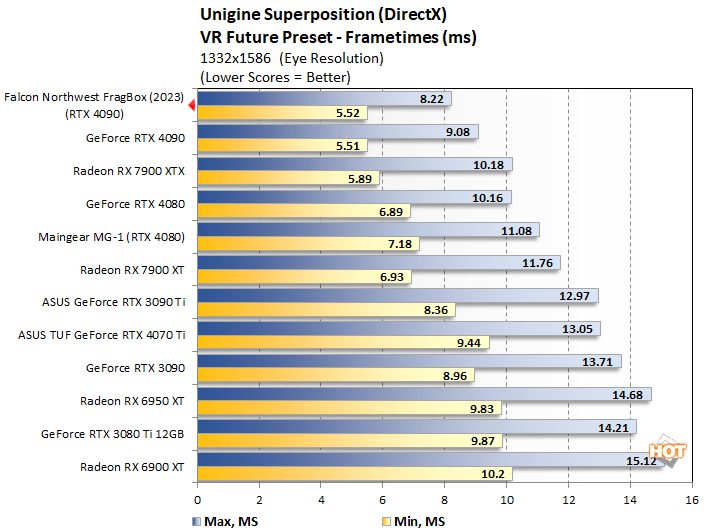
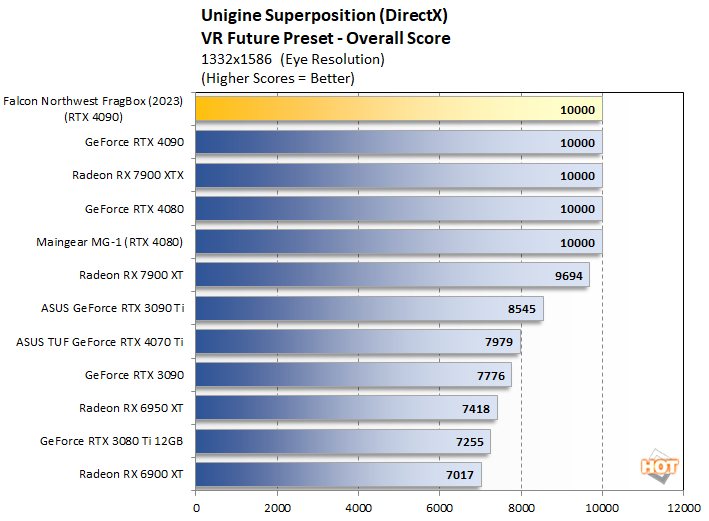
The FragBox’s perfect score of 10,000 tells us that the system is capable of maintaing a minimum framerate above 90 FPS, which is necessary for a smooth VR experience. However, as you can see from the FPS chart, the FragBox not only meets this minimum, but well exceeds it, averaging 153.30 FPS and dipping down to a minimum of 121.98 FPS. More than any other hardware configuration we’ve tested, the FragBox should make for a buttery smooth VR experience.
Final Fantasy XIV Endwalker Benchmark
Final Fantasy XIV: Endwalker launched at the end of 2021, and as usual, Square-Enix updated its free character creator and benchmark tool. The free utility checks in at approximately a 2.21GB download. It will test your PC's ability to run the game at various settings, and presents a final result with an overall rating upon its conclusion. We tested Final Fantasy XIV: Endwalker in 4K UHD, with maximum image quality settings.
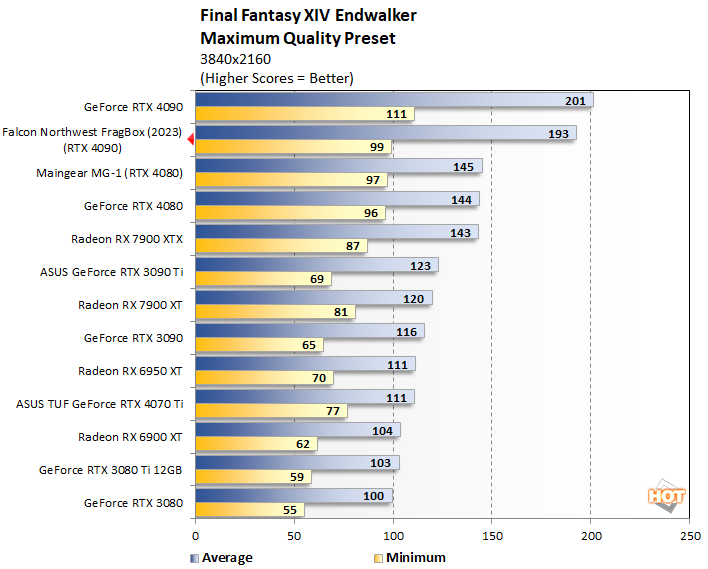
In this benchmark, the FragBox just slightly underperformed the Ryzen 5800X3D and RTX 4090 combo in our test bench, but that difference would be hardly noticeable during actual gameplay. An average FPS of 193 is more than most monitors can even fully display.
Forza Horizon 5 Benchmark
Forza Horizon 5 is currently the latest edition of Microsoft and Playground Games' popular open-world racing franchise. This title leverages the proprietary ForzaTech engine and DirectX 12 Ultimate to deliver much larger maps than its predecessors, with more detailed models and higher graphics fidelity in general including some ray-traced reflection effects. We tested the game in 4K with the "Extreme" graphics preset.
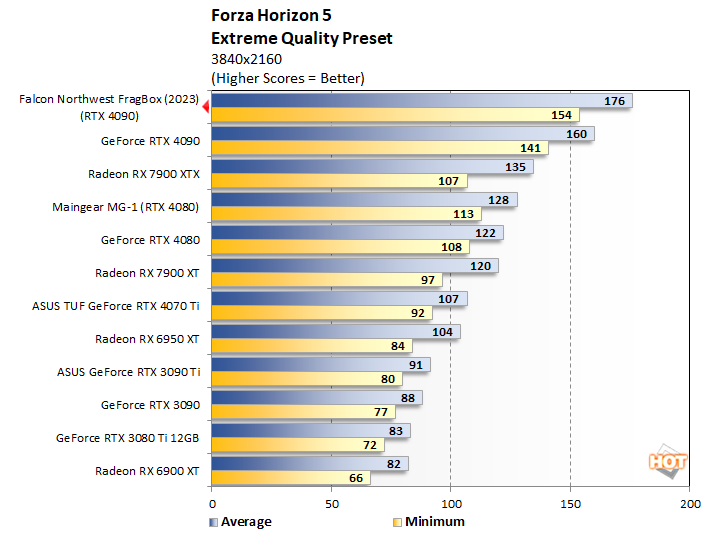
Here the Core i9-13900KS in the FragBox helps its RTX 4090 outperform the 4090 in our test bench by an average of 16 FPS. The FragBox also manages to maintain a higher minimum FPS than our best test bench scores.
Marvel’s Guardians of the Galaxy Benchmark
Marvel’s Guardians of the Galaxy is an action-adventure game where you play as Star-Lord and lead the rest of the Guardians from mission to mission. The game’s minimum requirements call for a Radeon RX 570 or GeForce GTX 1060-class GPU, but it also supports some of the latest graphics technologies, including DXR and DLSS.
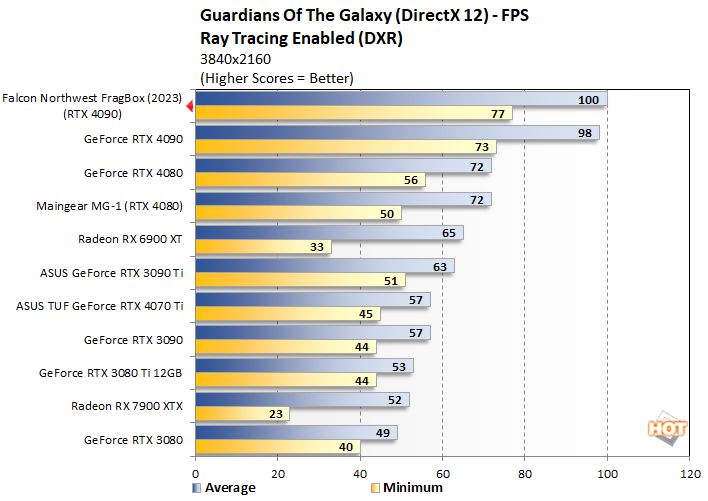
Once again, the FragBox tops the charts, leading the pack with just a slightly higher FPS average and minimum than the 4090 in our test bench. Both of these setups sit comfortable out front, with the rest of the group landing significantly farther behind.
F1 22 Formula 1 Racing Benchmark
F1 2022 is Codemasters' latest Formula One racing simulation, and like previous version of the game, it sports impressive visuals. This latest addition to the franchise supports DirectX 12 with ray tracing, and it incorporates support for a number of AMD and NVIDIA technologies (like FSR 2.2 and DLSS Frame Generation). We tested the game with its Ultra High graphics preset, with ray-tracing and TAA enabled.
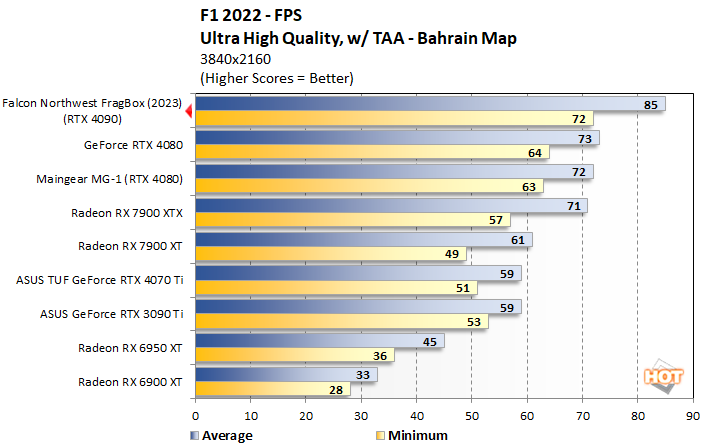
In this benchmark, the FragBox beats out the competition with an average FPS of 85 and a minimum of 72. With a GeFrce RTX 4090 and Core i9-13900KS, it’s easy to see that this FragBox is one of the most powerful gaming systems money can buy.