ASUS ROG Ally X Review: Handheld PC Gaming Greatness

One of the interesting things about the ROG Ally and similar handhelds is that they are full Windows PCs. While you can treat them like game consoles, they are in fact fully capable computers ready to do whatever you want. With that in mind, we did put the Ally X through our usual gauntlet of benchmarks, so on this page we'll be sharing the results of that testing.
ATTO Disk Benchmark
We'll start off the barrage of benchmarks with the ATTO Disk Benchmark. ATTO is a fairly quick and simple test which measures read/write bandwidth and IOPS across a range of different data sizes. While we don't typically compare these results across multiple machines, it's useful to gauge whether a particular notebook's storage subsystem performs well.
The 1TB WD SN560 SSD in the Ally X is an entry-level PCIe 4.0 SSD, and it puts up exactly the kind of performance in ATTO that we'd expect of such a drive. Notably, while this drive connects using PCIe 4.0, it does so using only two lanes. This actually helps to save power, and is probably one of the factors contributing to the Ally X's dominating power efficiency when compared to the original Ally.
Speedometer Web Application Benchmarks
We use BrowserBench.org's Speedometer test to take a holistic look at web application performance. This test automatically loads and runs several sample web apps from ToDoMVC.com using the most popular web development frameworks around, including React, Angular, Ember.js, and even plain-Jane JavaScript. This test is a better example of how systems cope with real web applications in comparison with a more compute-focused JavaScript test like JetStream. All tests were performed using the latest version of Chrome.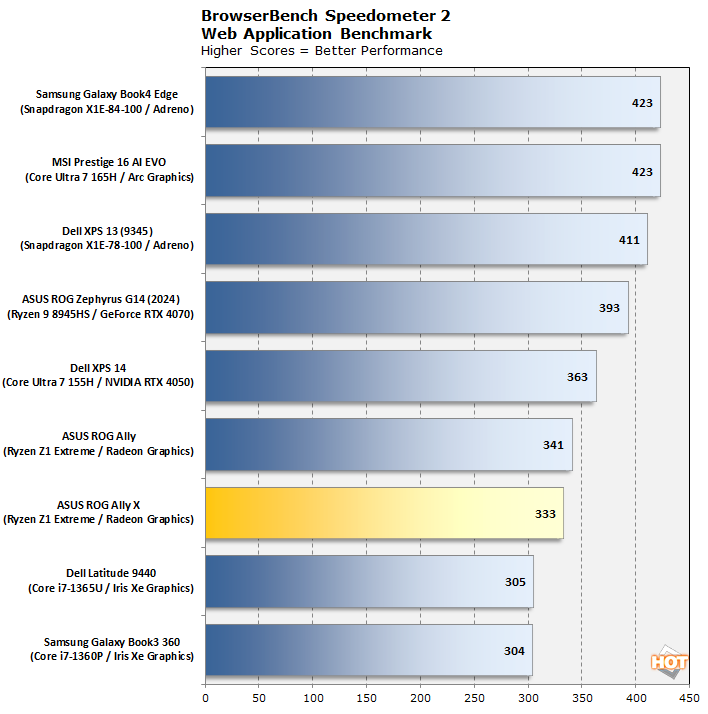
Speedometer has never really favored AMD's CPUs, and the Ally X shows a slight regression against the original Ally. We tested and re-tested these results and they are consistent. We suspect the increased memory speed may have come with a slight increase in memory latency, slightly hampering single-threaded performance. Still, these results are hardly bad, though. How does the Ally X fare in the newer Speedometer 3 benchmark?
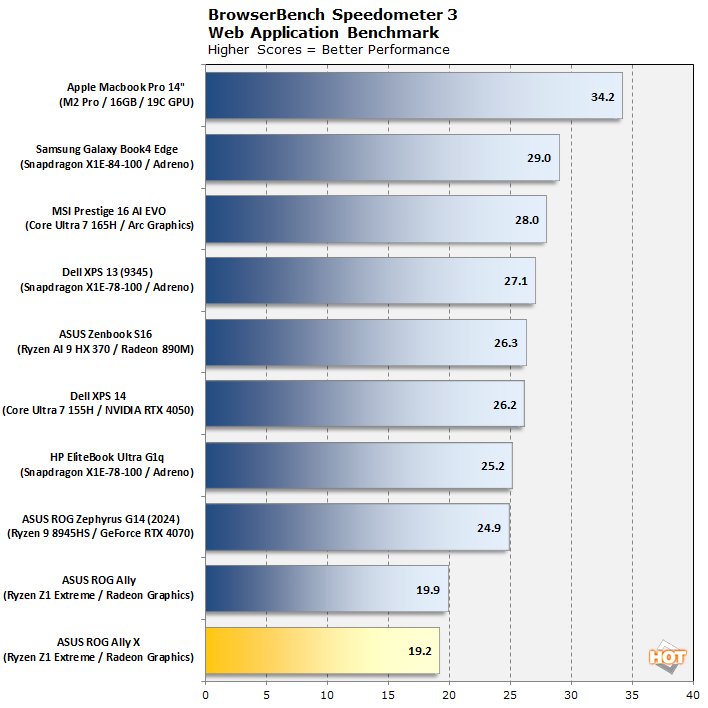
The Speedometer 3 story is worse for the Ryzen Z1 Extreme, which doesn't really make much sense as it's the exact same silicon as in the Ryzen 9 8945HS, but we suspect the difference is down to power management and firmware tuning. ASUS has surely set up the Ally for maximum gaming efficiency, not for rapid browsing. With that said, you'll be more than fine browsing Facebook or working in Google Docs on the Ally, which sounds ridiculous, but there's no reason you couldn't use this machine as a standard PC with a suitable dock.
Maxon Cinebench Rendering Benchmarks
Next up is the previous-generation 3D rendering benchmark from Maxon, based on the Cinema 4D R23 rendering engine. It's a purely CPU-based test that doesn't make use of the graphics processor at all, and it scales very well with additional CPU cores. We ran both single- and multi-threaded tests on all of the machines in the charts.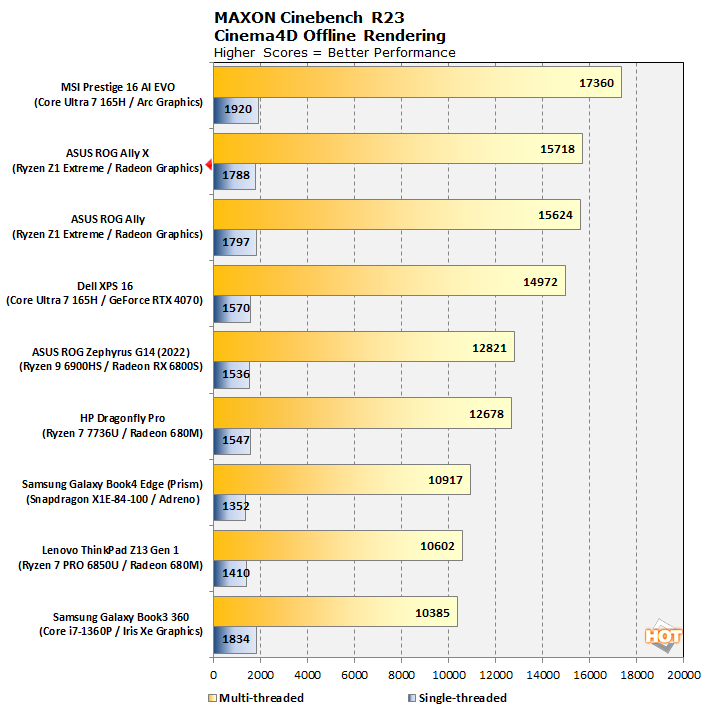
The Cinebench R23 results are pretty interesting. In this collection of low-powered parts, the Ryzen Z1 Extreme comports itself rather well. Remember, this is only an eight-core CPU running inside a handheld gaming system. The Ally X sees a small single-core regression against the OG Ally, but the multi-core score is slightly higher, likely due to either the faster memory clock or better thermal management. This becomes a trend in the rest of our results.
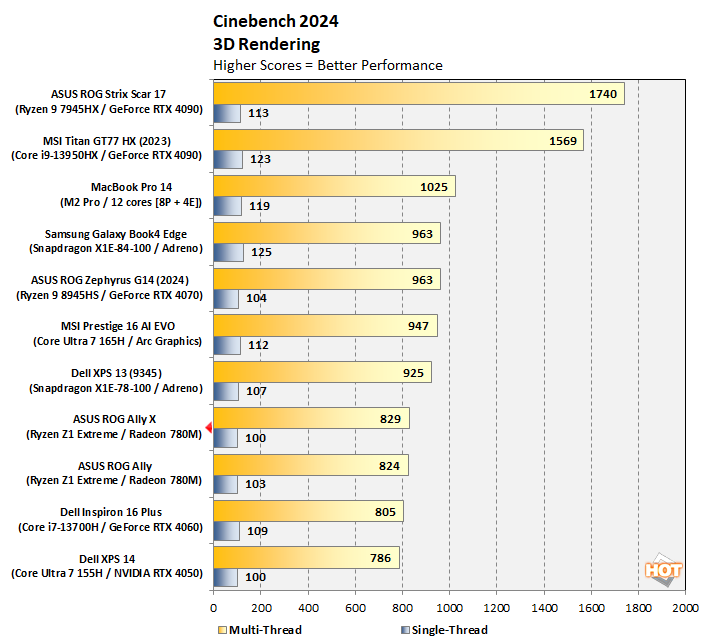
In the newer Cinebench 24 test, the Ally machines fall behind larger systems. This is largely due to the introduction of a couple of desktop-class CPUs as well as the fact that Cinebench 24 has a native ARM64 build, allowing the Snapdragon X Elite parts to really stretch their legs. All told, the performance is in line with what we'd expect from AMD Phoenix.
Geekbench CPU Benchmarks
Geekbench is a cross-platform benchmark that simulates real-world workloads in a wide variety of tasks, including encryption, image processing, physical simulation, machine learning, and many more. We tested the systems featured here with both the latest Geekbench 6 version as well as the previous Geekbench 5 release to get an idea of their overall system performance in scientific applications. First up, Geekbench 5.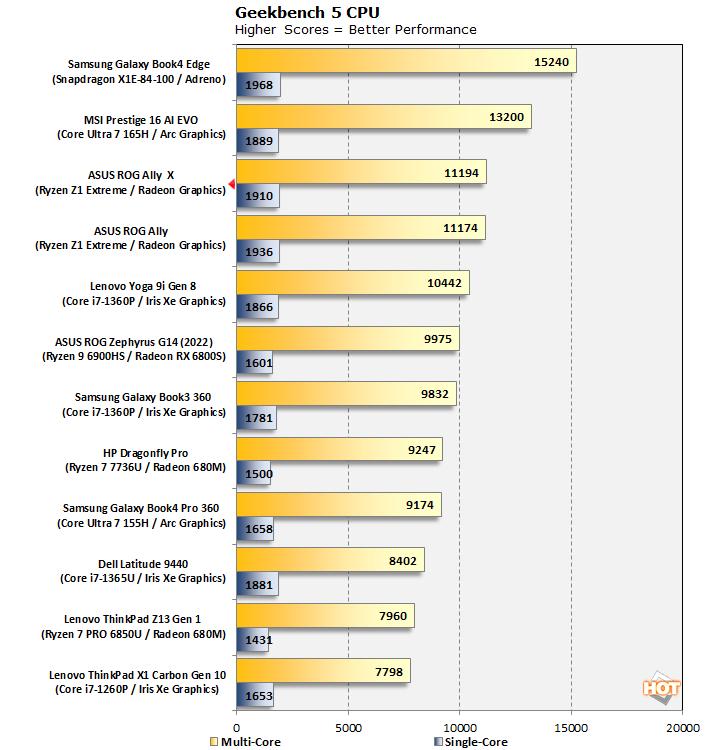
Our Geekbench 5 data includes a number older and lower-power machines, so the ROG Ally's Ryzen Z1 Extreme comes out looking strong. Of course, the twelve-core Snapdragon X1E-84-100 in the Galaxy Book4 Edge stomps on everyone, but the results out of the Ally and Ally X are very close indeed.
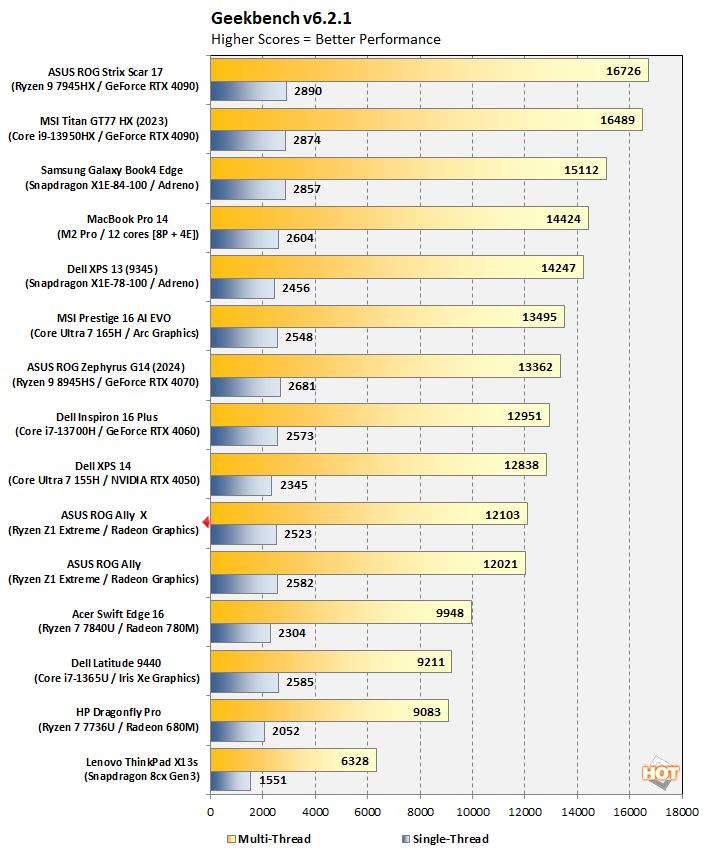
Just like with Cinebench, the newer Geekbench 6 benchmark sees the Ryzen Z1 Extreme fall down the rankings a bit due to being compared against much more powerful processors. Make no mistake, though -- you can run your PC workloads on this gaming handheld just fine, but don't expect blistering speed from these little 9-30W SoCs.
PCMark 10 Productivity Benchmark
The standard PCMark 10 benchmark uses a mix of real-world applications like OpenOffice and Zoom as well as simulated workloads to establish how well a given system performs productivity and content creation tasks, including (but not limited to) image and video editing, web browsing, teleconferencing, document creation, and so on. We ran it on all these machines to see which one is the best for creative work.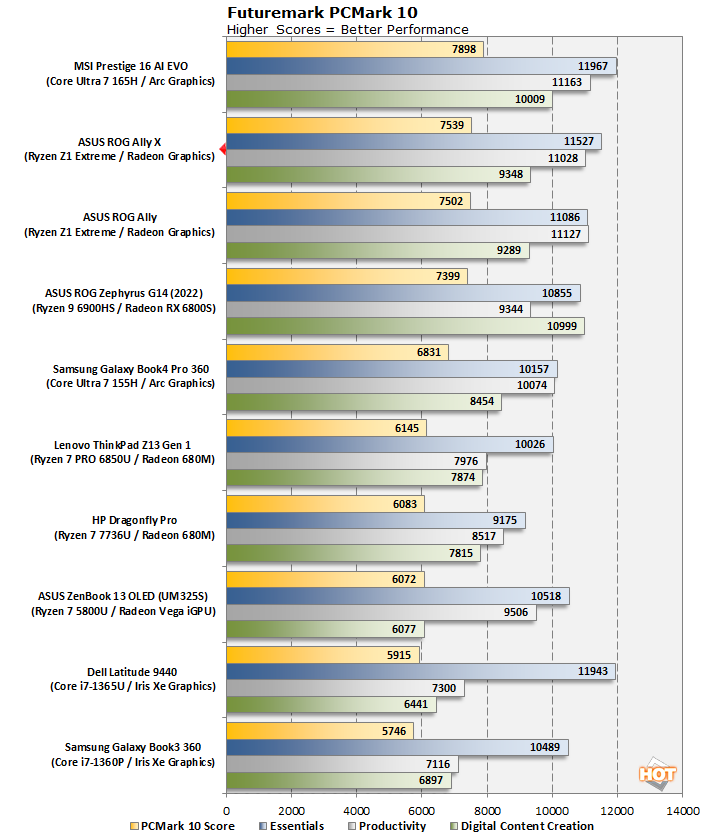
As it happens, the Ryzen Z1 Extreme is surprisingly competent at this kind of work. The ROG Ally X puts up a score ever so slightly better than the original model, with a significant gain in the Essentials category being offset by a slight drop in Productivity. The overall score is basically a margin-of-error difference, anyway. They're the exact same SoC, after all.
UL 3DMark Synthetic Gaming Benchmarks
If you're an enthusiast, you most likely know that 3DMark offers a wide variety of tests. Most of them aren't really suitable for a gaming handheld like this, as they are targeted at powerful machines with discrete GPUs. For that reason, we chose to run 3DMark Night Raid, a modern DirectX 12 test specifically for mobile parts and integrated graphics, as well as the highly-demanding Wild Life Extreme 4K UHD benchmark.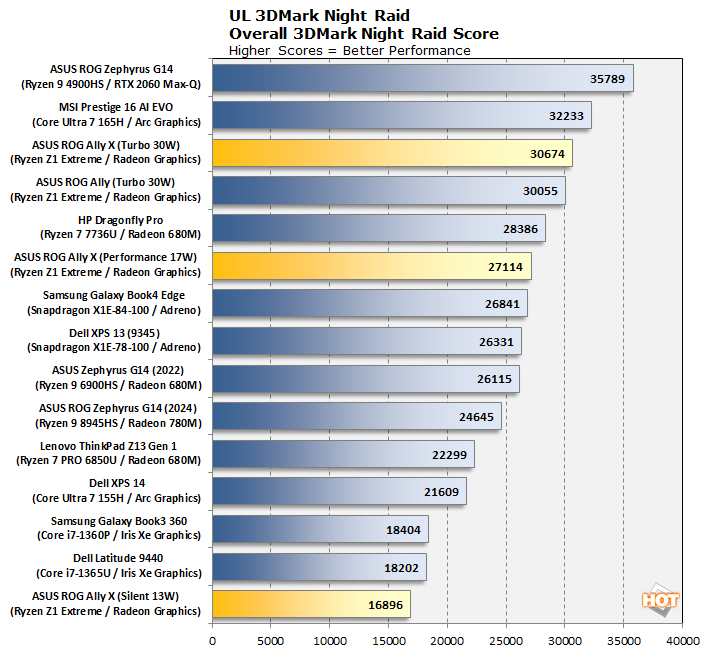
In the case of the Night Raid benchmark, we actually ran the test multiple times on each of the ROG Ally X's power presets to give an idea of how they affect gaming performance. The verdict? Turbo and Performance aren't so far apart, despite the 13W difference in power ratings. However, the 13W Silent preset really drops the throughput of the Ryzen Z1 Extreme's Radeon GPU.
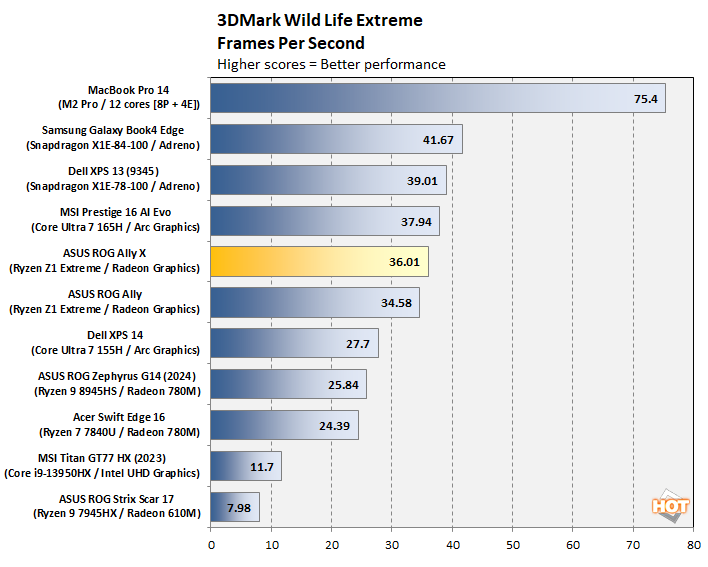
In the much more difficult Wild Life Extreme benchmark, we see the ROG Ally X casually defeat the original ROG Ally thanks to its faster onboard memory. It still loses out to the MacBook and its 256-bit memory interface, though. It also falls behind the two Snapdragon X Elite representatives as well as an Intel Arc integrated GPU, but will those performances hold up in real games?
Middle-earth: Shadow of War DirectX11 Game Benchmark
Shadow of War is more than a little long in the teeth at this point, but it still makes for a really quick and convenient DirectX 11 game benchmark. We make sure to have the game running at 1920×1080 and the "High" graphics preset before running the benchmark 3 times and averaging the results.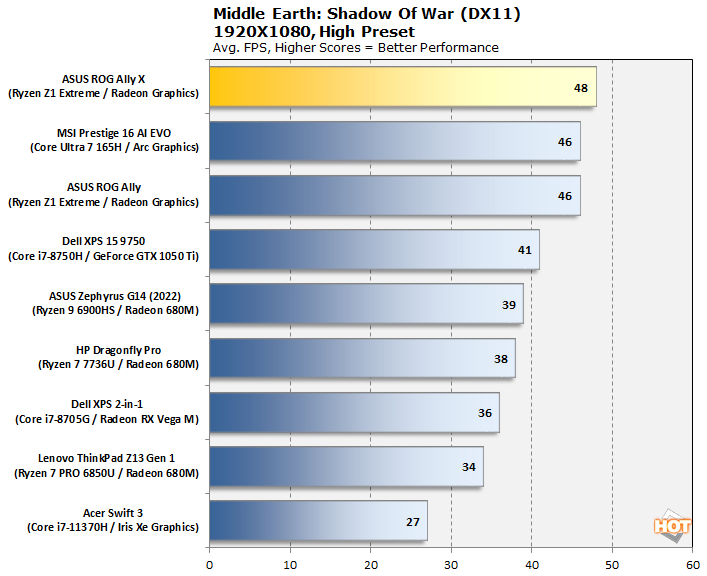
Well, would you look at that? The Ally X takes home an unambiguous (if small) win in our first real game benchmark. Of course, neither the Macbook nor the Snapdragon parts are here to put up a fight, but we'll spoil the result for you: emulation makes them struggle to compete with even the last-gen Radeon hardware.
Gears Tactics DirectX 12 Game Benchmark
Gears Tactics, released in 2020, still makes an excellent benchmark for integrated hardware like this. It's a tightly-optimized Unreal Engine title with a highly-configurable built-in benchmark that provides a wealth of performance data after each run. We tested it on High, Medium, and Low presets at 1920×1080 resolution.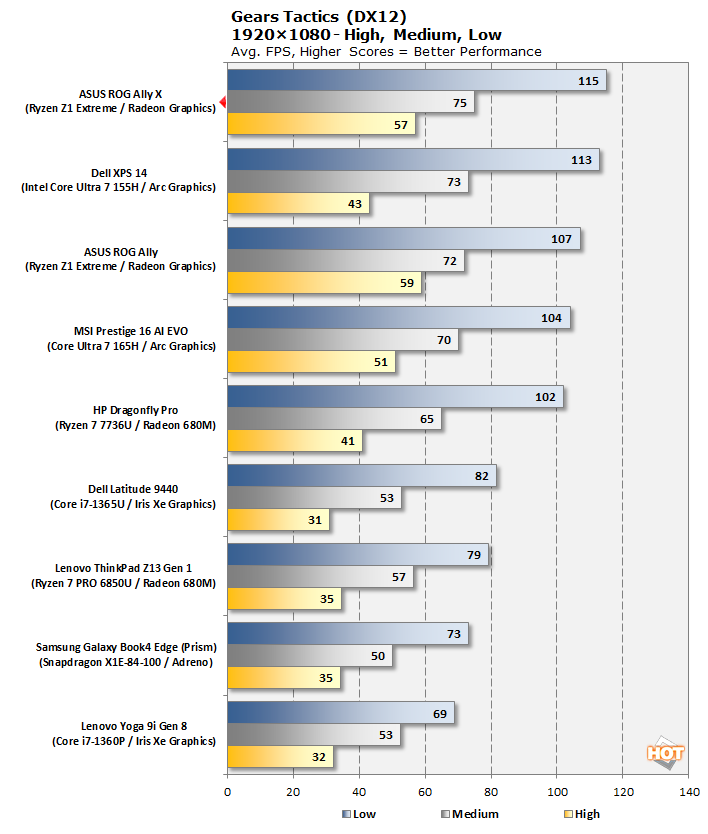
Here we have a second chart-topping result, this time including one of the Snapdragon parts. The Ally X is a step behind the original model on the high preset, but faster on the other two presets. Frankly, this game is a little bit variable in its benchmark and while we do perform multiple runs to help mitigate the effects of that, these results are basically a wash.
Next, let's head on over to the last page and let's wrap all this up...