AMD Ryzen Threadripper 7980X & 7970X Review: Many-Core Desktop Supremacy

In our custom LAME XP MP3 encoding test, we convert 16, large uncompressed WAV files to the MP3 format, which is a popular use case for many end users, to provide portability and storage of their digital audio content. The LAME engine is an open-source MP3 audio encoder that is used widely in a multitude of third party applications.
LAME XP Audio Encoding
In this test, we created 16-copies of our own 223MB WAV file (an 11 minute Grateful Dead jam) and converted it to the MP3 format using the multi-thread capable LAME XP tool. Processing times are recorded below, listed in minutes:seconds. Shorter times equate to better performance.
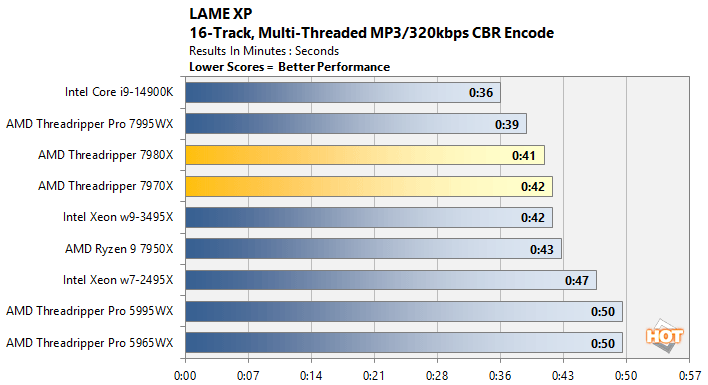
This test tops out at only 16 threads, and the LAME encoder run optimally on Intel's platforms, hence the Core i9-14900K taking the overall lead. The new Threadripper 7970X and 7980X, however, perform quite well and finish in the upper echelon, well ahead of the Zen 3-based, previous-gen Threadripper Pro 5000 series processors.
Blackmagic RAW Video Encoding Speed
The Blackmagic RAW Speed Test is a CPU and GPU benchmarking tool that tests full-resolution Blackmagic RAW video decode performance. The tool can be used to evaluate the performance at various resolutions and bitrates on the CPU or using OpenCL on a GPU. We're reporting two results here, both using 8K resolution, but at differing bitrates and compression levels.

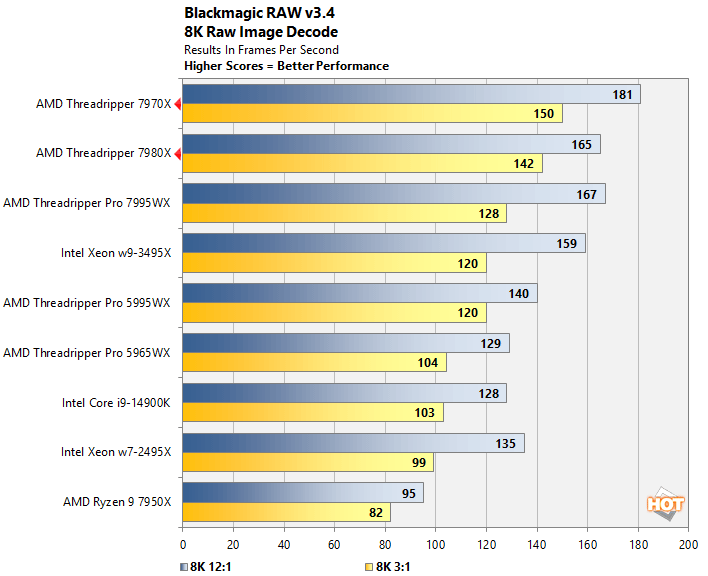
Once you get passed 32 cores / 64 threads with the Blackmagic RAW speed test, memory bandwidth and latency have a larger impact on performance in this test. Surprisingly, the 32-core Threadripper 7970X ends up topping the chart, with the 64-core Threadripper 7980X nipping at its heals.
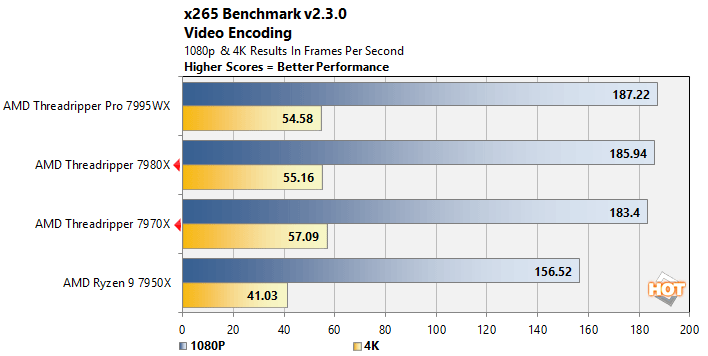
x265 Video Encoding Benchmark
The multi-threaded HWBOT x265 Benchmark is based on the open source x265 encoder that leverages modern CPU instructions to speed up video encoding. We tested the CPUs represented here with the 64-bit encoder using the default 1080p and 4K workloads.
The x265 video encoding benchmark is the only test we ran that requires enabling the High Precision Event Timer (HPET), and it too doesn't scale beyond about 32-cores / 64-threads. Unfortunately, enabling HPET on a few of the platforms also resulted in unexpected performance and behaviors, so we've omitted a number of systems from the chart. All that said, the Threadripper 7970X and 7980X, once again perform well and offer significantly more performance than mainstream platforms.
The x265 video encoding benchmark is the only test we ran that requires enabling the High Precision Event Timer (HPET), and it too doesn't scale beyond about 32-cores / 64-threads. Unfortunately, enabling HPET on a few of the platforms also resulted in unexpected performance and behaviors, so we've omitted a number of systems from the chart. All that said, the Threadripper 7970X and 7980X, once again perform well and offer significantly more performance than mainstream platforms.
Cinebench R23 Rendering Benchmark
Cinebench rendering performance test based on Cinema 4D from Maxon. Cinema 4D is a 3D rendering and animation tool suite used by animation houses and producers like Sony Animation and many others. It's very demanding of system processor resources and can utilize any number of threads, which make is an excellent gauge of computational throughput. This is a multi-threaded, multi-processor aware benchmark that renders and animates 3D scenes and tracks the length of the entire process. The rate at which each test system was able to render the entire scene is represented in the graphs below.
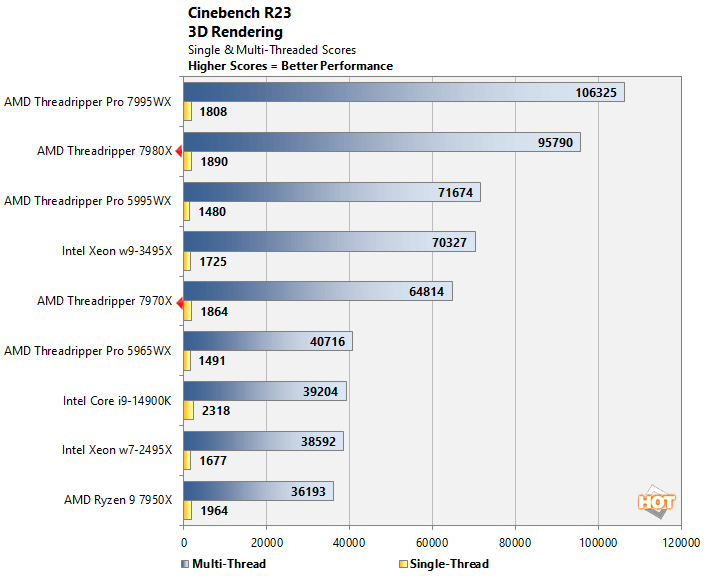
There's no catching the 96-core Threadripper Pro 7995X in Cinebench R23's multi-threaded benchmark, but the 64-core Threadripper 7980X isn't too far behind and it crushes the also 64-core, Zen 3-based Threadripper 5995WX. Core-for-core, the Threadripper 7970X also crushes its previous-gen counterpart, and the highest-end mainstream processors are left in their wake.
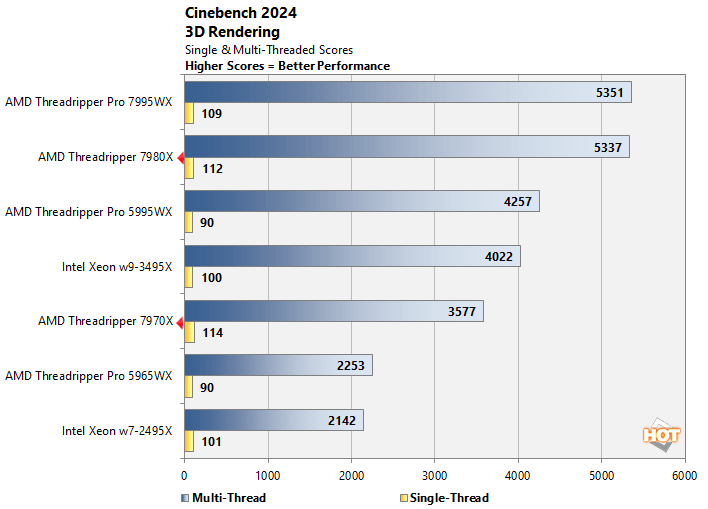
Cinebench 2024 3D Rendering Benchmark
The recently-released Cinebench 2024 benchmark tests GPU and CPU performance using Maxon’s Redshift render engine. The tool supports AMD and Intel x86/64 CPUs, Apple M1 and M2 SoCs, as well as Qualcomm's Snapdragon compute platform. Cinebench is based on the latest Cinema 4D 2024 and Redshift code using updated compilers (Clang) and has a minimum runtime activated by default. We focused solely on the single and multi-threaded CPU tests here.
The newer Cinebench 2024 benchmark is influenced more heavily by memory frequency and latency than R23, and we see our Threadripper 7980X rig effectively catching the Threadripper Pro 7995X in the Dell workstation we used for testing. Once again, the generational improvements the 7000 series has over the 5000 series is on display, with the Threadripper 7970X and 7980X clearly domination their previous-gen counterparts.
The newer Cinebench 2024 benchmark is influenced more heavily by memory frequency and latency than R23, and we see our Threadripper 7980X rig effectively catching the Threadripper Pro 7995X in the Dell workstation we used for testing. Once again, the generational improvements the 7000 series has over the 5000 series is on display, with the Threadripper 7970X and 7980X clearly domination their previous-gen counterparts.
POV-Ray CPU Ray Tracing Benchmark
POV-Ray, or the Persistence of Vision Ray-Tracer, is an open source tool for creating realistically lit images. We tested with POV-Ray's standard 'one-CPU' and 'all-CPU' benchmarking tools on all of our test machines and recorded the scores reported for each. Results are measured in pixels-per-second throughput; higher scores equate to better performance.
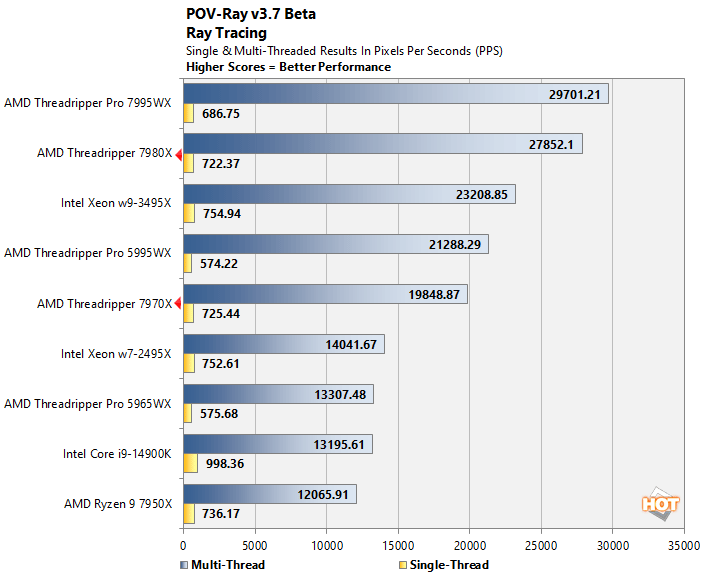
Our results with POV-Ray's single-and multi-threaded benchmarks continue the trend we've seen throughout most of the previous results. The Threadripper 7970X and 7980X perform relatively well in both tests, outpacing competitive processors with similar (or lower) core counts, and trailing only the ultra-powerful, 96-core Threadripper Pro 7995WX.
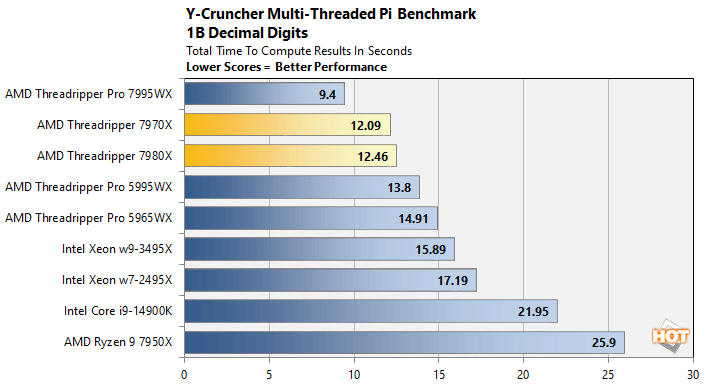
Y-Cruncher Multi-Threaded Pi Calculator
Y-Cruncher is a multi-core-capable tool that calculates the value of pi to a specified number of digits. In this case, we ran the tool on all threads and had the application calculate the value of pi to 1 billion digits. The values below are the time required to perform the calculation expressed in seconds. As a result, lower values indicate better performance.
Y-Cruncher doesn't scale linearly with more cores, and once again we see the 32-core Threadripper 7970X slightly outrunning the 64-core 7980X, but neither could catch the 7995WX. Still, the Threadripper 7970X and 7980X outpaced everything else.
Y-Cruncher doesn't scale linearly with more cores, and once again we see the 32-core Threadripper 7970X slightly outrunning the 64-core 7980X, but neither could catch the 7995WX. Still, the Threadripper 7970X and 7980X outpaced everything else.
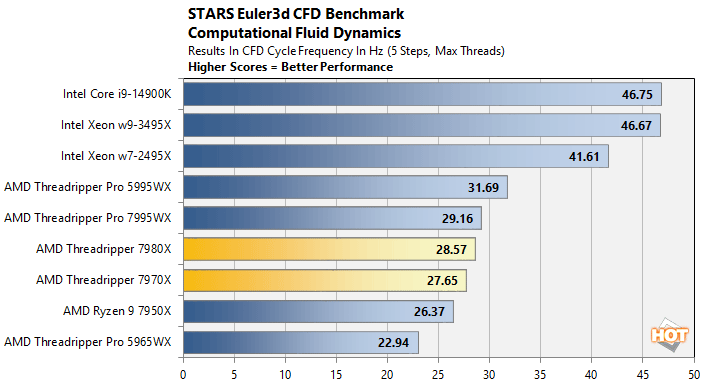
STARS Euler3d Multi-Threaded CFD Benchmark
STARS Euler3d is a computational fluid dynamics benchmark which uses a CFD grid that contains 1.23 million tetrahedral elements and 223 thousand nodes. The benchmark executable advances a mach 0.50 Advisory Group for Aerospace Research, or AGARD, flow solution for an aeroelastic test wing. The benchmark score is reported as a CFD cycle frequency in Hertz.
It's probably time to retire this benchmark—it's pretty old, doesn't scale properly on today's many-core processors, and heavily favors Intel's architecture.
This benchmark is multi-threaded, but is also dependent on platform bandwidth, and cache and memory latency, so the final results are not determined by compute performance alone. Cache sizes / speed and memory bandwidth all affect performance here...
It's probably time to retire this benchmark—it's pretty old, doesn't scale properly on today's many-core processors, and heavily favors Intel's architecture.