Ryzen 9 9950X And 9900X Review: AMD’s Flagship Zen 5 Chips Tested

For the 3DMark Physics test, we simply create a custom 3DMark run consisting solely of the physics test, which is multi-threaded and CPU dependent, and report the results...
UL 3DMark CPU Physics Benchmark
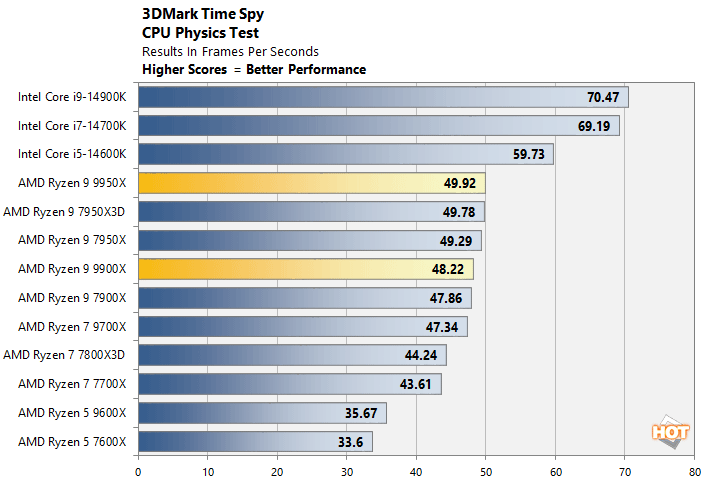
3DMark's Physics test heavily favors Intel's architecture, and as such, the 14th Gen Chips end up taking the gold, silver, and bronze here. The Ryzen 9 9950X and 9900X barely outrun their previous-gen counterparts, and finish withing a couple of frames per second of one another.
High And Low Resolution Gaming & Graphics Benchmarks
We also ran some mid and high-resolution game and graphics benchmarks on our test rigs with 3DMark, F1 2024, Final Fantasy XIV: Dawntrail and The Talos Principle 2. We used 3DMark's default Time Spy preset, and the games were run in two different configurations — either 1080p with Medium/High details, or 4K with High/Extreme details. The lower resolution tests are designed to be more CPU bound to better isolate processor performance, while the higher resolution tests are more GPU bound, where the CPU should have less of an impact.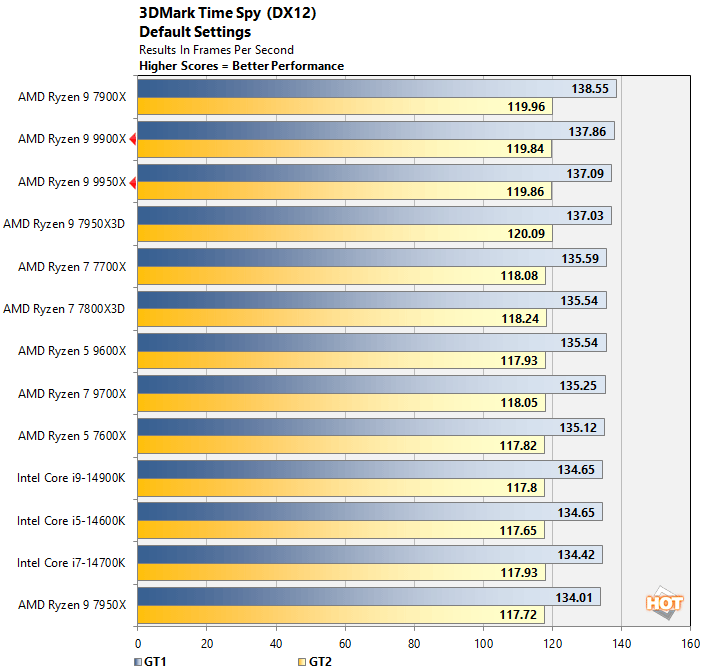
The Ryzen 9 9950X and 9900X perform relatively well in terms of actual frame rates, where there finish in the second and third positions behind the Ryzen 9 7900X. The deltas separating the chips are tiny though and fall within the margin of error in this benchmark.
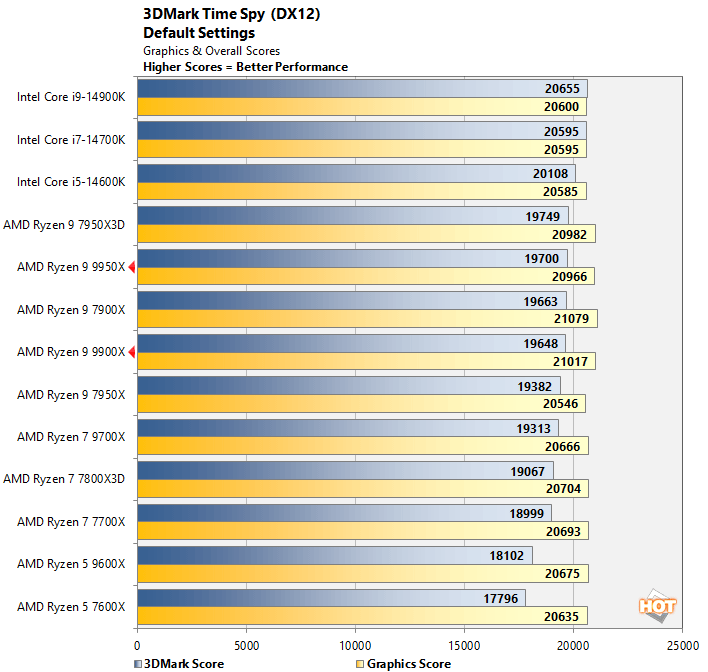
Because the CPU Physics score is factored into the overall 3DMark result, the Ryzen 9 9950X and 9900X drop down a few rungs, but again, we're talking about some small margins separating the top performers.
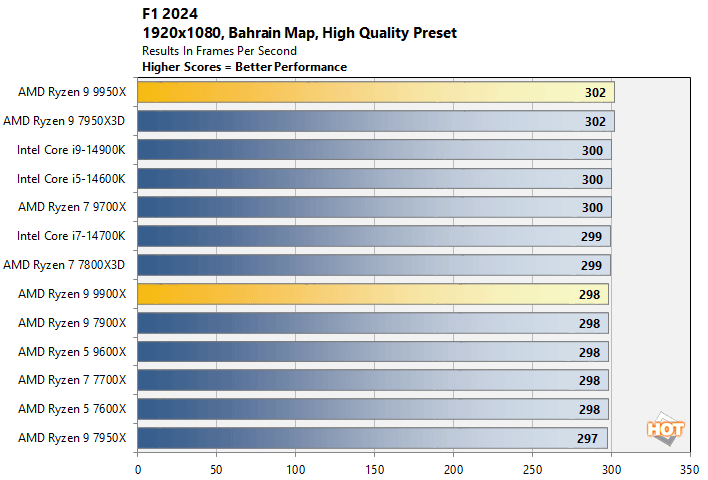
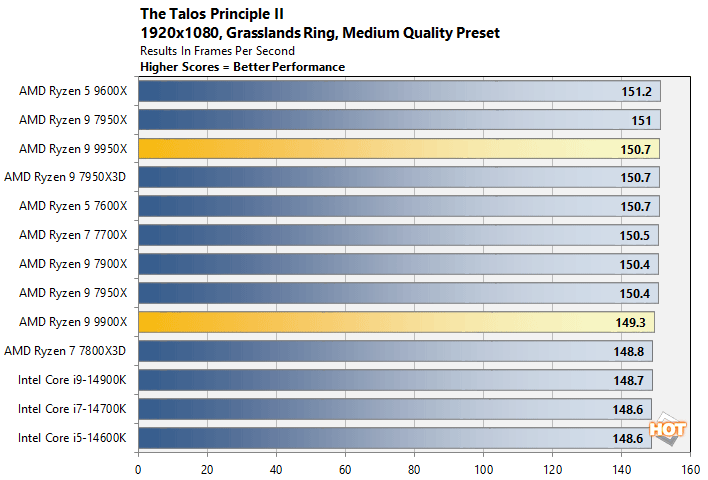
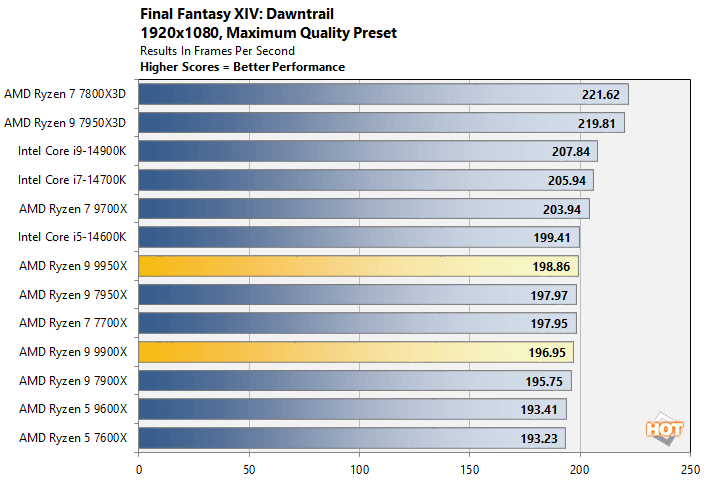
In our 1080p game tests, the Ryzen 9 9950X and 9900X technically perform well, but are ultimately uninspiring. The Ryzen 9 9950X does well in F1 and outperform the previous-gen Ryzen 9 7950X. The Ryzen 9 9900X, however, trades blows with the Ryzen 9 7900X depending on the game.
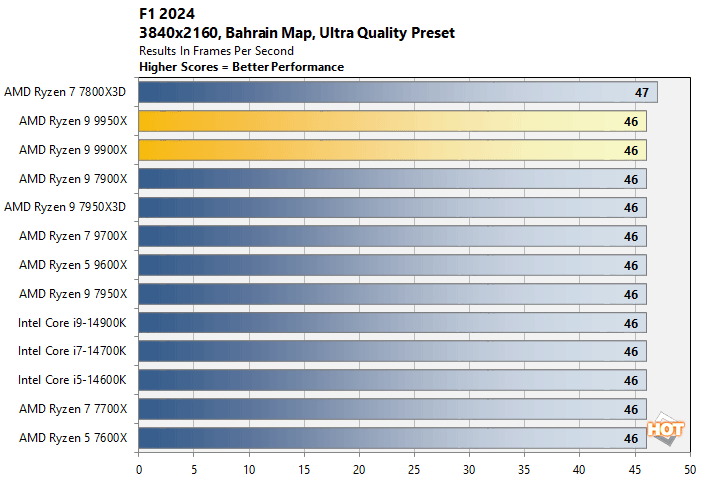
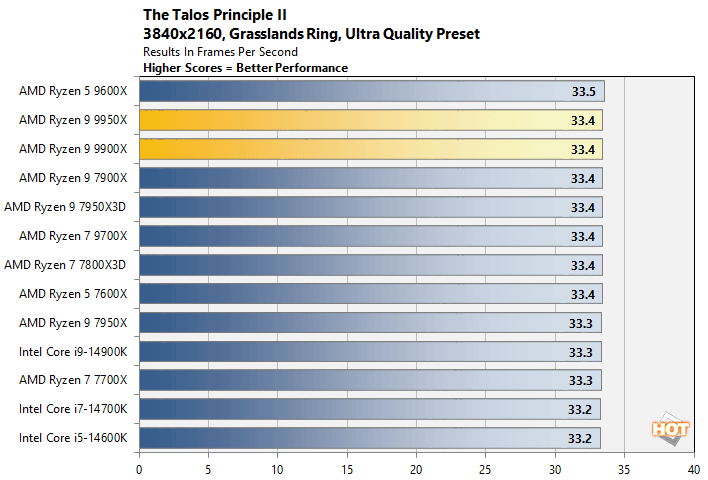
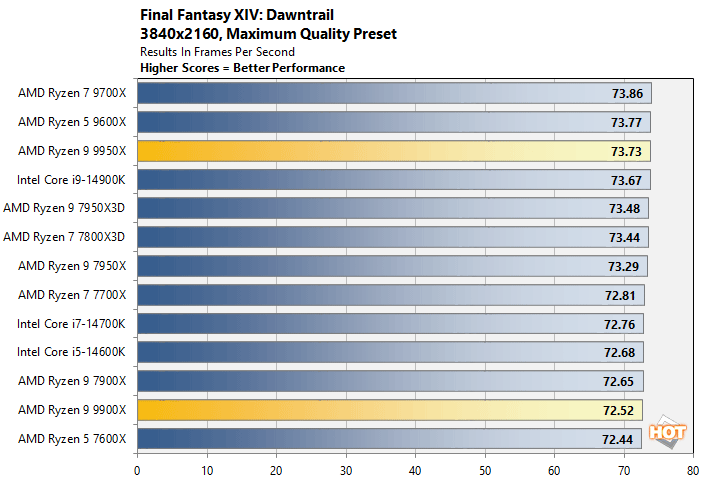
With higher image quality settings and the game resolution increased to 4K, frame rates level off and all of the platforms we tested performed similarly. The Ryzen 9 9950X and 9900X do technically perform well here, relatively speaking, but we're talking about small deltas once again. Overall, in terms of gaming performance, the Ryzen 9 9950X and 9900X don't seem to be much of an upgrade. It's probably best to see how the Ryzen 9000X3D chips perform if gaming is your primary concern.
AMD Ryzen 9000 iGPU Testing
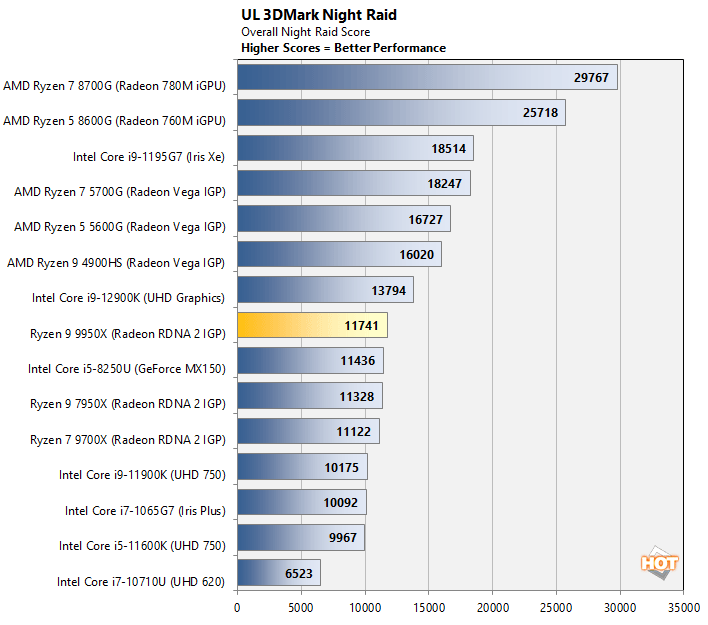
We also ran a couple of tests on the Ryzen 9 9950X using its integrated Radeon graphics engine, and compared it to a handful of numbers we had available from an array of other iGPUs, from both desktop and mobile platforms, from AMD and Intel.
If you recall, like the Ryzen 7000 series, the IO die in the Ryzen 9000 series features a basic RDNA 2-based iGPU with a couple of CUs. AMD positions the iGPU in the Ryzen 9000 series as a value-added feature that gives users the ability to configure a system or to diagnose potential problems when a discrete GPU isn't available. While it's a low-power iGPU to be sure, ultimately it's not missing many features from other RDNA2-based offerings. It's simply a cut-down RDNA 2-based GPU with two compute units and a similar media engine to mainstream Radeon 6000 series GPUs.

The iGPU in the Ryzen 9 9950X performs right on par with Ryzen 7000 series processors. Its score of 11,741 puts it ahead of Intel UHD series graphics from 11th Gen Core series processors, and on par with the older GeForce MX150, but it's obviously not a barn burner. It's not supposed to be one, though. We're just showing you what it can do. These Ryzen chips should ideally be paired to discrete GPUs whenever possible.
If you recall, like the Ryzen 7000 series, the IO die in the Ryzen 9000 series features a basic RDNA 2-based iGPU with a couple of CUs. AMD positions the iGPU in the Ryzen 9000 series as a value-added feature that gives users the ability to configure a system or to diagnose potential problems when a discrete GPU isn't available. While it's a low-power iGPU to be sure, ultimately it's not missing many features from other RDNA2-based offerings. It's simply a cut-down RDNA 2-based GPU with two compute units and a similar media engine to mainstream Radeon 6000 series GPUs.
The iGPU in the Ryzen 9 9950X performs right on par with Ryzen 7000 series processors. Its score of 11,741 puts it ahead of Intel UHD series graphics from 11th Gen Core series processors, and on par with the older GeForce MX150, but it's obviously not a barn burner. It's not supposed to be one, though. We're just showing you what it can do. These Ryzen chips should ideally be paired to discrete GPUs whenever possible.
AMD Ryzen 9000 Series Total System Power Consumption
Throughout all of our benchmarking and testing, we also monitored how much power our test rigs were consuming with a power meter. Our goal here is to give you an idea as to how much power each configuration used while idling at the Windows desktop and while under taxing CPU workloads across one or all cores. Keep in mind, this is total system power consumption being measured at the outlet and not the the individual power being drawn by the CPUs alone.
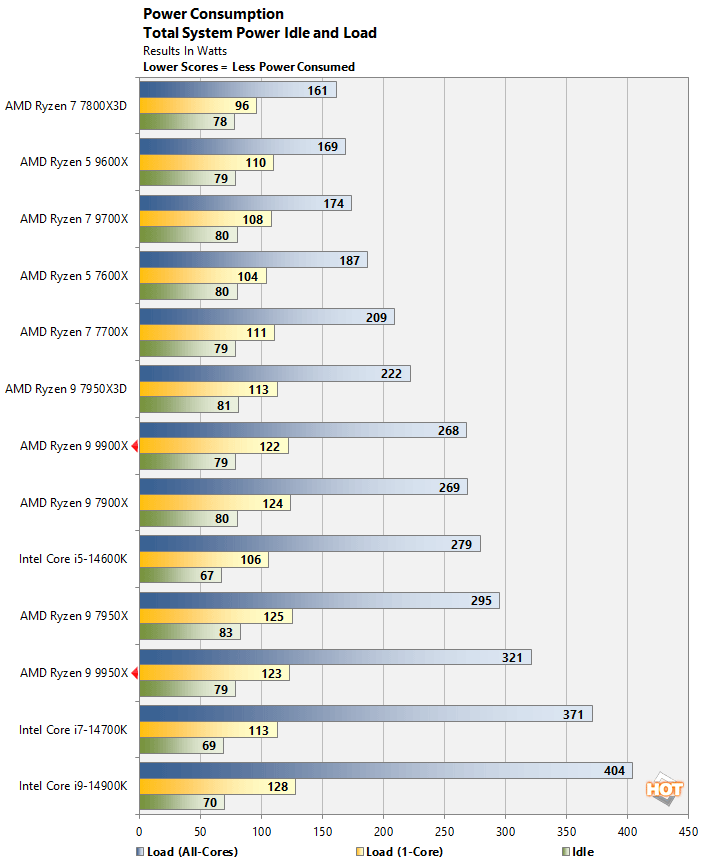
Our power consumption data is interesting. The Ryzen 9 9900X effectively consumes the same amount of power as the previous-gen Ryzen 9 7900X, despite technically having a lower TDP (120w vs. 170w). That fine considering the Ryzen 9 9900X is faster overall, which make the 9900X the more efficient processor. The Ryzen 9 9950X, however, consumed more power than the Ryzen 9 7950X, when all of its cores are fully taxed at least. The Ryzen 9 9950X is clearly faster than the 7950X, and will be more efficient with most workloads, but they all in the same ballpark.

Ryzen 9 9950X Hardware Details - 3DMark

How power, frequencies, and thermals are affected in a variety of workloads with the Ryzen 9 9950X is presented in the charts above. What you see here are frequencies, temps, and utilization over the course of a couple 3DMark Time Spy and PCMark Applications benchmark runs. The CPU clock shows relatively small variations, and remains in the 5.4GHz - 5.5GHz range whenever the CPU is under load, but it dips lower when not fully taxed. The CPU temperature also remains relatively low, and hovers mostly in the low-70°C / high-60°C range save for a small blip where it peaks above 80°C.