Cinebench R20 is the latest and greatest OpenGL-based rendering test from Maxon. It uses Cinema 4D's engine to draw a scene and measure how quickly a given CPU can complete the task, then converts that time to a score.
 |
Cinebench R20 |
3D Rendering Benchmark |
|
This version removes the animation test from its predecessor, R15, and the scene it renders is much more complex than before.
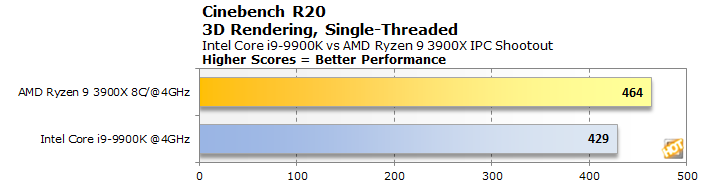
AMD's latest CPU ever so slightly edged-out Intel's latest and greatest in the single-threaded Cinebench R20 benchmark in our full review, even though at stock speeds it's at a major clock speed deficit. However, when the playing field is leveled at 4GHz and in this new version of the test, the
Ryzen 9 3900X takes a sizable 8% lead over the Core i9-9900K. Maybe these results explain why AMD touts Cinebench in all of its performance presentations.
 |
POV-Ray |
Ray Tracing Benchmark |
|
POV-Ray, or the Persistence of Vision Raytracer, is a free, open-source tool for rendering high-quality, 3D graphics. It demonstrates software-based ray tracing throughput on the CPU. We tested with POV-Ray's standard "one-
CPU" test on both of our test machines, and recorded the scores reported for each. Results are measured in pixels per second throughput. Higher scores equate to better performance.
Single-Threaded Performance
The Intel
Core i9-9900K turns the tables this time in POV-Ray and wins by around 7.5% over the Ryzen 9 3900X. That probably shouldn't come as a surprise, since in our full Ryzen review, Intel's processor bested AMD's by around 17%, which is far more than the clock speed advantage that the 9900K enjoys at stock.
 |
LAME MT |
Single-Threaded Audio Encoding |
|
In our custom
LAME MT MP3 encoding test, we convert a large WAV file to the MP3 format, which is a popular, day-to-day use case for many end users, to provide portability and storage of their digital audio content. LAME is an open-source audio encoder that can produce high-bitrate or variable bitrate MP3 audio files.
In this test, we created our own 223MB WAV file and converted it to the MP3 format using the multi-thread capable LAME MT application in single-threaded mode. Processing times are listed below in seconds. Shorter times equate to better performance.
Single-Thread Performance
In our original tests, the Ryzen 9 3900X lost soundly (no pun intended) to the Core i9-9900K, even in multi-threaded mode. The speedy single-threaded performance of Intel's CPU was more than the multi-threading scaling advantage on AMD's latest CPUs could overcome. The gap in single-threaded performance was around 30% there. When the CPUs are running at the same frequency in this test above, however, AMD cuts the deficit by a little less than half, though there's still a noticeable 17% difference between the two. Score this one for Intel.
 |
Y-Cruncher |
Pi Calculation Test |
|
Y-Cruncher is a multi-core-capable tool that calculates the value of pi to a specified number of digits. In this case, we ran the tool on a single thread and had the application calculate the value of pi to 500 million digits. The values below are the time required to perform the calculation expressed in seconds. As a result, lower values indicate better performance.
Single-Thread Performance
In our full review, we calculated pi to a billion digits using all the hardware threads each CPU had. In that test,
even the Ryzen 7 3700X bested Intel's Core i9-9900K, indicating that AMD should do well in our single-threaded tests. That indeed seems to be the case; when both CPUs were locked at 4 GHz, the AMD Ryzen 9 3900X beat the Intel Core i9-9900K by nine seconds, good for a 5% lead.
Next, we'll take a look at some CPU-bound gaming tests then make some sense of
all the numbers we've pored through in this review...