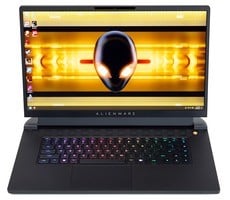
Alienware m17 R5 Review: AMD Advantage Gaming Laptop Shines
Before running any of our benchmarks, we apply all of the latest Windows and driver updates to the system we are testing. Our particular Alienware m17 R5 sample shipped with Windows 11 Pro and needed very little updating. Other than applying any available updates (like most consumers would), we run all of our tests with out-of-the-box settings. Our goal is to test the system as it ships, but after auto-updating, to accurately reflect what buyers can expect from a retail experience.

Alienware offers system performance tuning through its Command Center application. Users can customize fan speeds and power targets by hand, or use one of five different pre-defined performance profiles: Full Speed, Performance mode, Balanced mode, Battery Save mode, and Quiet mode.

In the interests of time, we simply benchmarked the system as it came out of the box, with the system on the default "Performance" profile. This may have had good effects on the system's gaming performance, but it is also partially responsible for the middling battery life results that we'll show you in a bit. Keep in mind, however, switching to a lower-performance mode like Battery Saver or Quiet, would increase battery life measurably.
Alienware m17 R5: System Thermal Performance Torture Test
Before we get into any kind of performance benchmarking, the first tests we do with every machine are stress tests. This lets us make sure that nothing went wrong in shipping or manufacturing and that the computer's parts are performing as expected. It would be a darn shame to do a raft of benchmarks only to find out that your GPU was thermal-throttling the whole time.

As usual, to stress test the system's thermals, we loaded up Prime95 and Furmark simultaneously. Now, on a laptop, we wouldn't normally recommend this, because this is a very quick recipe for thermal throttling. Most laptops are design to handle the "expected" average thermal output of their processors, not the maximum output over a sustained period. However, Alienware's materials for this laptop make much of its "Cryo-tech" cooling technology. This machine has significantly updated cooling performance versus its predecessors.
The company says that its new chassis "prioritizes performance", and that this model in particular, with the Radeon RX 6850M XT, uses the largest vapor chamber in Alienware's history—some 3.5x the size of the one in the m17 R4. Along with that, the CPU and GPU fans offer improved airflow, with the pair of squirrel-cage fans sucking air in the vents on the bottom and exhausting it out both sides and the back.
All of that seems to have come together in what we would call a great success. Even under a sustained Prime95 and Furmark load, the system maintained performance and avoided thermal throttling—despite overdrawing its power adapter by 10 watts. Indeed, draw from the wall during the stress tests was 250 watts, according to our Kill-a-Watt. Despite that, the SoC temperature topped out at 88°C and the GPU temperature peaked at 84°C.
ATTO Disk Benchmark
The boot drive on the Alienware m17 R5 that we received is a 1TB Samsung PM9A1, which is the OEM name for what Samsung otherwise calls the SSD 980 Pro. We've reviewed the SSD 980 Pro before, and found it quite fantastic for consumer usage, but we went ahead and ran ATTO to make sure everything is working as intended.
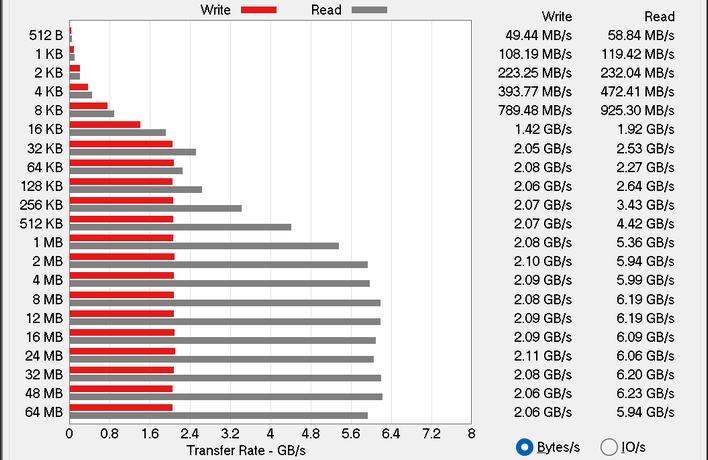
In our ATTO test, we found that the write performance of the drive seemed to be limited to approximately 2 GB/sec. This behavior was consistent across multiple tests and after a reboot, so we're confident in the result, but it is a little puzzling. Frankly, we doubt anyone would ever notice the difference, as client-focused workloads like gaming and desktop usage are much more focused on reads than writes, and after all, it's not like two gigabytes per second is exactly "slow."
Cinebench Rendering Benchmarks
Some companies may not like it, but Cinebench isn't a purely synthetic benchmark. It's based on a real application, Maxon's Cinema 4D modeling software, and measures rendering performance under that workload. We've recently moved to the R23 version of the application for our testing, so these are all fairly fresh results.
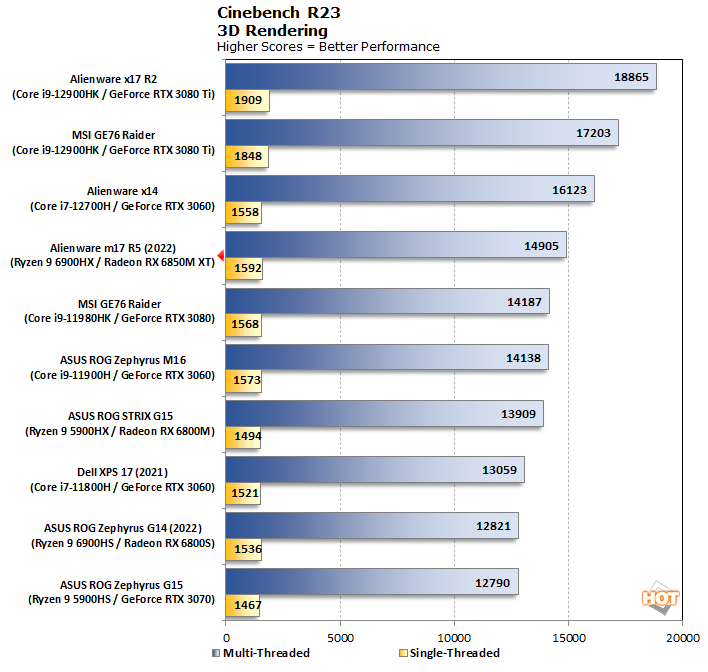
Unsurprisingly, the Alienware m17 R5's Ryzen 9 6900HX trails chips with more CPU cores in multi-threaded performance. It's still among the fastest processors in our test set, though. Moreover, it competes with Intel 11th- and 12th-gen processors on single-threaded performance, which is very impressive as Zen 3 desktop processors typically struggle to do so. This is one fast CPU.
Speedometer 2.0 Web-App Benchmarks
Speedometer is a test of web application performance. You know all those apps that run in a browser tab, like Slack, Discord, Google Docs, and even YouTube? Speedometer gives you a decent gauge of how those apps will run on a given system in a given browser. Indeed, results vary tremendously between browsers, and even between different browser versions. All of our tests here were done on the latest version of Google Chrome.
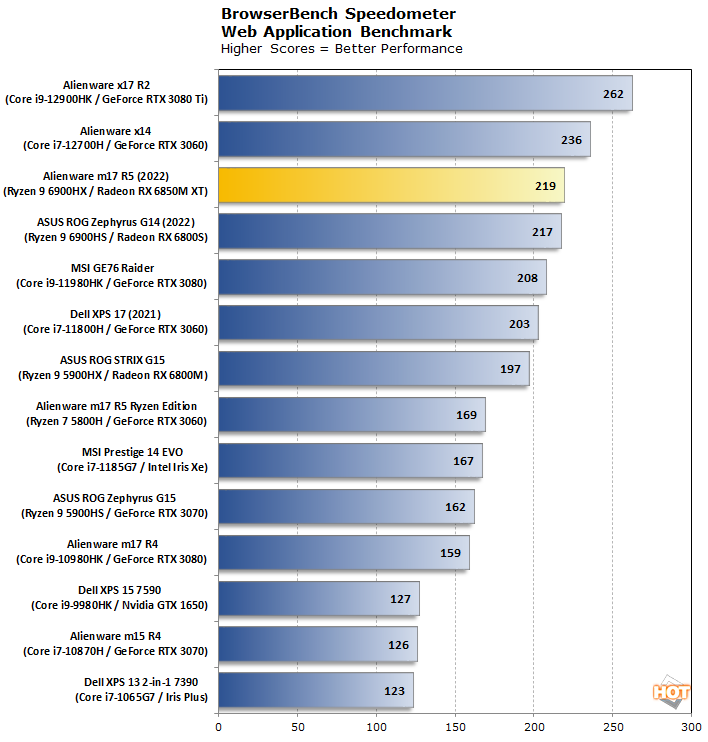
This result shouldn't surprise anyone familiar with the relative standing of these processors' single-threaded performance. The Alder Lake machines scream out in front, but AMD's Rembrandt is running right behind at the top of the pack otherwise. Naturally, web apps on the Alienware m17 R5 are smooth and responsive.
PCMark 10 System Benchmarks
Even after all these years, we've found that PCMark still gives a decent idea of what kind of performance you can expect in non-gaming applications. The latest version includes quite a few tests surrounding tele-conferencing functions—quite important in the new post-pandemic world. As with the rest of our benchmarks, we ran PCMark 10 three times, and took the mean of the results.
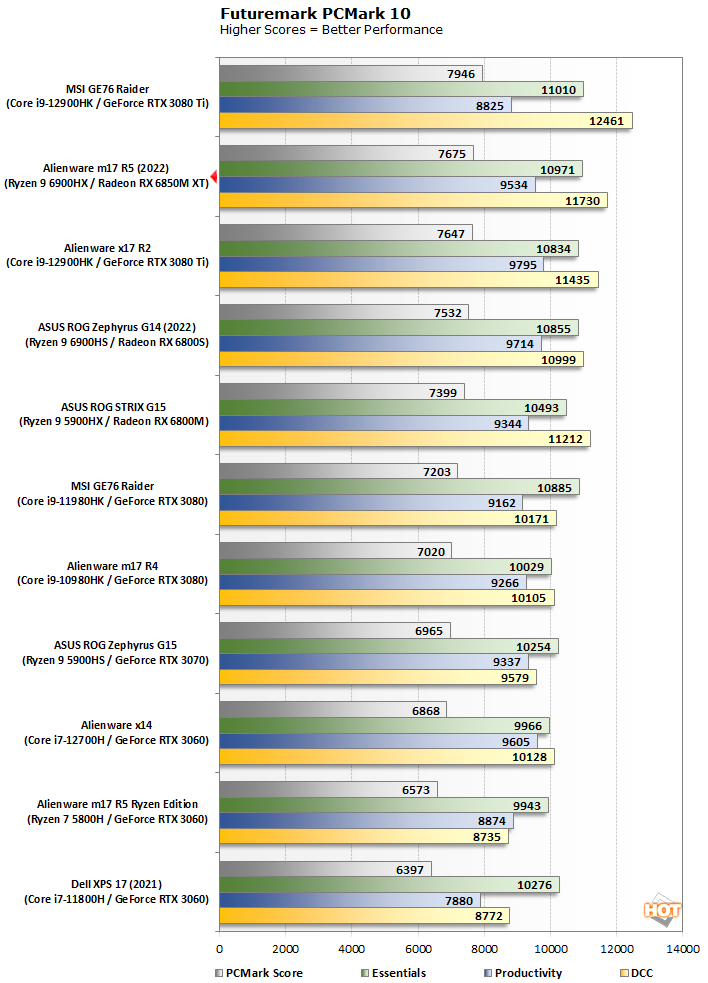
PCMark is quite a long test, and we think that the excellent cooling capability of the Alienware m17 R5 is contributing to its strong performance here. Incredibly, it barely beats out the x17 R2, also from Alienware, and that machine is equipped with an Alder Lake CPU and top-end mobile GeForce GPU. Very impressive stuff from AMD.
Geekbench 5 CPU Performance
Geekbench 5 is a cross-platform benchmark that tests single- and multi-core performance, and it does so primarily using intense, bursty workloads. These sorts of tests are arguably more representative of a typical client desktop usage pattern than something like Cinebench. Ultimately, it's similar to PCMark above, but doesn't run as long, which lets certain CPUs rise to the top more easily.
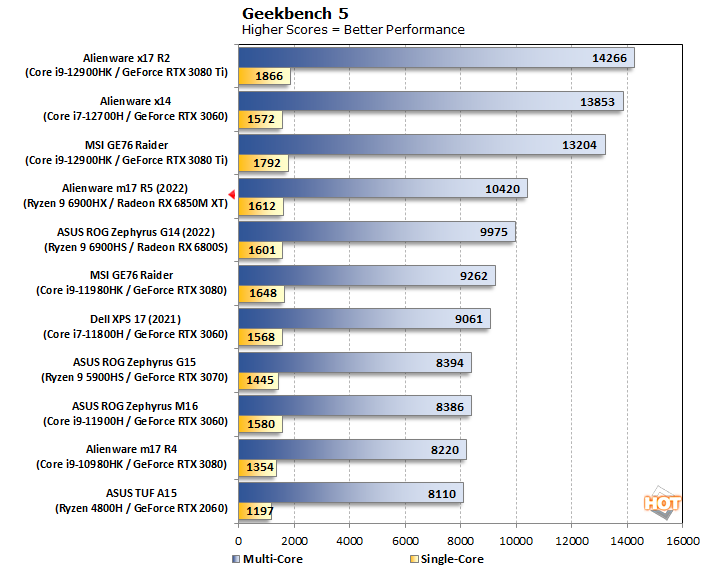
Those "certain CPUs" being Intel's Alder Lake. While AMD's Zen 3+ chip can't outpace Intel's power hungry 115-watt (peak) laptop CPU, it claws its way past everyone else in the stack, which is plenty to be proud of. Check out the impressive gains over the last-generation Ryzen 9 5900HS. Very cool stuff, AMD.
3DMark Graphics and GPU Tests
If you're somehow unfamiliar, 3DMark is a synthetic game-like benchmark for assessing gaming graphics (GPU) and physics (CPU) performance. This tool has a wide variety of tests and demos that target various types of performance to give a better picture of how a system will handle real games. We used Fire Strike Extreme to get an idea of how the system would run older games, Time Spy to test the system's DirectX 12 performance, and Port Royale to check ray-tracing readiness.
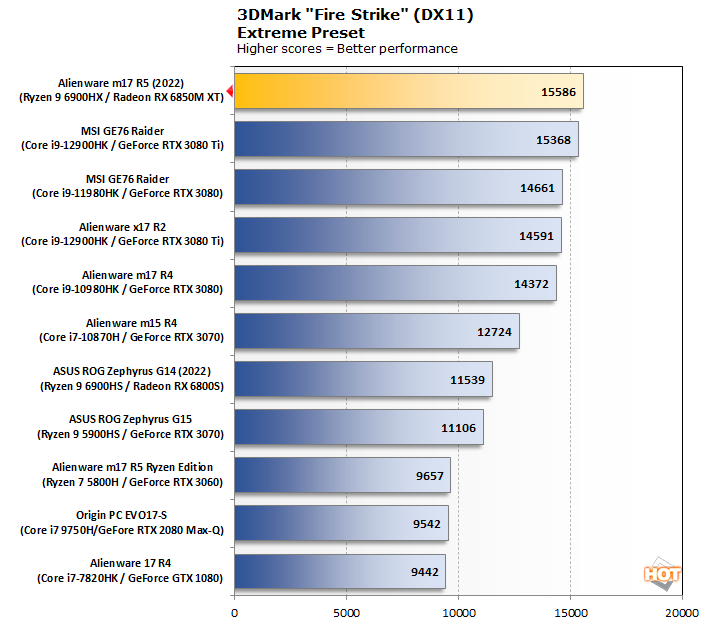
As is the case with the rest of our tests, this is the aggregate of three runs. Indeed, the Alienware m17 R5 rose to the top of our chart in Fire Strike Extreme. This is an incredibly impressive result, not only because the GeForce RTX 3080 Ti is more powerful than the Radeon RX 6850M XT on paper, but because traditionally, DirectX 11 performance hasn't been AMD's strong suit. However, the red team just re-wrote its entire DirectX 11 graphics driver, and we're testing on that updated driver. The results speak for themselves.
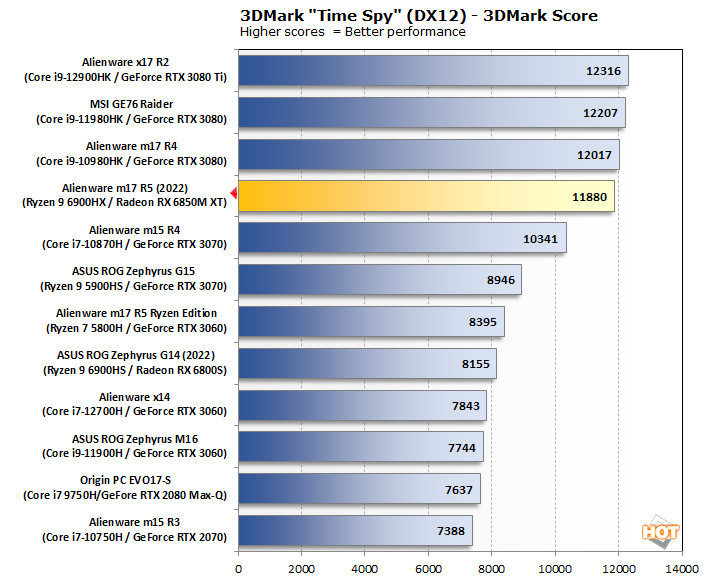
Performance in Time Spy is more along the lines of what we'd expect, which is to say that it's still amazingly good. In fact, one of our three test runs was a few points ahead of the m17 R4, but the aggregate came out just behind. While this isn't the world-beating performance we saw in DirectX 11, this is still an astonishingly good Time Spy result for a laptop.
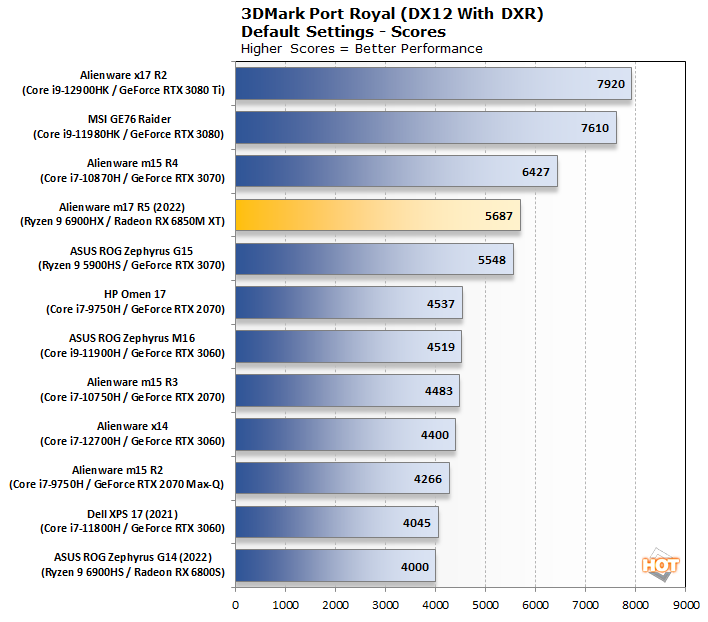
3DMark Port Royale is a test focused on DirectX Ray-Tracing (DXR) performance. Now, there's a bit of a narrative around the RDNA 2 architecture's ray-tracing performance. Sure, it's not as robust as competitor NVIDIA's ray-tracing performance; that much is plain to see from our results, where the RX 6850M XT falls down in the pack a bit to mingle with the mobile GeForce RTX 3070 cards.
This is still great performance in Port Royale though—enough to earn this machine a Steam achievement for its high frame rate in the test. Some folks talk as if Radeons can't "really" do ray-tracing, and that's simply not the case. You just need to be a little more conservative with the settings in DXR applications.
Gears 5 Game Benchmarks
Gears of War was a graphical tour de force when it released on the Xbox 360 in 2006. As the showpiece title for Epic's third full-number revision for Unreal Engine 3, it showcased stellar visual effects. Now, 16 years later, Gears 5 may not be quite the showpiece its ancestor was, but it's still a gorgeous game. We love this title for the detailed information it presents in its benchmark mode, as well as its excellent scalability.
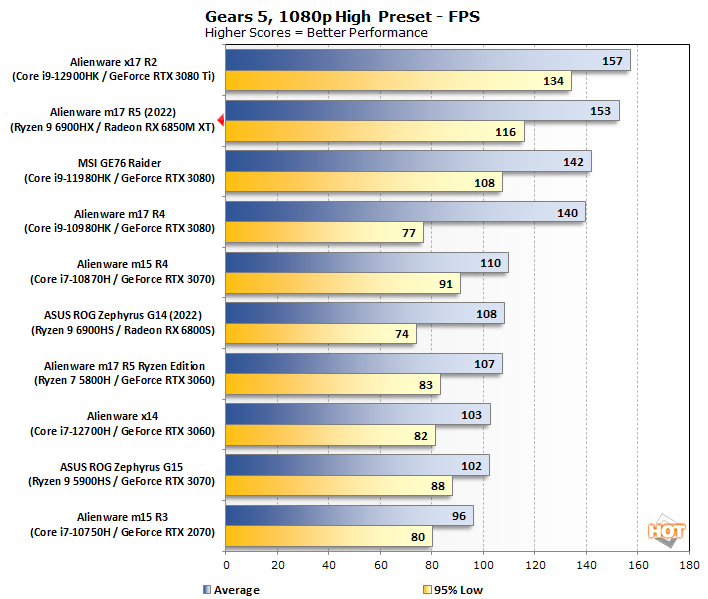
After seeing the 3DMark results above, it's no surprise that the Alienware m17 R5 blows past machines equipped with GeForce RTX 3080 cards here. Heck, it comes within spitting distance of the GeForce RTX 3080 Ti, which is a much bigger and thirstier GPU. The performance in this title is nothing short of astonishing, with the m17 R5 only occasionally dropping below the 120Hz refresh rate of its display.
Middle Earth: Shadow of War Tests
Middle Earth: Shadow of War is a fun and and beautiful title set in J.R.R. Tolkien's Lord of the Rings universe. To make sure we were testing every system on equal footing, we set the resolution to 1920x1080 and turned the visuals up to the High preset. The frame rates here are the average reported by the built-in benchmark; we don't report the minimum framerates as they can vary tremendously from run to run owing to the benchmark's non-deterministic nature.
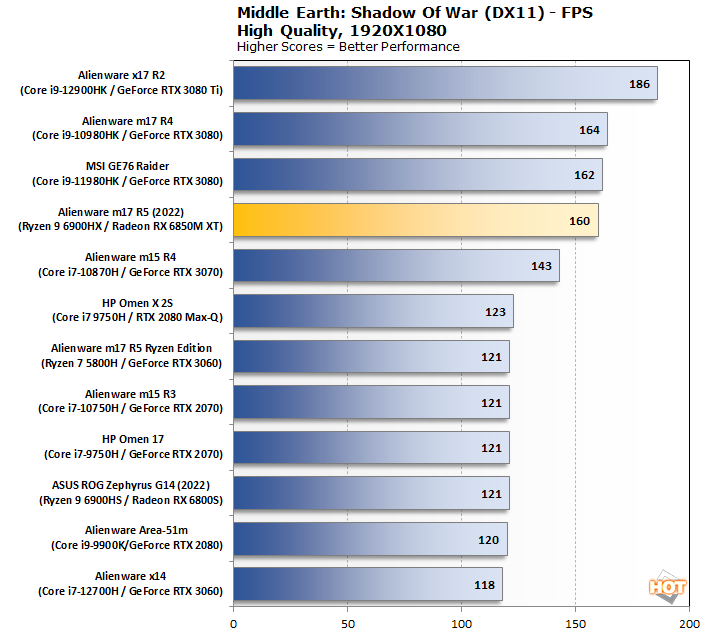
Performance in the slightly older Shadow of War wasn't quite as stunning as in Gears, but it's still excellent. The Radeon RX 6850M XT is trading blows with GeForce RTX 3080 parts and handily outpacing anything slower.
Shadow of the Tomb Raider Benchmarks
The finale in the rebooted Tomb Raider trilogy, Shadow of the Tomb Raider is easily the best-looking of the bunch. It's also brimming with the latest technology, including ray-traced shadows as well as Tobii eye-tracking hardware support. To test this game out, we cranked the visuals up to the "Highest" preset.
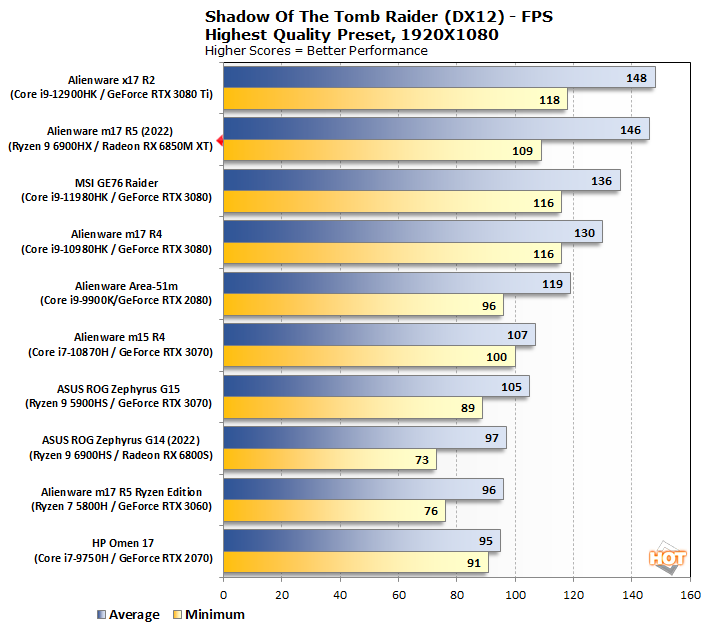
Remember what I was saying earlier about how RDNA 2 Radeons' ray-tracing performance gets a bad rap? The lower minimum framerate here is in a section of the benchmark that makes heavy use of ray-traced shadows. It might look bad on this chart, but we invite you to examine the actual numeral value: 109 FPS! Shadow of the Tomb Raider runs very well on the RX 6850M XT, even with ray-tracing on.
F1 2021 Benchmarks
F1 2021 is no longer Codemaster’s latest Formula One racing simulation now that F1 2022 is out, but we have comparison data for this game, and not that game. This title still supports DirectX 11 or DirectX 12, and it incorporates support for a number of AMD's FidelityFX and NVIDIA technologies (like DLSS), though we didn't enable any of them to keep the playing field level. We tested the game with its Ultra High graphics preset, including the ray-traced shadows and reflections that it enables.
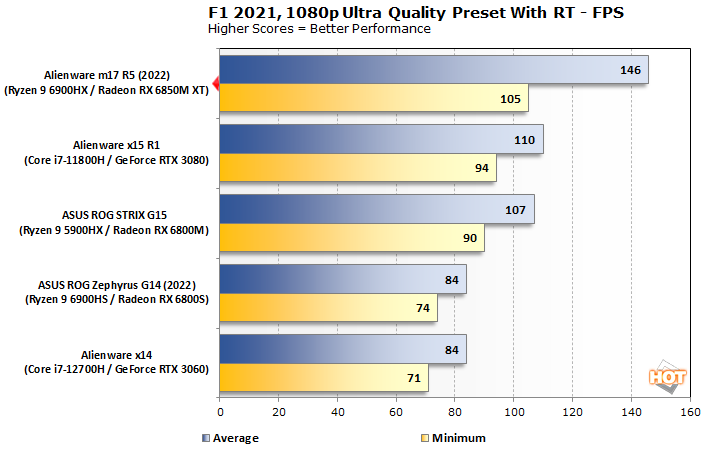
Now, Codemasters' games have always favored Radeon cards, but this result is pretty surprising. We expected that the Radeon RX 6850M XT would outpace a mobile GeForce RTX 3080 in this game, but we didn't expect that it would be by nearly a third. This result stayed consistent across multiple benchmark runs, so we're confident in it. If you want to play F1, get a Radeon.
Guardians of the Galaxy Benchmarks
Marvel’s Guardians of the Galaxy is an action-adventure game that puts you in the boots of unwitting hero Star-Lord and has you lead the rest of the Guardians from mission to mission. This is thoroughly a modern title, with its minimum requirements calling for a Radeon RX 570 or GeForce GTX 1060-class GPU. Naturally, the game also supports some of the latest graphics technologies, including DXR and DLSS—though we didn't use the smart upscaling tech in our testing to keep the playing field level.
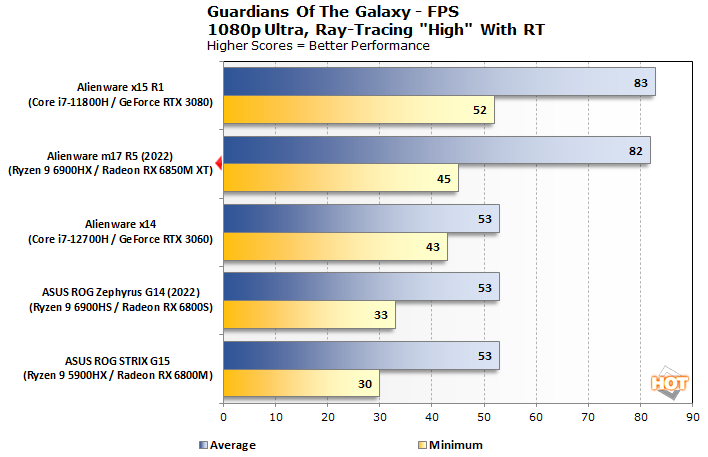
With the ray-traced effects enabled, the mighty Radeon RX 6850M XT is humbled slightly—but only slightly. The performance in this benchmark is still fantastic, and the game looks amazing at these settings. Its anti-aliasing really helps to smooth over the relatively low resolution, and if you wanted, you could employ Radeon Super Resolution to upscale the image to the 4K display.
Radeon 680M Integrated Graphics Gaming Tests
Now, the Radeon RX 6850M XT in this machine is extremely potent; we think we've proven that beyond a shadow of a doubt with the results above. However, this system also includes another RDNA 2-based Radeon GPU, and that's the Radeon 680M built into the Rembrandt APU. We'll talk more about this on the next page, but the Rembrandt APU handles graphics processing duties until GPU load hits a certain point, at which the the mux on the motherboard will switch inputs to accept video data from the discrete Radeon instead.
However, if you wanted to save battery power while playing less-intense games, you absolutely could do so. The Radeon 680M IGP is exactly as capable in terms of features as the Radeon RX 6850M XT—the only difference in the two is performance. Now, there's a huge gulf between the two GPUs, but the point is that the only thing keeping you from playing whatever game you want on the Radeon 680M is its performance. Naturally, we had to run some benchmarks on the integrated GPU to see what it could do.
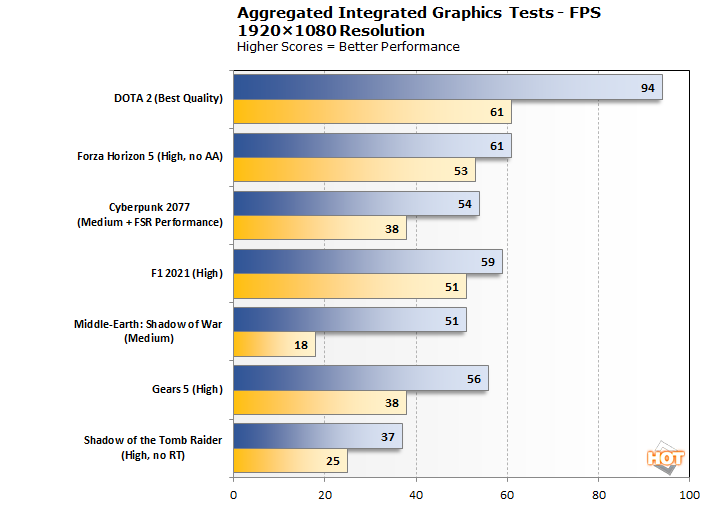
Not bad, huh? Yes, it's true—the integrated graphics on this laptop will legitimately give you a better gaming experience than a PlayStation 4, as silly as that is. Standout results here for us include Forza Horizon 5 and Gears 5. Both games are eminently playable at these settings and still look great.
If you wanted a higher framerate, you could make use of upscaling, like Radeon Super Resolution or FidelityFX Super Resolution 2.0 when more games start to support that tech. You also could drop game settings in some of these titles, although we found that it really didn't make much difference in games like Shadow of War and Gears 5.
Native 4K UHD Gaming Tests
Native 4K UHD Gaming Tests
On the flip side of things from the Radeon 680M, we had to test the full power of the Radeon RX 6850M XT as well. Most of our gaming tests on laptops are done at 1080p for a couple of reasons. For one, the majority of laptops, even gaming laptops, don't target ultra-high resolutions like 4K. Moreover, even powerful gaming laptops often come with 1080p screens because the extra pixel density of a higher-resolution LCD just isn't needed for a gaming workload. It's also much easier to make a high-refresh LCD at a lower resolution.
However, for a laptop like this, as powerful as it is, we felt that it would be a bit of an injustice to just leave it there. As such, we booted up some games at the full 3840×2160 native resolution of our built-in display and did some benchmarking.
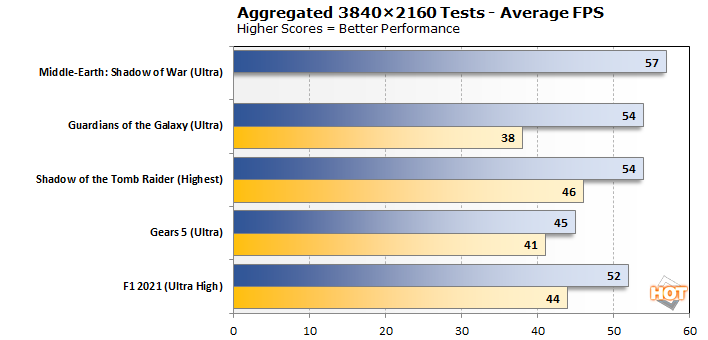
The Alienware m17 R5 is not only one of the fastest gaming laptops we've ever tested, but rests in the upper echelons of gaming systems, period. Sure, the mobile Radeon has more in common with a desktop RX 6750 XT than an RX 6800 XT—it's even detected as such by Furmark—but that's still a massive amount of performance to carry around in a backpack. Let's take a look at a few more things and then wrap it all up.