Intel NUC 13 Extreme PC Review: Raptor Canyon Pushes Limits
Intel’s Visual BIOS can be navigated using either a mouse or keyboard (or touch with a compatible display). It is home to array of information about the processor and memory configuration, as well as other system specifics, integrated peripheral controls, hardware-health data, and power and performance related toggles.


Intel NUC 13 Extreme Dragon Canyon BIOS Menus
All of the integrated peripherals can be enabled / disabled from within the Visual BIOS, fan curves can be tweaked should you want to dial-in a specific thermal or acoustic profile, and there are a handful of power related options available, should you want to fine-tune the system’s power characteristics, which in turn will affect performance.
For our testing, after updating, we left the NUC 13 Extreme's BIOS at its optimal defaults, which has "Energy Efficient Performance" mode enabled. This mode configures PL1 to 150w and PL2 to 250w, which will somewhat limit the Core i9-13900K versus a full-sized desktop build with larger cooler, but as you'll see shortly, not by much.
The Raptor Canyon NUC 13 Extreme’s BIOS is easy to use, but has many enthusiast-level features, and it mimics what Intel used to offer in its full-sized HEDT motherboards, minus a few advanced overclocking-related options.
SiSoft SANDRA 2021 Benchmarks
Due to the NUC 13 Extreme's smallish-form-factor, and its cooling and power limitations versus full-blown desktop systems, figuring out exactly where it fits in terms of performance presents some difficulties. As such, to paint as clear a picture as possible, we decided to compare its performance to an array of powerful notebooks, full-sized desktop systems, and previous-gen NUCs where we had data available.
We began our testing with the latest version of SiSoftware's SANDRA 2021, the System ANalyzer, Diagnostic and Reporting Assistant. We ran two of the built-in sub-system tests that partially comprise the suite with the NUC 13 Extreme, CPU Arithmetic and Multimedia.
We began our testing with the latest version of SiSoftware's SANDRA 2021, the System ANalyzer, Diagnostic and Reporting Assistant. We ran two of the built-in sub-system tests that partially comprise the suite with the NUC 13 Extreme, CPU Arithmetic and Multimedia.


| Intel Core i9-13900K Processor Arithmetic |
Intel Core i9-13900K Multi-Media |
SANDRA's CPU Arithmetic benchmark shows the Core i9-13900K in the NUC 13 Extreme performing very well, but ultimately trialing the same desktop CPU when installed in a system with more cooling capacity (which in turn unlocked higher power levels). In the Arithmetic test, the system put up over 639GOPs of aggregate native performance and in the Multimedia test, the system exceeded 2Gpix/s. While those numbers are slightly off from the Core i9-13900K in full review of the processor, they smash the Core i9-12900 scores from the NUC 12 Extreme (which were roughly 80% lower).
Speedometer 2.0 Browser Benchmark
We recently moved on to BrowserBench.org's Speedometer test, which takes a holistic look at web application performance. This test automatically loads and runs several sample webapps from ToDoMVC.com using the most popular web development frameworks around, including React, Angular, and Ember.js. This test is a better example of how systems cope with real web applications, as opposed to a pure JavaScript compute test like JetStream. All tests were performed using the latest version of the Chromium-based Edge browser.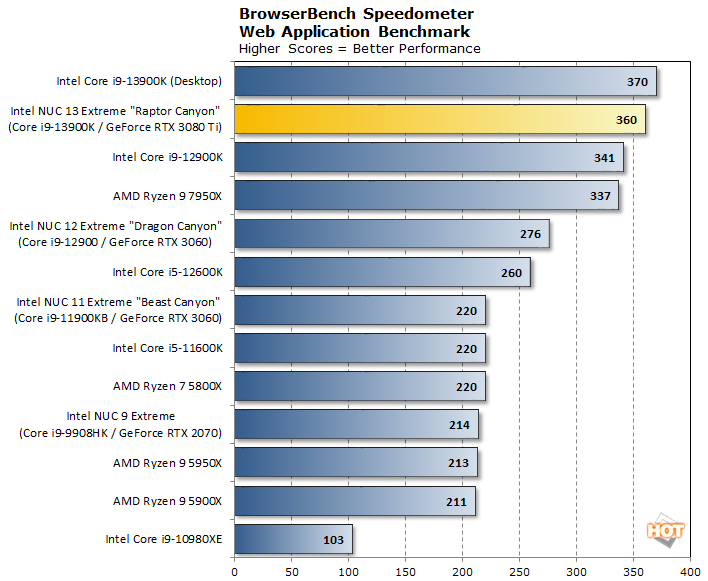
Cinbench 3D Rendering Benchmarks
Cinebench provides a glimpse into the system's parallel compute throughput. The tests are based on Maxon’s Cinema 4D modeling software that’s used in movie production studios...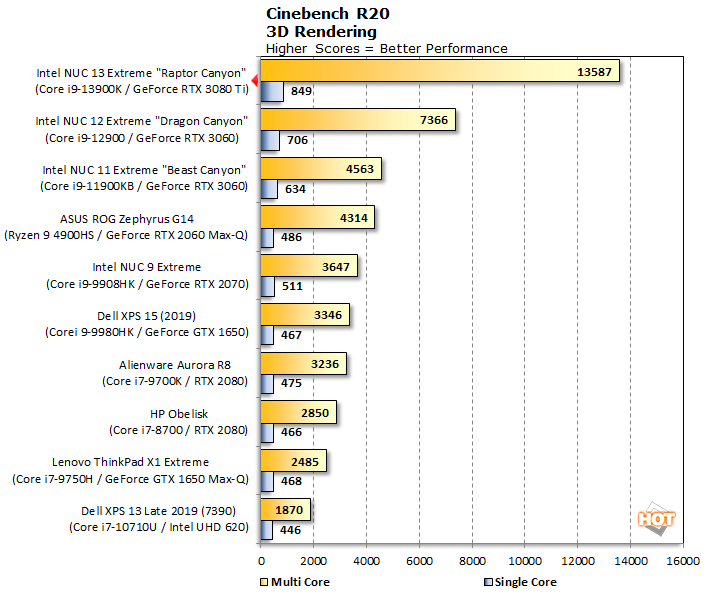
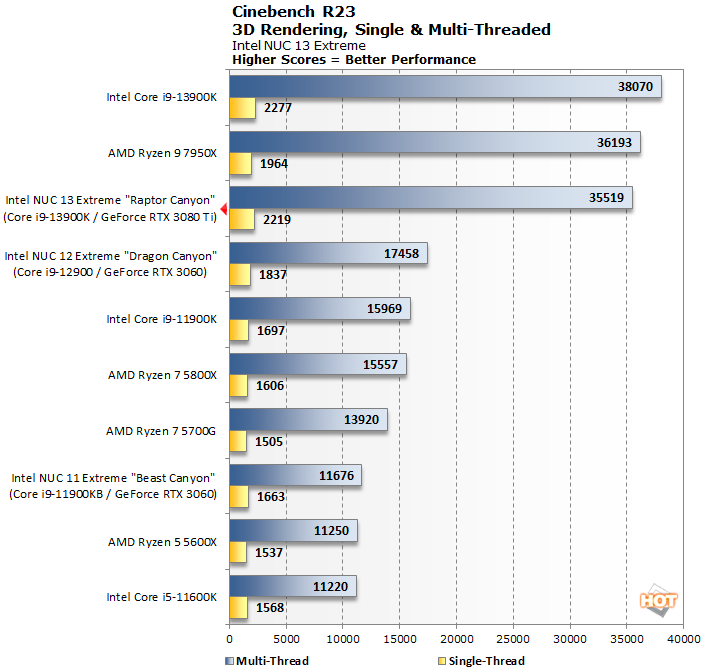
We're mixing up the systems here for the newer Cinebench R23 scores. Versus all of the latest platforms, the Core i9-13900K in the NUC 13 Extreme continues to perform well, nearly catching the Ryzen 7 7950X.
Geekbench 5 Benchmark Results
Geekbench 5 is a cross-platform benchmark that simulates real world processing workloads in image processing and particle physics scenarios. We tested the systems here with Geekbench 5’s single and multi-core test workloads.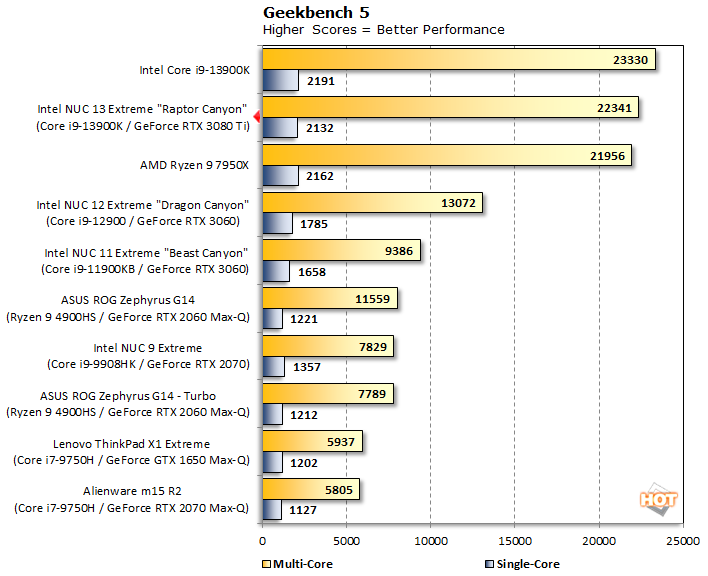
UL PCMark 10 System-Level Benchmarks
UL benchmarks have been popular go-to system level tests since the late ‘90s, when they were made by MadOnion and later Futuremark. We ran the NUC 13 Extreme through PCMark 10, which is designed to gauge the system's performance in common, everyday computing tasks with GPU-acceleration enabled, and with 3DMark tests on the next page to assess its graphics and gaming chops.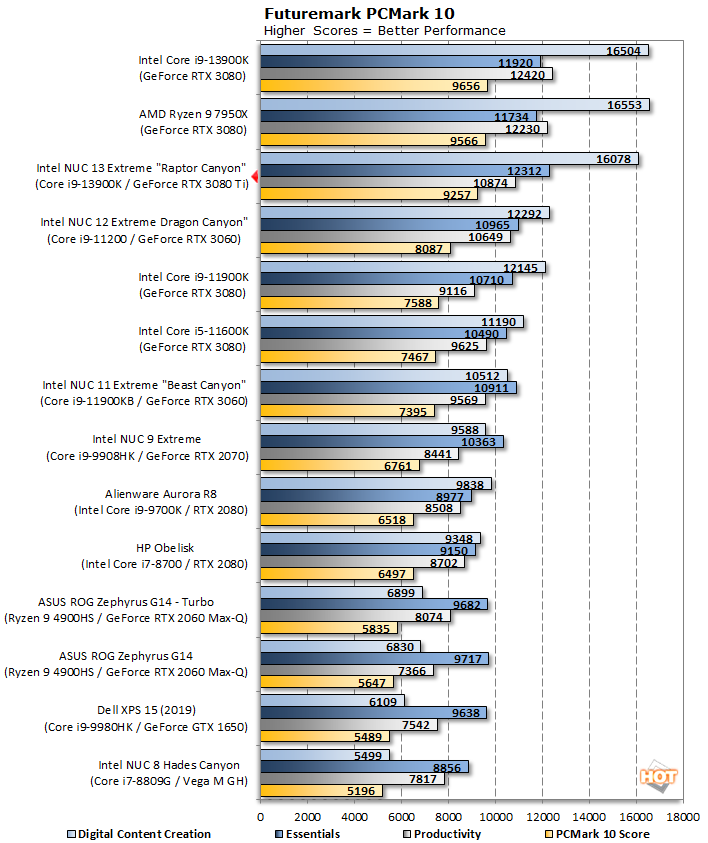
In PCMark 10, the Core i9-13900K powered NUC 13 Extreme cruised past all of the previous-gen NUCs by relatively wide margins. The system hangs with the full-sized desktops yet again, trailing the Ryzen 7 7950X by only a few percentage points. Here too you can clearly see how the lower power levels afforded to the Core i9-13900K in the NUC 13 Extreme affect performance versus the unrestrained Core i9-13900K in our CPU testbed.