|
By,
Dave Altavilla
February 1, 2004

We took another
look at Video Encoding performance with Windows Media
Encoder 9. Windows Media Encoder 9 is both SSE
optimized and makes use of Hyperthreading.
 |
|
Windows Media Encoder 9 |
|
Digital Video Encoding Test |
|
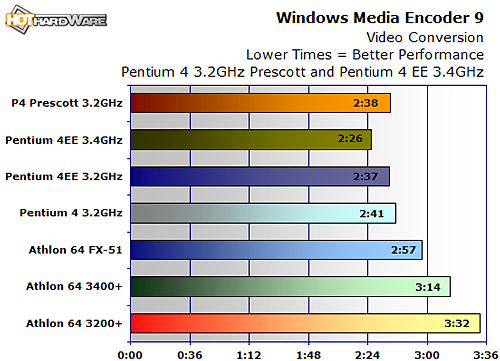
In this test, we
took a 416MB Digital Video file and encoded to WMV9 format.
Times were recorded in minutes and seconds. Lower
times indicate better performance.
First things
first, this is obviously a Pentium 4 optimized application
and all our P4 chips here left the Athlons in the dust.
The 3.2GHz P4 Prescott CPU just sneaked past the 3.2GHz
Northwood and fell in right behind its Extreme Edition
counterpart. The 3.4GHz P4 EE clearly takes the lead
with its high clock speed and 2MB L3 cache, besting the next
fastest score by a solid 11 seconds. When you are
processing large video files like we used in this test (the
clip is only a bit over 2 minutes long however), those extra
seconds can begin to add up quickly.
|
|
|
Cinebench 2003 Performance Tests |
|
3D
Modeling and Rendering Tests |
|
The Cinebench
2003 benchmark is an OpenGL 3D rendering performance test,
based on the commercially available Cinema 4D application.
This is a multi-threaded, multi-processor aware benchmark
that renders a single 3D scene. The time it took each
test system to render the entire scene is represented in the
graph below (listed in seconds). We ran two sets of
numbers, one in single thread mode and one in the
benchmark's multi-threaded mode, for our Hyperthreading
capable P4 test systems.
Surprisingly,
the P4 3.2GHz Prescott CPU falls apart here, losing handily
to the 3.2GHz Northwood and almost to the Athlon 64 3200+.
Clearly the benchmark isn't benefiting much from larger
cache sizes, since the P4 Northwood and Extreme Edition
cores are neck and neck, clock for clock. The results
scale accordingly in the Multi CPU test, where Prescott
falls well behind again.
|
|
|
SPEC Viewperf |
|
3D
Modeling and Rendering Performance |
|
We'll have a
look now at something a little more diverse and "industrial
strength" with SPEC Viewperf version 7.1. Viewperf 7.1
draws performance metrics on many data-points in several
different OpenGL based applications from various ISVs
(Independent Software Vendors). The SPECopc (SPEC OpenGL
Performance Characterization) project group is comprised of
companies like 3DLabs, Intel, AMD, NVIDIA, ATi,
Dell, IBM, SGI, Sun Micro as well as others,
and helps define and endorse what application viewsets are
used in the SPECviewperf test.
Currently, there are six
standard SPECopc application viewsets:
(courtesy
SPEC.org)
-
3dsmax-02, based
on SPECapc for 3ds max 3.1 configured with the Open GL
driver, includes three models containing an average of 1.5
million vertices each, and tests performance of scenes
with different levels of lighting.
-
dx-08, based on
IBM's Data Explorer application, has 10 different tests.
-
drv-09, based on
Intergraph's DesignReview model review package, has five
different tests.
-
light-06, based
on Discreet's Lightscape radiosity application, has four
tests.
-
proe-02, based on
SPECapc for Pro/ENGINEER 2001, measures two models in
three modes - shaded, wireframe and hidden-line removal (HLR).
-
ugs-03, based on
SPECapc for Unigraphics V17, tests performance based on an
engine model containing 2.1 million vertices.
Where Prescott
may have fallen down in the Cinema 4D based Cinebench
benchmarks, it makes up for in spades with SPEC Viewperf.
The new core bests even the high end 3.4GHz Extreme Edition
P4 in almost every test, except for drv-09 (Intergraph
DesignReview). The margin of lead in the Lightscape
test is remarkable when you consider how much faster it is
versus a 3.4GHz EE CPU. The Athlon 64s can't keep up,
especially in ProEngineer (proe-02), which is a very popular
CAD suite. If you are into Workstation Design
applications, such as those seen here in Viewperf 7.1, then
the new Pentium 4 Prescott processor may be your best choice
for top performance.
Gaming Benchmarks - Wolfenstein ET, 3DMark 2003, Comanche 4
|