PowerColor Radeon RX 5700 XT Red Devil Review: Custom Navi Arrives
Like previous-gen Vega-based Radeons, when the Navi-based GPU at the heart of this card is boosting, frequencies and voltages scale upwards (power and temperature permitting) based on the GPU's workload at the time. With the WattMan tool built into AMD's drivers though, users have the ability to manually alter frequencies, voltages, fan speeds and the power target, to fine tune performance, power, and acoustics.
In previous-generation Radeons, though the GPUs had multiple sensors built-in, a single sensor has been used to determine the GPU temperature and data from that sensor was used to control the card's thermal profile. Starting with the Radeon VII though, and continuing on with the Radeon RX 5700 Series, AMD has incorporated a network of multiple thermal sensors at strategic locations across the GPU die. Data gathered from this array of sensors is used to determine what AMD is calling the "Junction Temperature" on the Radeon RX 5700 series, and it's the Junction Temperature data that is used to tune the cards' power and thermal profiles (the Junction Temperature is effectively the hottest part of the GPU die). AMD claims the increased resolution and accuracy from the additional thermal sensors allows it to increase overall sustained performance, because thermal throttling based on the Junction Temperature is more reliable and effective.
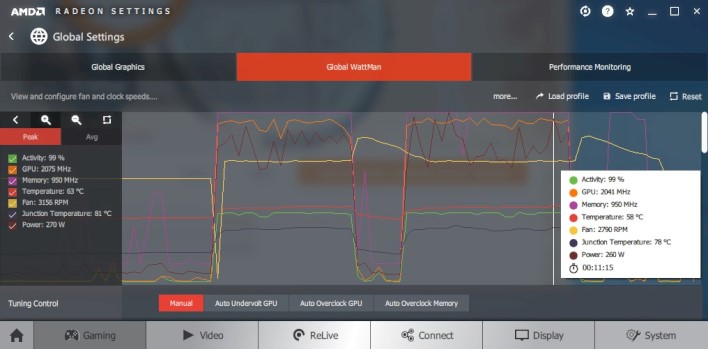
The WattMan tool built-into the Radeon RX 5700 series' drivers offer manual tuning, along with automatic under-volting and automatic GPU and Memory overclocking. In our experience, using any one of these features individually (they can't all be enabled simultaneously) doesn't result in any significant performance gains (or losses), but leveraging the data / settings gathered by all three is an easy way to achieve some nice performance boosts when manually overclocking / under-volting.
The auto-memory overclock immediately pushed the memory to +50MHz, which was the max on the slider. Auto under-volting brought the peak voltage down to 1.152v and auto-overclocking suggested a peak frequency of 2,137MHz. With all that in mind, we switched to manual overclocking mode, maxed out the power target and memory frequency sliders, set a max GPU frequency of 2,150MHz, with the recommended under-volt and saw some nice performance gains. For good measure, we also cranked up the fan speed to ensure temperatures weren't an issue...


We ultimately saw the game clock jump up to over 2GHz, with a max GPU temperature of only 58°C; the junction temperature was a much toastier 78°C at its peak, but WAY lower than the 110°C we saw with the reference card, however. Still, we gained a nearly 5% in Tomb Raider and 3.8% in 3DMark Time Spy. With some additional tweaking, we're confident performance could have been increased even further, but time constraints prevented us from messing around too much.
|
|
|

All of the cards we tested used similar amounts of power while idling, save for the PowerColor RX 5700 XT Red Devil which used a few additional watts, most likely due to the additional fans and power phases, and the RGB lighting not present on the reference card. Under load, the PowerColor RX 5700 XT Red Devil also used about 32 - 39 more watts than AMD's reference card, though that's not unexpected considering the PowerColor card's additional features and high frequencies. Versus NVIDIA's offerings the PowerColor RX 5700 XT Red Devil used measurably more power than the RTX 2070 Super, which is a testament to the efficiency of Turing -- the 12nm TU104 uses less power than 7nm Navi.
Acoustically, the PowerColor RX 5700 XT Red Devil is worlds better than AMD reference card. With either the Silent or OC BIOS modes engaged our sound meter didn't pick up any real difference from 1ft away from the rear of the system -- the system measured 44.5 - 44.7dBA in either BIOS mode and the card was barely audible over the PSU, case, and CPU fans, even after an extended benchmark session. For giggles, we cranked up the PowerColor RX 5700 XT Red Devil's fan speed to its maximum using Wattman and measured just over 60dBa. Keep in mind, this will likely never happen in the real-world if the card is working properly and installed in a properly ventilated system -- we just wanted to see how loud it would go when cranked all the way up.


