AMD Ryzen Threadripper 9980X & 9970X Review: Bountiful Cores, Big Performance

With the Windows installation complete, we installed all of the drivers necessary for our components, disabled auto-updating and OneDrive, and installed all of our benchmarking software. When that process was done, we performed a disk clean-up, cleared any temp and prefetch data, processed idle tasks, and optimized all of the SSDs using Windows' built-in tools. Finally, we enabled Windows Focus Assist to minimize any potential interruptions and let the systems reach an idle state before invoking any tests.
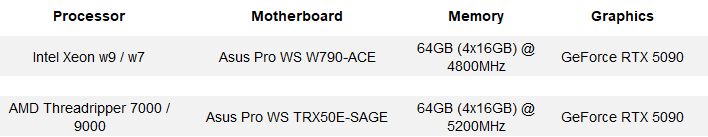
We should also note that we've completely revamped our test beds for this latest round of processor launches and all of this data is freshly generated. All systems were as up-to-date as possible with the latest BIOS/UEFI firmware, drivers, software and updates as of the time of publication.
HotHardware's Test Systems:
AIDA64 Memory Bandwidth, Memory Latency & Cache Latency
AIDA64's CPU Cache and Memory benchmarks measure memory bandwidth during read, write and copy operations, in addition to memory latency, and cache bandwidth and latency.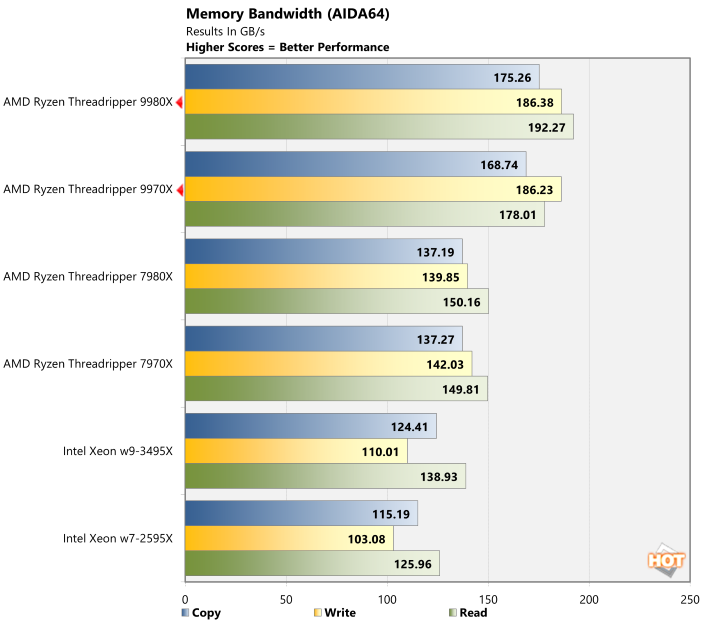
Thanks to their official support for higher memory speeds (6400MT/s vs 5200MT/s vs 4800MT/s) the new Threadripper 9980X and 9970X offer significantly higher peak bandwidth than the Xeons or previous-gen Threadripper 7000 series GPUs.
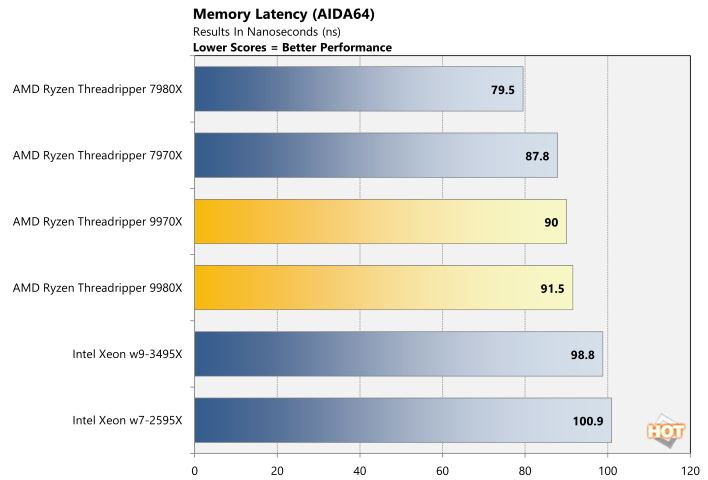
Although all of the systems used the exact same memory kit, configured with the exact same timings, latency varied somewhat. The Xeon w7-2595X trailed all of the processors, and the Threadripper 9980X and 9970X landed right in the middle of the pack.
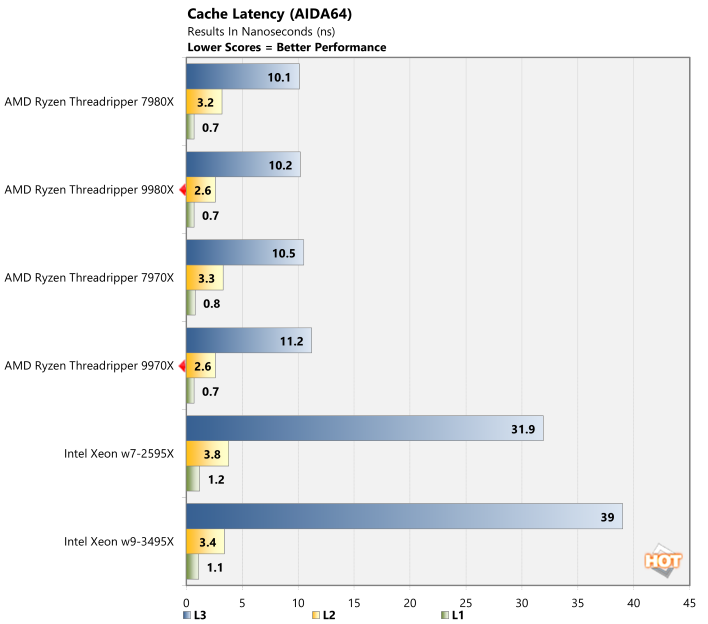
L1 cache latency is roughly the same between all of the Threadrippers here, but L2 and L3 latency is different story. The Threadripper 9980X and 9970X offered somewhat lower L2 cache latency, but higher L3 cache latency than their predecessors. L3 latency on the Xeons was off the charts, relatively speaking.
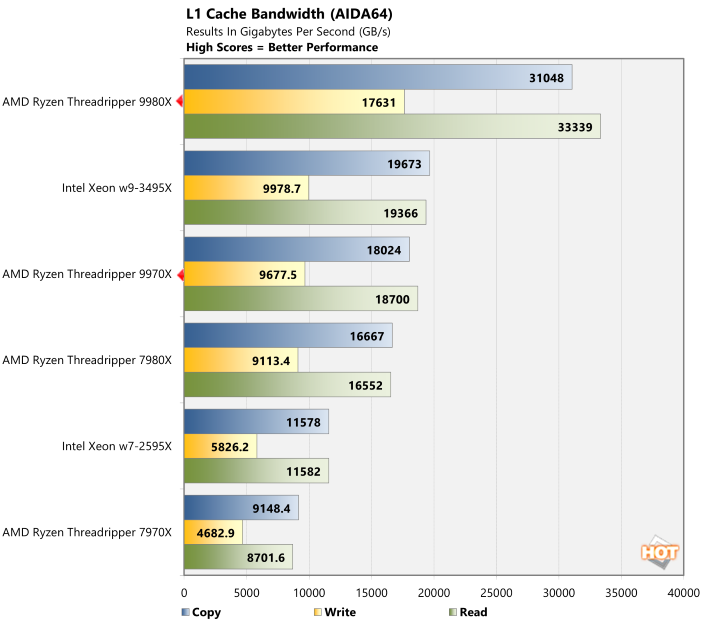
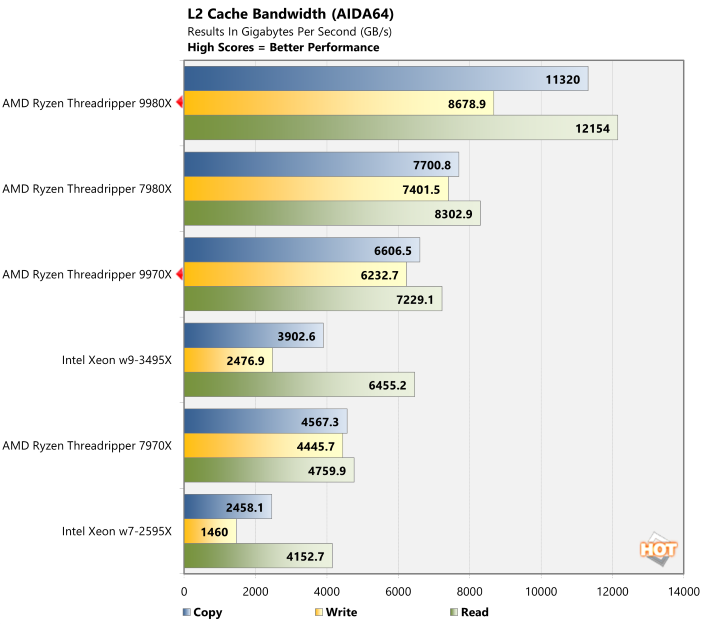
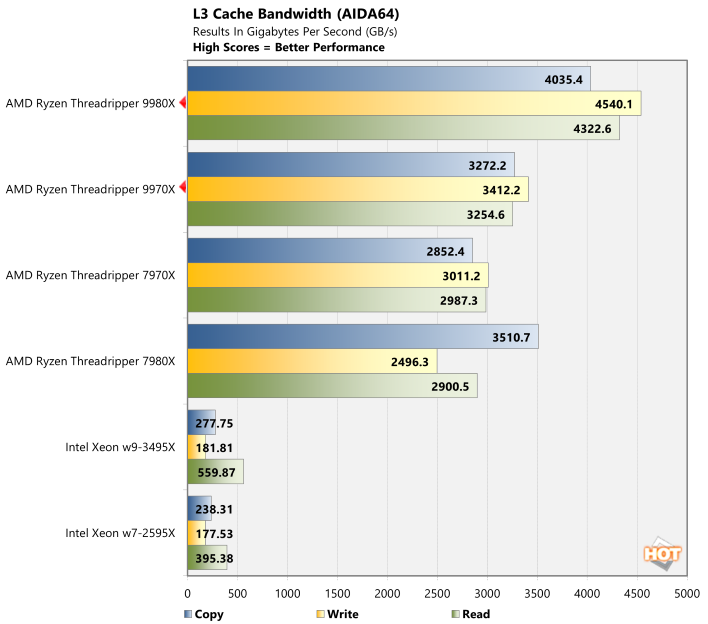
Cache bandwidth was higher across the board for the new Threadripper 9980X and 9970X, versus their previous-gen counterparts with similar core counts. And versus the Xeons there's simply no comparison. Cache bandwidth is much lower on the Xeon processors we tested.
Geekbench v6.4 CPU Benchmark
The GeekBench CPU tests stress only the processor cores in a system (not the graphics card/GPU), with both single and multi-threaded workloads. The tests are comprised of encryption processing, image compression, HTML5 parsing, physics calculations and other general purpose compute processing workloads.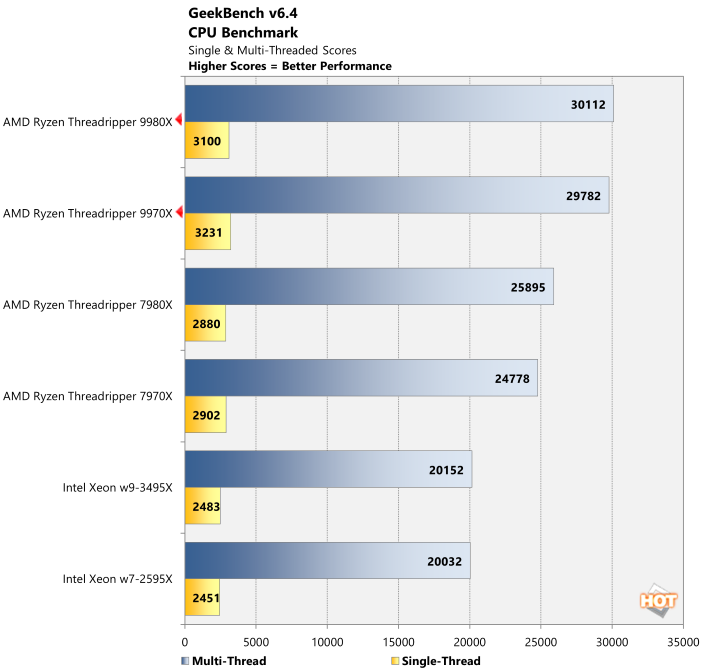
The Threadripper 9980X and 9970X take the top two spots here, with the best single and multi-threaded scores of the bunch. Geekbench, however, doesn't benefit much from additional cores or cache available on processors like the Threadripper 9980X, 7980X, or Xeon w9-3495X.
UL PCMark 10 Applications Benchmarks
Next, up we have some full-system testing with PCMark. We're reporting all test results from the PCMark 10 Applications benchmark suite, which uses actual Microsoft Office applications, in addition to the Microsoft Edge browser. The workloads are specific to each Office application (Word, Excel, and PowerPoint), and the Edge tests simulates real-world web browsing.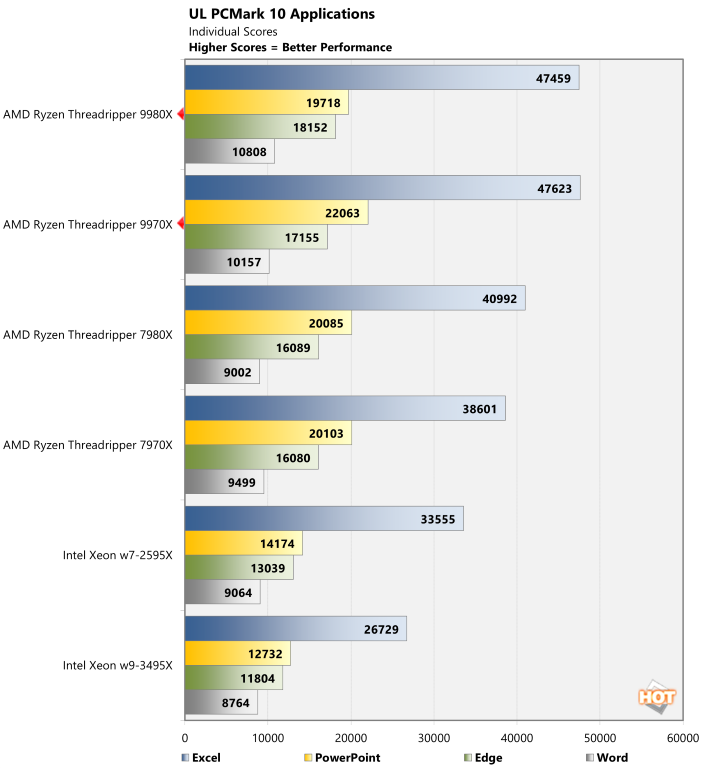
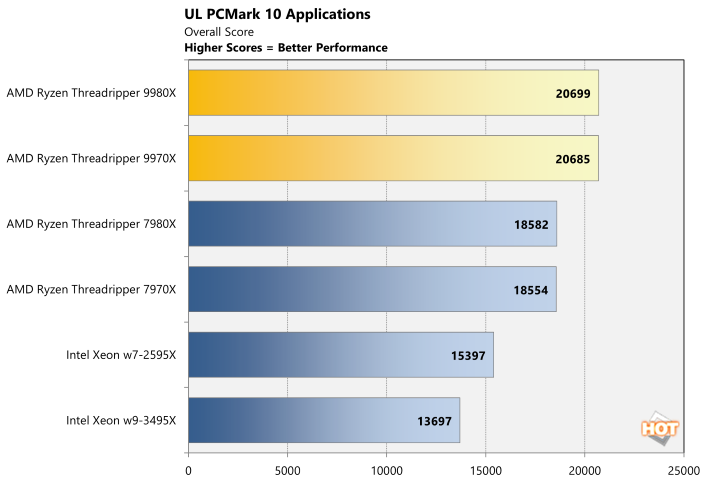
Chalk up another victory for the Threadripper 9000 series. The Threadripper 9980X and 9970X once again take the top two spots, by significant margins. The combination of faster memory and higher clocks, along with the benefits inherent to the Zen 5 architecture enhance the performance of these latest Threadrippers for everyday computing tasks like these, and not just highly-threaded workloads.
Bapco Crossmark Benchmark
Crossmark is a cross-platform benchmark from Bapco that's available for Windows, Android, iOS and MacOS. Like PCMark, Crossmark measures overall system performance and using real-world applications. It provides an overall score based on the results of its Creativity and Productivity benchmarks and system responsiveness tests.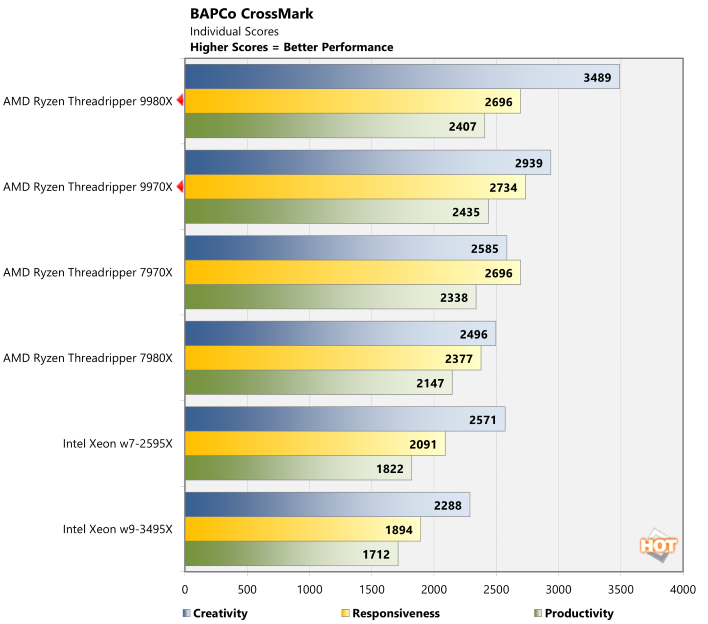
Crossmark tells essentially the same story as PCMark, but part if this benchmarks workload is highly-threaded, so the 64-core Threadripper 9980X jumps out in front in the Creativity sub-test. Still, the Threadripper 9000 processors take the top two spots once again.
Browser & Web App Benchmarks: Jetstream 2.2 And Speedometer 3.1
Next up, we have some numbers from the Speedometer 2.0 and Jetstream 2 tests available at browserbench.org. The Speedometer Benchmark Suite uses a wide array of latency and throughput benchmarks to evaluate web application performance, while Jetstream evaluates Javascript and WebAssembly performance; both tests take all of their individual results and tabulate them into a final score.These benchmarks measure performance of an array of browser-based technologies used on modern, rich web applications. Scores in these benchmark are an indicator of the performance users would see when browsing the web and running advanced web apps. All of the systems were tested using the latest version of Google Chrome, with default browser settings, on a clean, fully-updated install of Windows 11.
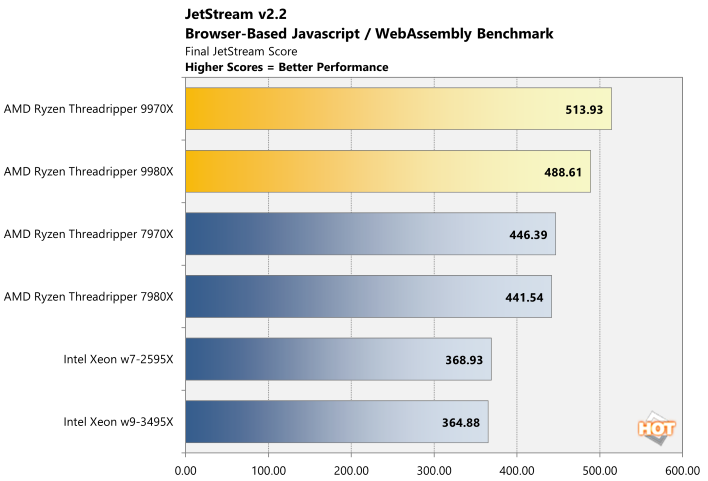
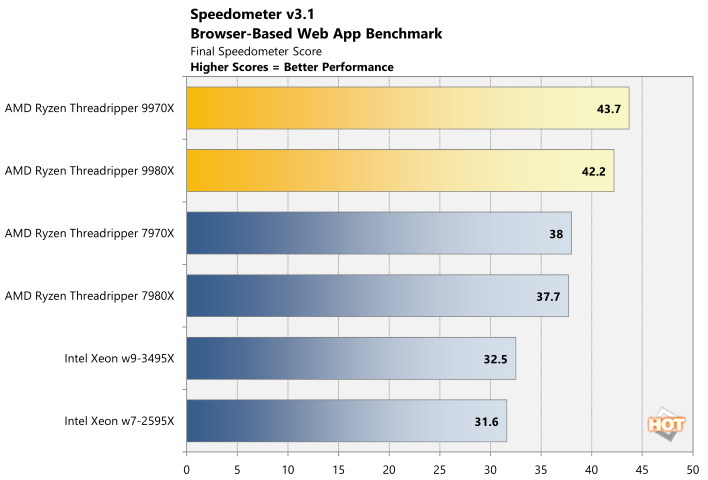
Obviously all of these processors are more than capable of running any web apps, but the clear separation here shows the Threadripper 9980X and 9970X offering the best overall performance yet again.
7-Zip Data Compression & Decompression Tests
The 7-Zip benchmark measures compression and decompression performance using the LZMA method, which leverages the Lempel–Ziv–Markov chain algorithm to perform lossless data compression. The benchmark produces a final rating in GIPS (giga instructions per second).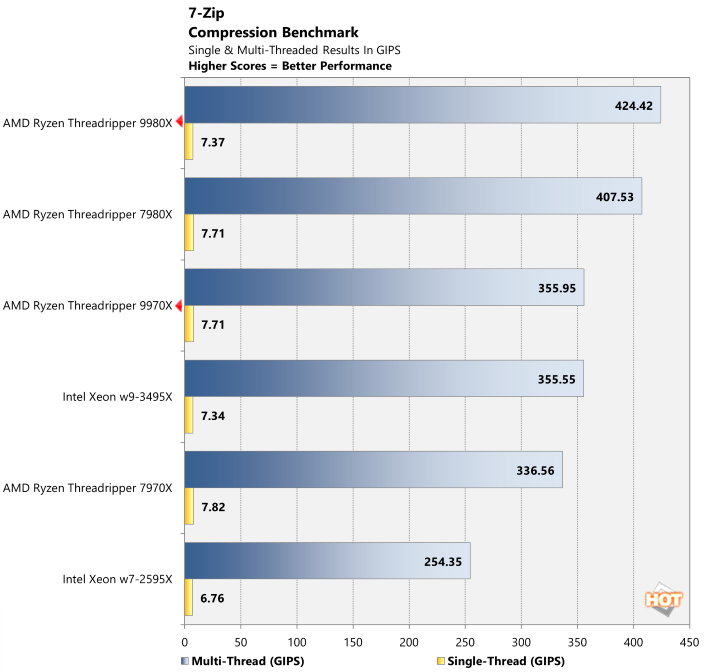
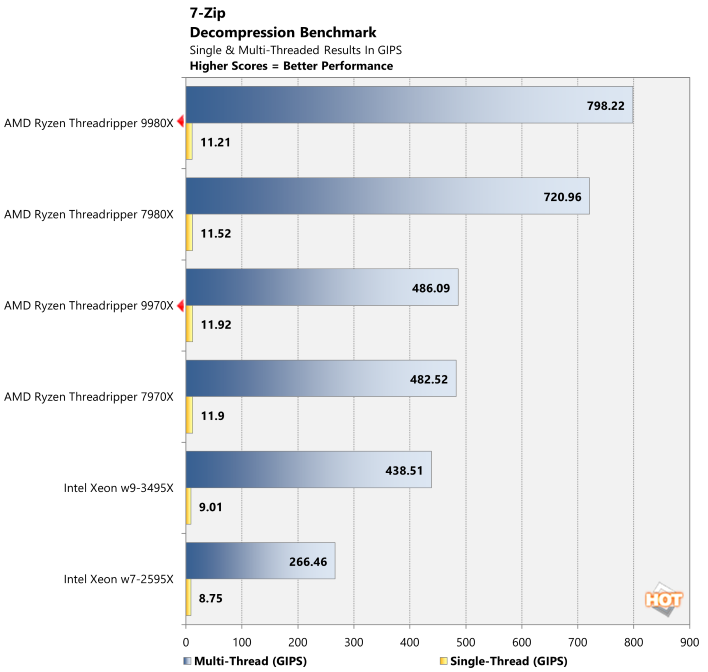
Single-thread performance is a bit of a mixed back for these latest Threadrippers in the 7-Zip benchmarks, but they're roughly on-par with their previous-gen counterparts. Multi-threaded performance, however, is a clear win for the Threadripper 9980X and 9970X. Also note that in this particular multi-threaded workload, the 32 core Zen 4 Threadripper 7870X and Zen 5 Threadripper 9970X outrun the 56 core Xeon w9.