Technically speaking, AMD's upcoming
Ryzen 9 3950X is not a high-end desktop (HEDT) processor—it's a mainstream desktop chip, even though it wields 16 cores and 32 threads of computing muscle. In contrast, Intel's upcoming
Core i9-10980XE is classified as an HEDT part, with 18-cores and 36 threads. Despite the different categories each CPU falls into, it's fair to compare these multi-core beasts, and a couple of recent benchmark leaks allows us to get a head start on things.
Both processors have made an early appearance in the
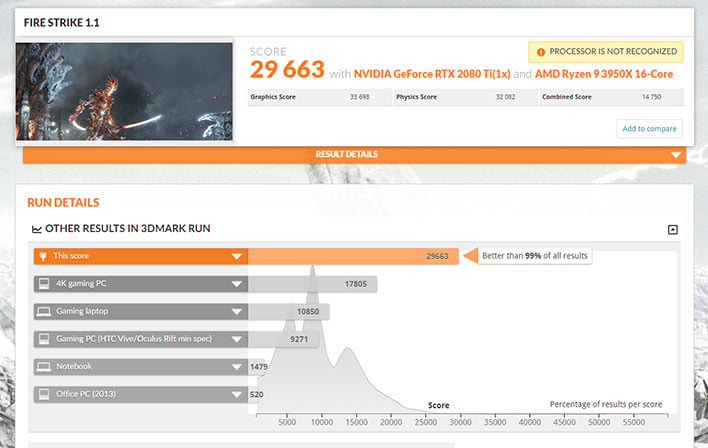
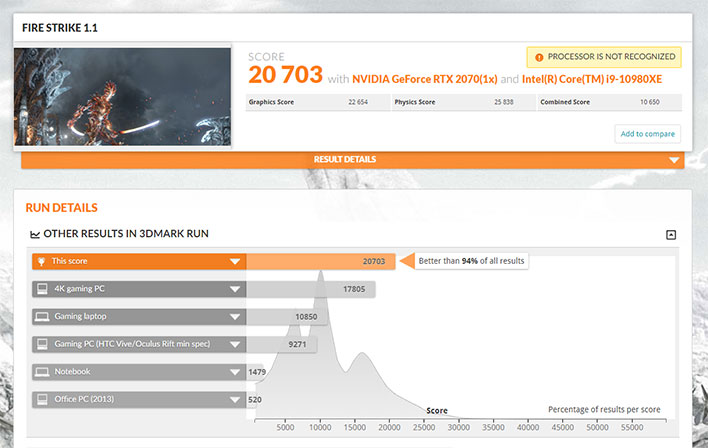
3DMark benchmark database, with regards to the Fire Strike test. This gives us a point of comparison. Specifically, it is the Physics score we are interested in, since the test beds for these processors use different GPUs.
3DMark Fire Strike (AMD Ryzen 9 3950X vs Intel Core i9-10980XE)
Here's a look at how they fared...
 AMD Ryzen 9 3950X (16 cores / 32 threads)
 Intel Core i9-10980XE (18 cores / 36 threads)
The test bed for the Ryzen 9 3950X processor consisted for a
Gigabyte X570 Aorus Elite motherboard, 16GB of DDR4-3200 RAM, 1TB SSD, and a
GeForce RTX 2080 Ti graphics card. For the Core i9-10980XE, the test bed consisted of an
ASUS WS X299 Sage motherboard, 32GB of DDR4-2666 RAM, 250GB SSD, and a
GeForce RTX 2070 graphics card. So, this is not exactly an apples-to-apples comparison.
In the Physics test, the Ryzen 3950X posted a score of 32,082, while the Core i9-10980XE scored 25,838. That's a 24 percent difference, in favor of
AMD's mainstream SKU. That's impressive, especially considering the Ryzen 3950X is working with two fewer cores and four fewer threads.
At the same time, we don't want to read too much into this, for several reasons. For one, it's still early, and driver updates can change the landscape. Secondly, it's a single benchmark score. And finally, in our experience,
Intel's architecture hasn't played all that well with 3DMark's Physics test for some reason—in
our own hands on testing, we saw the 12-core/24-thread Ryzen 9 3900X best Intel's 18-core/36-thread Core i9-9980XE in the Physics portion of 3DMark Fire Strike.
Still, this is an impressive showing. It also does not appear to be an outlier in the leaked benchmark space. In addition to highlighting these 3DMark scores, prominent leaker
APISAK brought to attention a couple of Geekbench 5 benchmark runs for the Ryzen 9 3950X.
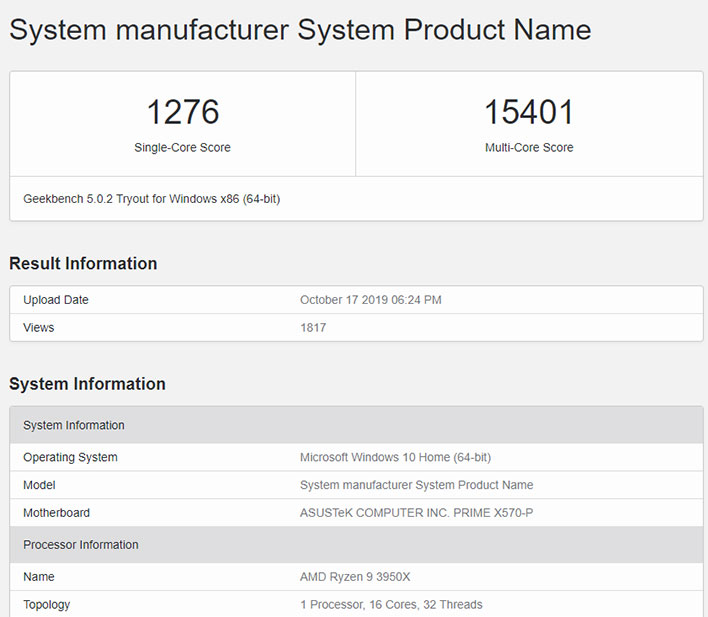
There are two sets, one with the processor plopped into an Gigabyte B450 Aorus Pro WiFi motherboard, and another with it nestled into an ASUS Prime X570-P board.
AMD Ryzen 9 3950X Geekbench v5 Scores
 Ryzen 9 3950X (X570 Motherboard)
 Ryzen 9 3950X (B450 Motherboard)
The multi-core score in the X570 test bed is the more impressive of the two, at 15,401 versus 11,140 for the B450 system. We're not aware of any leaked Geekbench v5 scores for the Core i9-10980XE, but compared to the Ryzen Threadripper 2950X, we're looking at around a 14 percent performance uplift. The Ryzen 9 3950X might not be an HEDT part, but it sure performs like one, if these early benchmarks are any indication.
Cinebench R20 Showdown Between Ryzen 9 3950X And Core i9-10980XE
The folks at
WCCFTech say their friends got their mitts on an Ryzen 9 3950X and sent them scores obtained from Cinebench R20. As told, the testing was conducted on a PC running Windows 10 (build 18362).
During testing, the Ryzen 9 3950X is said to have maintained an all-core boost clock of around 3.9GHz most of the time. It was installed into an ASUS Prime X570-P motherboard and cooled using the stock Wraith cooler.
It scored 8,789 points. That's on par with an Intel Core i9-9980XE, which scores 8,833 in the same test. However, those numbers break down to 549 points per core for the Ryzen 9 3950X, and 490 points per core for the Core i9-9980XE, if you want to look at it that way.
We're talking all of this with a grain of salt, of course, and will reserve final judgement once we've had a change to put the Ryzen 9 3950X and Core i9-10980XE through their respective paces. Disclaimer aside, the Ryzen 9 3950X is looking like a formidable chip.
Update 11/20/19 - Intel Clarifies Some Points
After posting this article, Intel reached out to HotHardware with some observations it wished to clarify. They include the following...
- The two systems are not setup as an apples to apples comparison. The system based on Intel processor from this benchmark here has a Nvidia RTX 2070, while the AMD system has a much faster 2080 Ti. The difference of GPUs is main reason impacting on the lower score for the Intel system. As 3DMark Fire Strike is impacted by the GPU performance (score of the benchmark is 75 percent “Graphics”, 15 percent “Physics”, 10 percent “Combined”), the difference of the GPU spec between the two systems most probably skewed the results. E.g. we have seen reviewers saying that the 2080 Ti is around 40-50 percent faster vs. a 2070.
- Another factor to consider is that the AMD system is built on a board for gaming, while the Intel system is built on a workstation board which is again not an apples to apples compression.
- Also want to point out these are unlikely production units which results should be taken with a grain of salt.
The first point is one we addressed in the original article above—this is certainly not an apples to apples comparison because in large part due to the different GPUs. That is why we only focused on the Physics score, and not the Overall or Graphics scores.
Intel's two other points are valid observations. We did point out the motherboards used in both benchmark runs, but should have offered some additional analysis—as Intel correctly points out, the AMD test bed is indicative of a gaming PC, while the Intel test bed is indicative of a workstation system. This matters because workstation boards sometimes trade a small amount of performance for a higher level or reliability (generally speaking).
The last point is one we touched on, at least with regards to the drivers. We mentioned not reading too much into these results because "it's still early, and driver updates can change the landscape." And as Intel further points out, these may not be production units.


