Exploring AMD Ryzen 6000 Vs Intel 12th Gen Laptop Task Energy Consumption
Mobile Platform Power Efficiency Explored: AMD vs. Intel Notebooks Go Head-To-Head

At the launch of its Ryzen 6000 mobile processors, AMD made some bold claims about power efficiency. While the first systems out of the gate, like the ASUS ROG Zephyrus G14, boasted some pretty impressive performance and good battery life, it was the ASUS Zenbook S 13 OLED (above) that really took battery life to a whole new level. In the middle of all this, AMD claims its processors are more efficient than Intel's. In some aspects that does appear to be the case, but evaluating power efficiency is a tricky thing. If a platform uses less energy overall, but can't get a particular job done in less time, does it matter? Does the task at hand rely on user input, and therefore the time to complete doesn't change? How much performance is enough?
All of these questions have the same answer: "it depends." But that's not going to stop us from trying to evaluate power efficiency employing an array of laptops powered by both AMD and Intel, and look beyond battery life and step into the realm of task energy. We can measure power consumption over time and see how much power, measured in Joules, a system needs to get a job done. For reference, a single Joule is one Watt over one second, so 3600 Joules is equivalent to one Watt-hour. Once we have measured power draw over time, we can weigh that usage against the PC's performance, and in turn make a value judgment based on both of those factors, which is what we're striving for here today. We say "striving" as opposed to "doing" because this is an inexact science with lots of confounding factors and caveats, most of which we'll get into to soon.

AMD Vs. Intel Test Energy: How We Tested
Not to put the cart before the horse, but we'll continue by saying both AMD's Ryzen 6000 processors and Intel's 12th-generation Alder Lake CPUs seem to score some wins. However, this piece is more about that interesting data we generated, with a few caveats. We did our best to account for differences, but in the end our results reflect the relative performance of whole systems, not just the platform. After all, we're not able to measure power consumption from just a singular component (or set of components) within a PC easily, but grabbing data for a whole system is fairly straightforward.If you read the most thorough Apple Mac Studio review on the Internet, you know that we used an older, but still very useful, Watts Up Pro to measure power consumption for a couple of different scenarios, including task energy in Cinebench R23. What we learned there intrigued us and we knew that this kind of data would be useful for PCs as well. So that's what we did here, and this is how we're putting the combatants' mobile efficiency claims to the test.
There's a ton of data for multiple workloads in this article, including scores and the actual power consumption required to attain those scores. Some of these workloads, like the aforementioned Cinebench R23 as well as LAME XP, work to accomplish a specific task as fast as possible. Others rely on user input or might otherwise run for a specified amount of time, like a gaming test or 3DMark, for example. PCMark falls somewhere in the middle, where it has a video conferencing component that takes a set amount of time, but other tasks can be done more quickly because they're scripted office tasks. All of those scenarios pose different questions, and there's plenty to try and answer.
The two machines we're most interested in here are the Samsung Galaxy Book2 360, which has an Intel Core i7-1260P, and the ASUS Zenbook S 13 OLED with an AMD Ryzen 7 6800U. The processors in these machines sit near the top of the performance charts for the respective manufacturer in the low-power arena and they both rely on on-processor graphics. For additional context, we've also added a couple of higher-power gaming notebooks, the 2022 version of MSI's GE76 Raider and the ROG Zephyrus G14.
Rather than calibrate our machines to similar display brightness values, we adjusted the displays to account for power consumption so that our machines had as close to the same idle power draw as possible. This is key for gauging CPU power consumption under a workload. In our charts below, our AMD platforms are color-coded in orange where our Intel-based PCs are blue. This is, after all, ultimately a face-off of Intel vs. AMD, even though the notebooks descend from Samsung and ASUS.
Task Energy With Varied Workloads
Our first test is BrowserBench Speedometer 2.0, a web-based exercise that gauges performance in a variety of HTML rendering and JavaScript workloads using a sample to-do app. The score is reported in Runs Per Minute, and the length of the test is tied to how fast it renders. In this way, Speedometer is like a real-world rendering test because it races back to an idle state.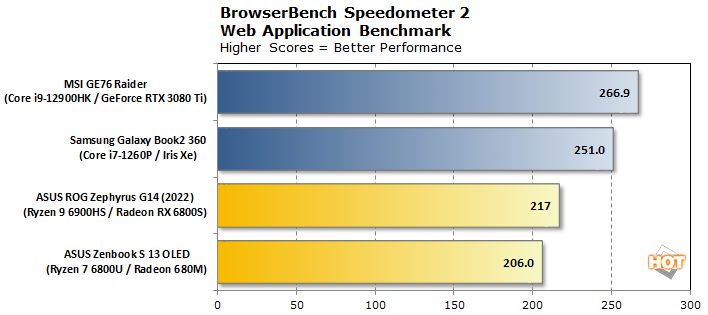
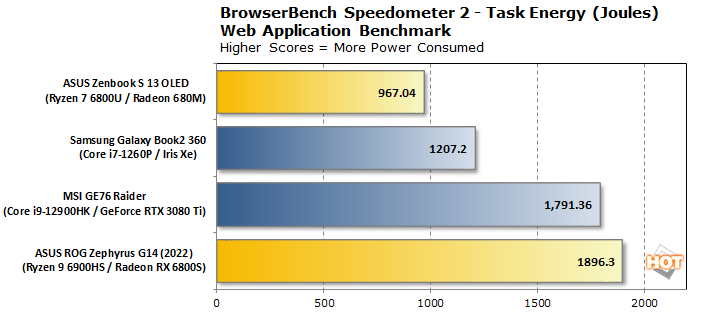
Whether it's a high-powered gaming notebook or a thin-and-light laptop, Intel enjoys an absolute performance lead of around 20% in this test. Regardless of which platform we use, however, Speedometer is really, really fast and subjectively, we don't think anybody is going to feel a difference. That said, the Galaxy Book2 360 consumes about 24% more power than the Zenbook S 13 OLED. AMD might have a slight efficiency advantage here if we conjured up a metric like "Joules per point" (which favors AMD at 4.7 to 4.8) where lower scores represent higher efficiency, but it's so close that we don't think it really matters. The gaming notebooks have big, power-hungry GPUs and higher TDPs that push the efficiency in a different direction, and their competing brands of GPU manufacturer muddy the waters further. It's hard to draw a conclusion when AMD is battling both Intel and NVIDIA here.
Next up is PCMark 10. Some of this test will race towards idle, particularly the portions that rely on scripts to automate office tests, but some of PCMark's work includes video playback to simulate a video conference, and that takes the same amount of time no matter what system is used. That means the tests take around the same amount of time with faster platforms, saving a little time but not much.
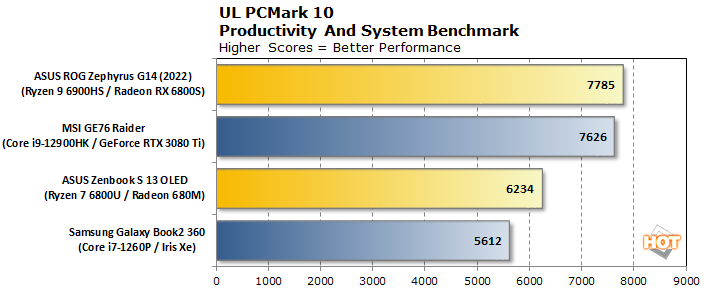
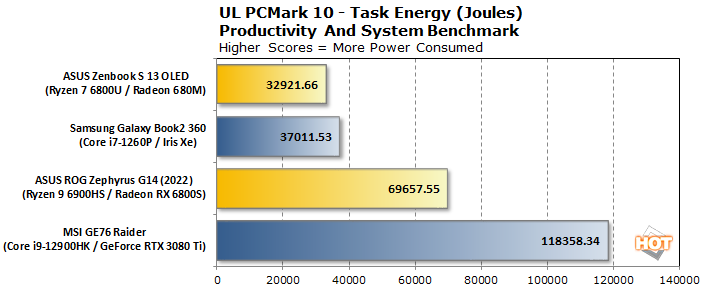
We're not really worried about individual subtest scores here, so we'll just look at the overall score. The Zenbook S 13 OLED actually beats out the Samsung Intel ultraportable on both overall performance and power consumption. Both margins of victory are around 11 percentage points, where a rough "efficiency" score dividing Joules by PCMark score of 5.28 to 6.59 means Intel draws roughly 25% more power per point. With better performance on top of lower power consumption, this certainly seems like a clean power efficiency win for AMD, at least with the varied productivity and content creation workloads that are part of PCMark 10.
Digging Deep Into LAME XP
We're going to move on to tests that are full of race-to-idle power savings. It starts with LAME XP, which generates some compressed audio files from lossless masters. We ran this test by timing how long it took to encode 16 individual WAV files to MP3s. This presents a few challenges, but first let's look at some data.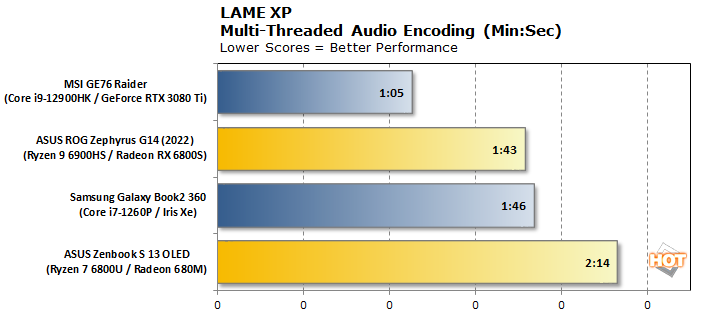
Here's a job that's more or less a tossup. The Intel-powered Samsung notebook is a little faster overall, but it also consumed a touch more power.
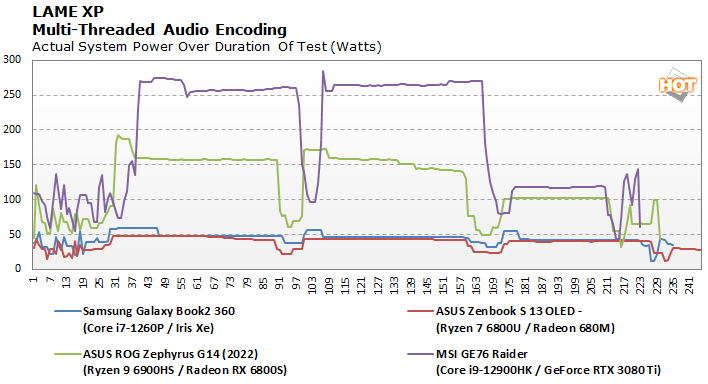
When we look at the power consumption over time, we see that the Samsung / Intel notebook consumed a more power in fits and spurts, but it also completed its task sooner. Therefore the higher peak power consumption we see on the chart ultimately doesn't matter so much, since the power consumption was still a touch lower. Faster run-time with lower power consumption means Intel wins, right? Probably. We've seen a few of these results now, so let's pause for a moment and sort it out.
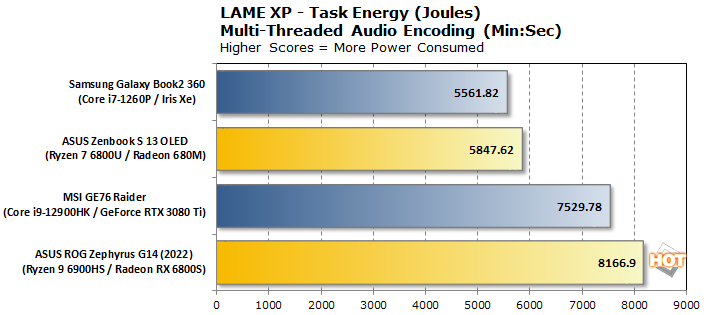
But we all know that statistics can say whatever someone wants them to say. Why can't we just divide the Joules by the runtime in seconds to get a Joules per Second value where the Zenbook S 13 OLED rates 43.63 and the Samsung Galaxy Book2 360 figures to be 55.16 Joules per second. Is that bad? Well, maybe, because it doesn't factor performance whatsoever. We don't think that is helpful.
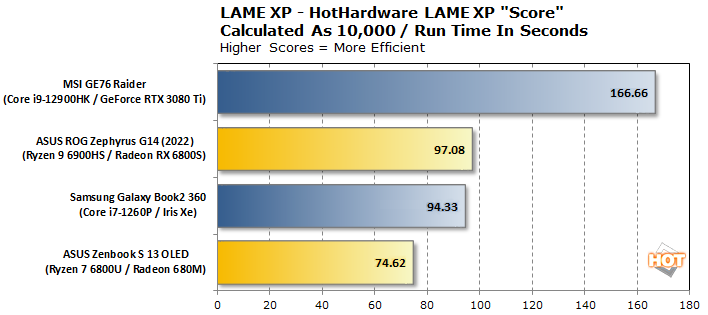
Instead, we can get really nerdy with the math. Let's take an arbitrary value -- say 10,000 -- and divide it by the number of seconds it takes to compete the task. 10,000 divided by the 134 seconds it took the Zenbook to complete the encoding, results in a made-up, hypothetical "LAME XP score" of 74.62. The same operation with the Galaxy Book2 360's 106-second runtime results in a score of 94.34, and that makes sense since the task time is so low. And also, wow! The Core i9-12900HK is really good at LAME, which we could have gathered from the time chart, but with our hypothetical score it looks amazing at 166.67.
Now we can divide the Joules by this hypothetical score and see some sort of "EfficiencyMark" (this is new ground, so we're improvising as we go, right?) based on Joules per LAME XP "point". When we're talking about Joules per unit of work, which is what our scores above represent, we can talk about the actual efficiency of the whole exercise.
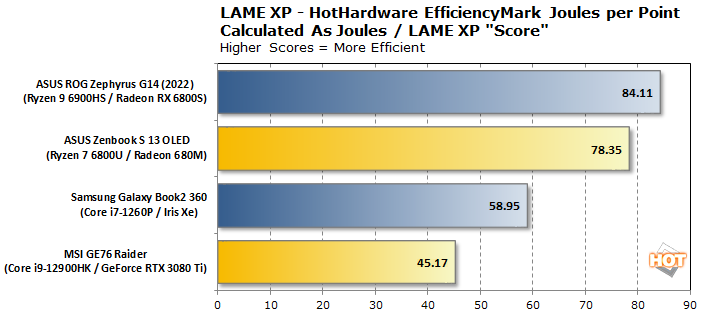
When we do that, the rankings look like this. Therefore we might say that the low-powered Intel platform is about 30% more efficient in this task. That's a significant margin, and it's not likely to change that much if we used, say, 100,000 instead of 10,000 in terms of percentage. The surprising thing here, is that the AMD-powered ROG Zephyrus G14 takes the cake, not the Zenbook S 13 OLED, and the system with the fastest encode time -- the MSI GE76 Raider -- loses bigtime because of all the power that its Core i9-12900HK consumes. But we think this is an interesting representation of power-per-work, and therefore a useful metric of efficiency.
Task Energy During Cinbench Rendering
Another race-to-idle test is Cinebench R23, in which we measured performance and power consumption for a single pass of the render benchmark. This CPU benchmark uses the Cinema4D rendering engine to draw a path-traced scene with reflections and all sorts of materials and returns a score based on the time it takes to complete, where higher is better.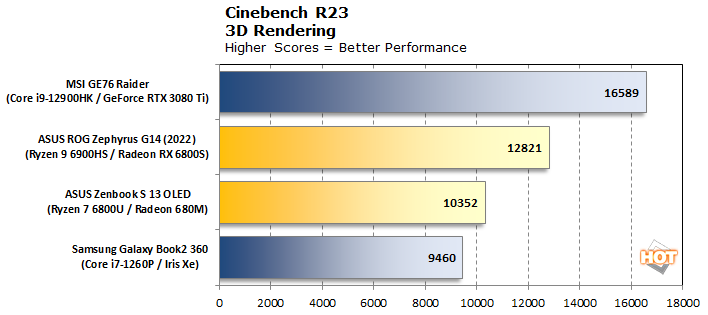
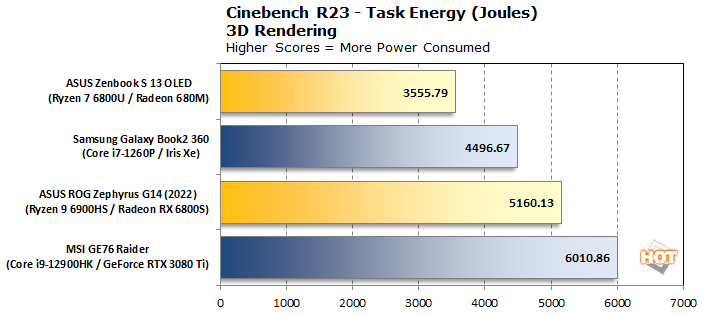
This is a big win for AMD where seconds matter and power consumption compounds based on how long the test takes to complete. Here we see the AMD-powered Zenbook S 13 OLED outscore the Intel-based Samsung Galaxy Book2 360 by around 10%, but it used 27% less power to do it. This is the benchmark that spurred this comparison in the first place. If you read the Mac Studio review mentioned in the intro, you know that the M1 Mac mini had insane efficiency compared to all the other test platforms, although overall it took last place in the benchmark (and would do so again here). In this case, the power efficiency debate is quite lopsided in favor of AMD, where the Zenbook scored around 2.9 points per Joule compared to the Galaxy Book2 360's 2.1. That's 38% more efficient, with better performance to boot.
Let's talk about the gaming notebooks for a moment. Yes, they consume more power, but they also get done with this test much more quickly. The roles are somewhat reversed, but remember we have different GPUs inside the systems, so it's hard to pin this down to just the CPU. If we do some back-of-the-napkin math here, we see that the efficiency of the GE76 Raider isn't too shabby at 2.76 points per Joule where the ASUS ROG Zephyrus G14 racks up 2.48 points per Joule. Despite the big GPUs, the higher CPU clocks and overall performance resulted in some respectable scores. Now, let's see how power consumption did over time.
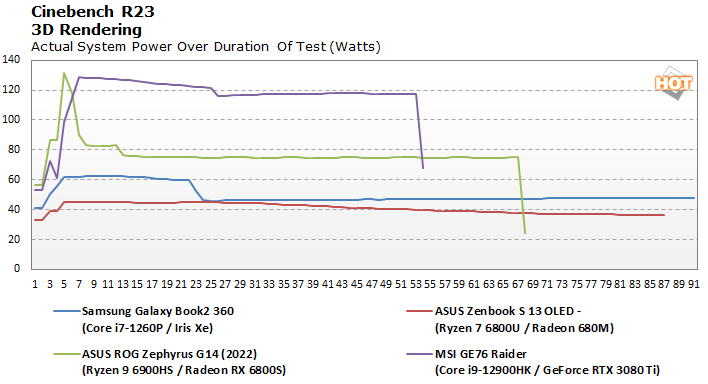
We stopped recording power consumption as soon as the test concluded. On this chart, we can see that the Galaxy Book2 360 started really quick out of the gate, but once heat built up and boost clock headroom was exhausted, power consumption dropped down. By comparison, the Zenbook S 13 shot up a bit early on and gradually dropped over time, and its highest levels were basically as high as the Samsung machine's low point. Couple that with completing a few seconds earlier, and it's easy to see why the AMD-powered ASUS notebook took a big efficiency win. And despite big instantaneous draws, the two gaming notebooks both wrapped up the test long before the smaller notebooks, which salvaged their efficiency.
But is this a win for AMD and the Ryzen 6000 chips? It starts to get a little tricky. More often than not, users probably need more than one frame to build an animation. So the lower performance will compound over time and the slightly better efficiency might not be worth what could amount to a significant time delay. This is where context is key, and absolute efficiency is a little less important. In terms of ultraportables, the low-power AMD-based ASUS notebook was much better than the ultraportable from Intel. In the grander scheme, however, maybe the GE76 Raider presents a better balance of power, performance, and time savings. Or maybe you should just run large render jobs on a desktop where power consumption might be higher, but performance would be better still.
Next up let's take a look at a couple of 3D apps, beginning with 3DMark Night Raid. This DirectX 12 benchmark is targeted towards the low-power integrated GPUs of our ultraportable notebooks, so the gaming notebooks that have been coming along for the ride are just ridiculously overpowered for this test.
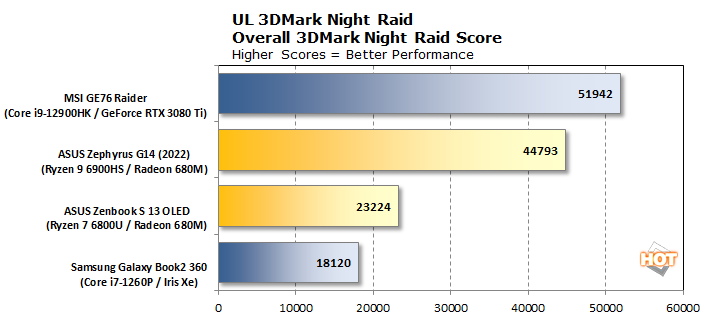
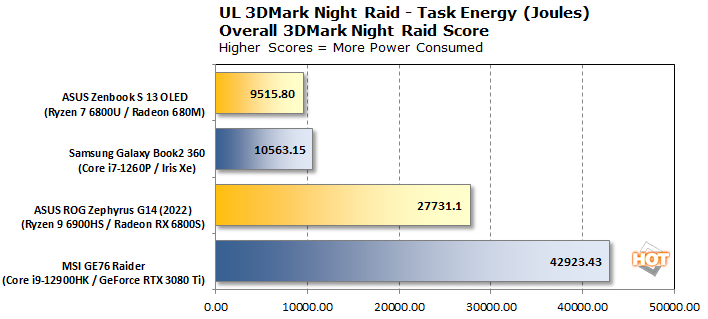
It probably comes as a shock to nobody that the Zenbook S 13 OLED and Galaxy Book2 360 both use less than half the power of the Zephyrus G14, which is itself a very portable gaming notebook, and under 25% of the power of the GE76 Raider desktop replacement. What's interesting is how efficient both AMD notebooks are compared to the others.
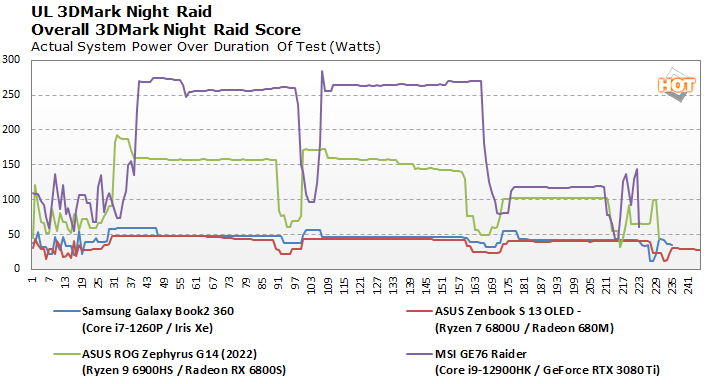
First the Zenbook S 13 OLED wins the battle of the lightweights, handily besting the Galaxy Book2 360 in both performance and power consumption. We don't need any fancy math like we had for LAME XP to say that this is a big win for AMD and ASUS. It's about 20% more performance with a 10% savings in power. If we do 3DMarks per Joule, it's 2.44 to 1.72, and this is with a test that doesn't really complete any quicker (or slower) depending on performance. The power over time chart really goes a long way to showing how non-time sensitive a task that gaming is. The frames per second is what matters and the Radeon 680M in the Ryzen 7 6800U is just really good for an IGP.
On the top end, we're going to stop and remark how relatively close the ROG Zephyrus G14 and GE76 Raider are, given their power consumption. Yes, the MSI notebook with a GeForce RTX 3080 Ti is much faster -- 15.96% faster, if we wanted to put a number on it, but it required 54.8% more power to do it. That makes us wonder, "how fast is fast enough?" The answer is going to depend on the game, of course. But once a game runs fast enough to be comfortable, especially once it hits the speed of the panel or moves fast enough that we can't tell the difference with our eyes, it's wasted power and performance. AMD and NVIDIA thought of that, and that's why Radeon Chill and BatteryBoost exist. Interesting side note and not really the focus here, though.
Next let's look at an actual game. Gears Tactics runs competently enough on all four of these platforms, so let's look at efficiency.
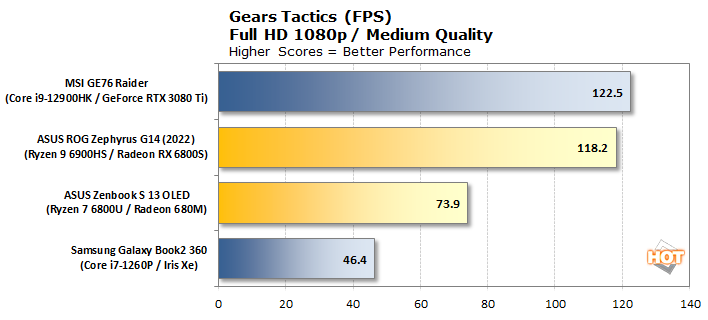

Once again we see a tale of two segments. Gears Tactics is pretty CPU limited on the high end, at least on medium settings, so the AMD Advantage ASUS notebook with a lower-powered Ryzen CPU wins in efficiency big-time. It's a 3.5% frame rate win for NVIDIA and Intel in the GE76 Raider versus the Zephyrus G14, but it took about 72% more power to do it. That's pretty outstanding efficiency when AMD controls the whole platform -- and, granted, packs two lower-power components into a tighter space. The Radeon RX 6800S appears to be a pretty efficient beast. The GE76 Raider and Zephyrus G14 are so different though, that it's almost like comparing Macs and PCs, if Macs could actually play games.
Regarding the utlraportables, AMD pulls off another really great efficiency win. Not only is the frame rate 60% higher than the Intel-based Samsung Galaxy Book2 360, it uses 30% less power. Plus the performance is something you can really feel; 46 fps is smooth enough, but averaging up near 74 fps is quite smooth, and the dips are going to be a lot higher than Intel's, too. We're at a performance level where we'd like to play this game on the ASUS machine, whereas the Xe IGP in the Core i7-1260P powering the Samsung notebook might force us to play on lower settings to be more comfortable.
AMD Vs. Intel Task Energy Conclusions
What have we learned? Armed with our meters and an Excel spreadsheet, we think we found that AMD's mobile power efficiency claims are basically true. Over the course of our whole test suite, the Ryzen-powered ASUS Zenbook S 13 OLED typically beat the Intel-based Samsung Galaxy Book2 360. But there is an important distinction to keep in mind: these notebooks are quite different. They have similar weight, footprint, and display size, and we level-set for idle power as best we could, but the fact remains that our figures are full system power benchmarks and don't isolate the CPUs on their own.Still, in this instance, it seems like AMD has power efficiency figured out, at least in x86 land. If we start throwing in Arm-based laptops with chips from Qualcomm or Apple, we could turn this into a crazy Battle Royale, but both vendors still have some software deficiencies, because their chips have to fall back on compatibility layers and x86 emulation in some cases.

We've also got to consider how much performance is enough, or too much? That all depends on the needs of the user. In LAME XP, the Intel-powered MSI GE76 Raider left all the other notebooks in the dust, but due to the sky-high boost clocks and TDP it also sucked down a whole lot more electricity to do it. In Gears Tactics, the ROG Zephyrus G14 could keep up with the MSI system while using much less power. Don't forget that both the ultraportables outright won on power consumption across the board, while still being pretty speedy, even if they didn't entirely keep up with the gaming beasts in terms of absolute performance.
In the end though, there's enough evidence to say that AMD's current Ryzen 6000 mobile platform scores some clear efficiency wins over Intel's 12th Gen at this point in time. While Alder Lake was often faster in the benchmarks, the Ryzen 7 6800U could often perform a task more efficiently. Whether that matters is up to you. Now that you've seen the data, what do you think? Let us know in the comments, because we'll surely be revisiting this topic again at some point, using a more diverse array of systems.


