Dell Precision 7875 Workstation Review: 96 Cores With Dual RTX 6000

We just finished up a review of Dell's Intel-powered Precisions, the 7960 and 5860 workstations. We came away suitably impressed by those machines, but they weren't sporting specifications anywhere near as stupendous as this 96-core beast. So, we're expecting big things out of the Precision 7875.
ATTO Disk Benchmark
The ATTO disk benchmark is a quick and simple test which measures read/write bandwidth across a range of different data sizes. While we don't typically compare these results across multiple machines, it's useful to gauge whether a particular system's storage subsystem can handle being put under pressure.

The RAID 0 stripe of a pair of fast PCIe 4.0 SSDs produces excellent results in the larger transfer sizes, topping out at over 12 GB/second on reads. That's as fast as some of the numbers we've gotten from PCIe 5.0 drives. The random access performance is hampered slightly by the RAID array, but for the kind of work you're likely to do on a machine like this, the shipped configuration is almost assuredly the superior option.
The drives in this machine are SK hynix PC801s, which are essentially the OEM version of the P41 Platinum. We haven't reviewed that drive, but just looking at the performance here, we can tell it's a screamer.
Cinebench R23 Rendering Benchmark
Cinebench is a 3D rendering performance test based on Maxon's Cinema 4D application. Cinema 4D is a 3D rendering and animation suite used by creators and production houses like Sony Animation, Disney, Electronic Arts, and many others. It's very demanding on processor resources and can utilize up to 256 threads, which makes it an excellent gauge of computational throughput. This is a multi-threaded, multi-processor-aware benchmark that renders a 3D scenes while tracking the length of the entire process. The rate at which each test system was able to render the entire scene is represented in the graphs below.
Well, how about that? Our first result exceeding 100,000 points in Cinebench R23. The single-threaded score is the highest we've seen yet, but that multi-threaded score is out of this world. To be honest, the multi-threaded Cinebench R23 test has to be seen to be believed. If you don't set a minimum run time, this CPU completes the benchmark in about five seconds. It's stunning.
LAME MP3 Audio Encoding
LAME is one of the oldest and most widely-used audio encoders in the world. The encoder itself isn't multi-threaded, but modern PCs can encode a single track so quickly that it makes sense to spawn a bunch of copies of the encoder for each thread on the CPU. For this test, we created 16-copies of our own 223MB WAV file (an 11 minute Grateful Dead jam) and converted it to the MP3 format. Processing times are recorded below, listed in minutes:seconds. Shorter times equate to better performance.

The really amusing part of this result is that we're only doing sixteen encodes at once. This processor could almost assuredly handle another thirty encodes or more without losing any speed at all. The Threadripper Pro 7995WX in the Precision 7875 absolutely annihilates the competition; it's not even close.
7-Zip Data Decompression
The 7-Zip benchmark measures decompression performance using the LZMA method, which leverages the Lempel–Ziv–Markov Algorithm to perform exceedingly efficient lossless data compression. The benchmark produces a final rating in GIPS (Giga-Instructions per Second).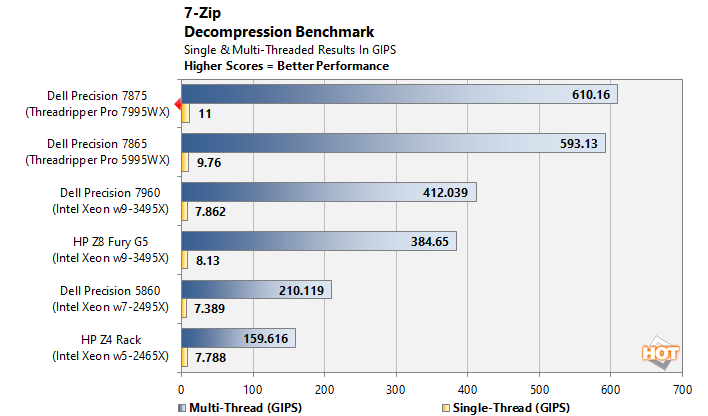
Dell and AMD take home another win in 7-Zip, although this result is considerably closer than the other tests so far. This likely comes down to the fact that 7-Zip doesn't actually scale past 64 threads, an issue we'll run into again shortly. Still, the massive single-threaded performance of Zen 4 allows the 7995WX to inch past the other CPUs in this test.
POV-Ray CPU Ray-Tracing Benchmark
POV-Ray, or the Persistence of Vision Ray-Tracer, is an open source tool for creating realistically lit images. We tested with POV-Ray's standard 'one-CPU' and 'all-CPU' benchmarking tools on all of our test machines and recorded the scores reported for each. Results are measured in pixels-per-second throughput; higher scores equate to better performance.
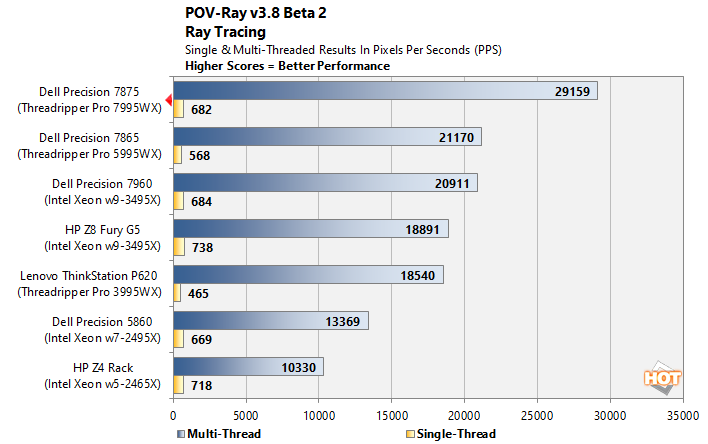
POV-Ray is normally slightly fond of Intel machines, but no amount of single-threaded advantage is going to overcome a nearly 100% deficit in core count. We recall 512x512 POV-Ray renders taking days to complete on old sub-GHz single-core machines; now we're rendering them out in about eight seconds. Absolutely incredible.
Y-Cruncher Multi-Threaded Pi Benchmark
Y-Cruncher is a multi-core-capable tool that calculates the value of pi to a specified number of digits. In this case, we ran the tool on all threads and had the application calculate the value of pi to 1 billion digits. The values below are the time required to perform the calculation expressed in seconds. As a result, lower values indicate better performance.
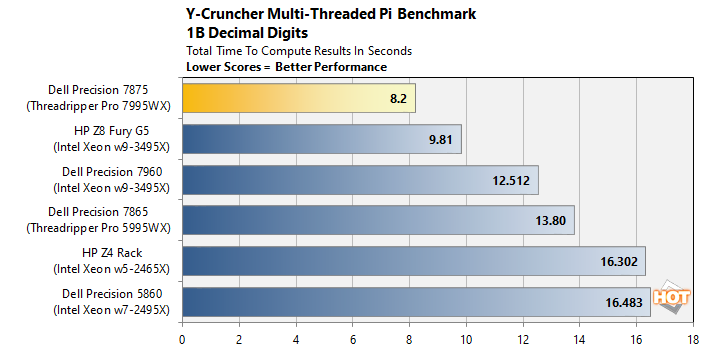
Y-Cruncher, as a benchmark, is largely limited by memory bandwidth and cache throughput. Its massive 384 MB L3 cache and 512-bit DDR5 interface are likely helping to propel our Dell workstation tower to the top of this chart. This result is just a few seconds off of the all-time world record for Y-Cruncher 1B, but reaching that apex would likely require quite a lot of system tuning.
UL 3DMark CPU Physics Benchmark
For the 3DMark Physics test, we simply create a custom 3DMark Time Spy run consisting solely of the physics test, which is multi-threaded and heavily CPU-dependent, and then report the results. These numbers are given as frames per second, with higher values indicating better performance.
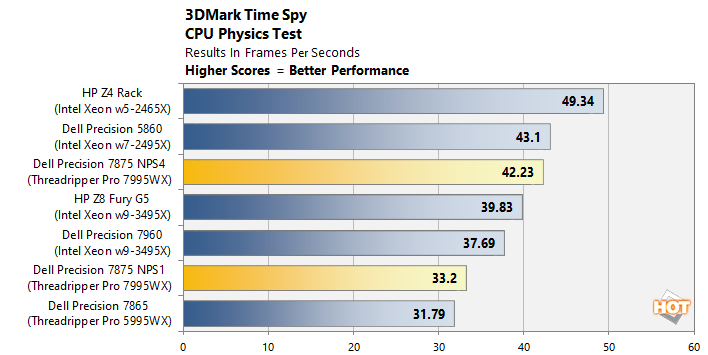
What's this? Two results? Indeed. The Threadripper Pro 7995WX's performance in this benchmark was unexpectedly low to begin with, so we got to researching and noted that the application was struggling with our 192-thread CPU. Going into the CMOS setup for the machine and switching the system from NPS1 mode to NPS4 mode radically improved our results in this test.
NPS stands for "NUMAs per socket", and essentially, it's a function that divides the many-core Threadripper CPU into multiple non-unified memory domains. This has little actual effect on the performance of the CPU itself, as nothing changes electrically, but it can help some software better utilize the processor as it alters the way Windows schedules tasks on the CPU. Indeed, enabling NPS4 mode and limiting 3DMark to "just" 24 cores helped quite a bit here—although the system still lags behind the hot-clocked Sapphire Rapids chips with fewer cores.
BlackMagic RAW Video Decoding Speed
The Blackmagic RAW Speed Test is a CPU and GPU benchmarking tool that tests full-resolution Blackmagic RAW video decode performance. The tool can be used to evaluate the capability of a system at various resolutions and compression ratios on the CPU or using OpenCL on a GPU. We're reporting two results here, both using 8K resolution, but at differing compression ratios.
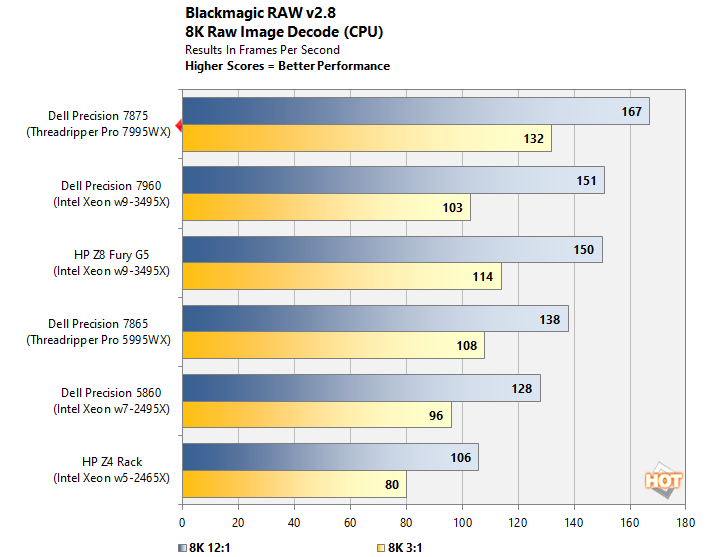
Well, by this point it's no surprise to see the Precision 7875 come in first place on a massively-parallel CPU benchmark like this. Even using the lightly-compressed 3:1 format—requiring the system to shuffle about an immense amount of video data—the Threadripper PRO 7995WX is able to decode 132 8K resolution video frames per second. But what about using a GPU?
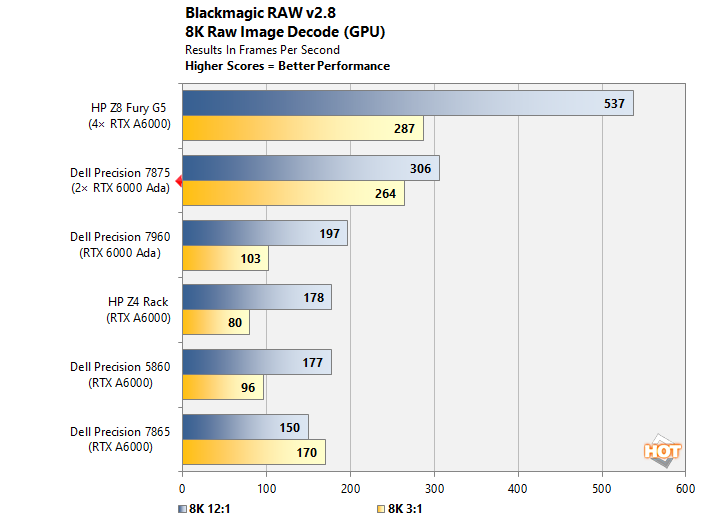
The Precision 7875 puts up a monstrous performance here, dominating everything except for the system with double the number of graphics cards—and it comes darn close to matching that machine's pace in the more-demanding 3:1 test. A Precision 7875 would make a killer Davinci Resolve system.
Blender Rendering Benchmarks
Blender is a free and open-source 3D creation suite that can handle everything from modeling, rigging, and animation to simulation, rendering, compositing, and motion tracking. It has a purpose-built benchmarking tool that will track the time it takes to complete rendering a particular model (or models). We used both the CPU and GPU focused benchmarks with all three models currently available in the benchmark tool.
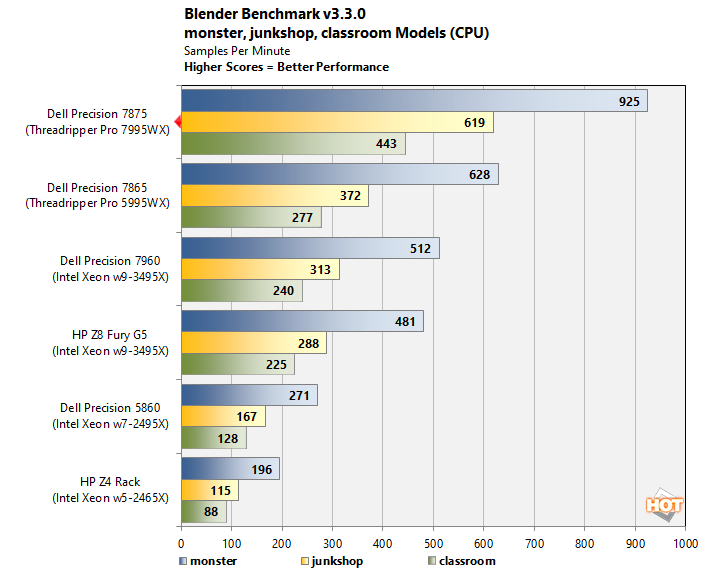
We're feeling a bit like a broken record here, but in the embarrassingly-parallel Blender CPU benchmark, the 96-core Threadripper Pro 7995WX takes it away with aplomb. Blender has been the domain of Zen for some time, and Sapphire Rapids hasn't been able to shift that fate.
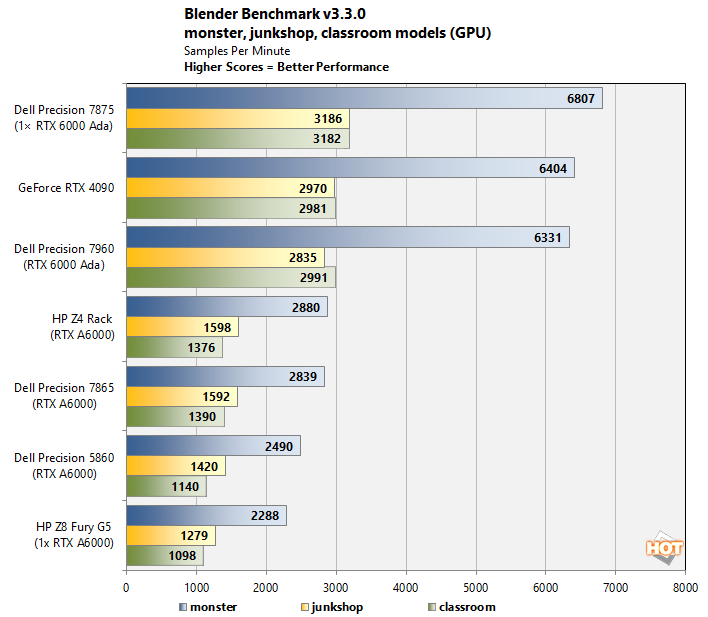
The Precision 7875 manages to come out on top in the GPU test, too. This benchmark doesn't make use of multiple graphics cards even though the Blender application itself is completely capable of doing so. As a result, it's just down to whichever machine is the fastest system with the biggest graphics card, and that means the Precision 7875.
SPECviewperf 2020 v3 OpenGL / DirectX Benchmarks
Industry-standard CAD benchmark SPECviewperf includes a variety of tests that produce significantly different framerates, so we’ve sorted them into three groups to make the results a bit easier to sift through. Please note the legends at the bottom of each chart indicating which test is which.
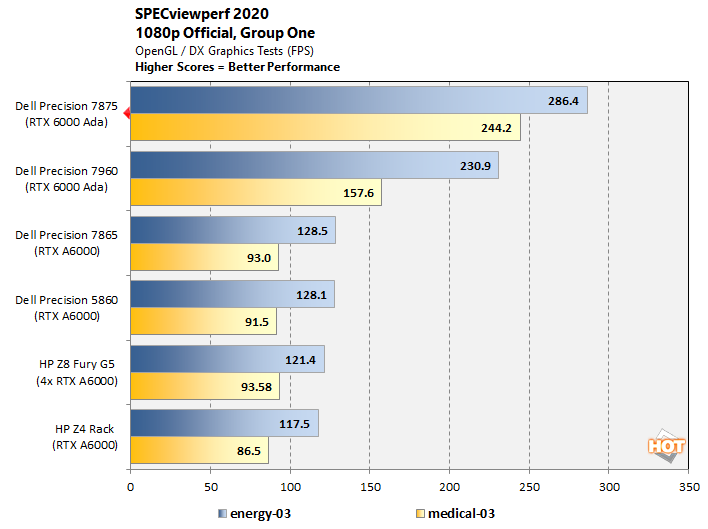
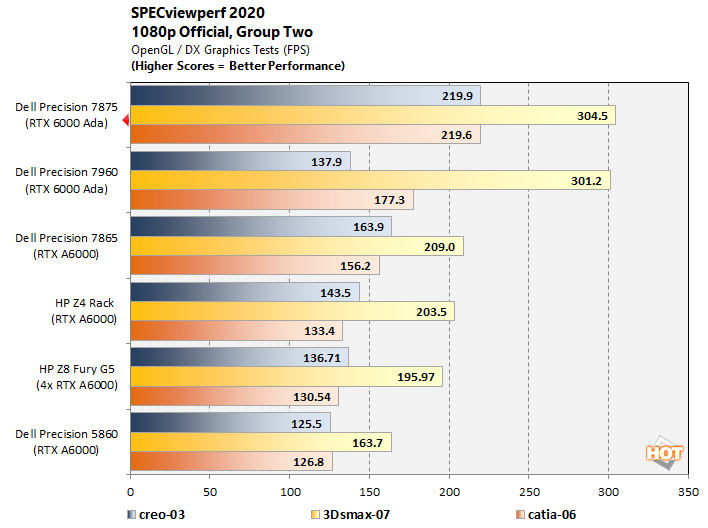
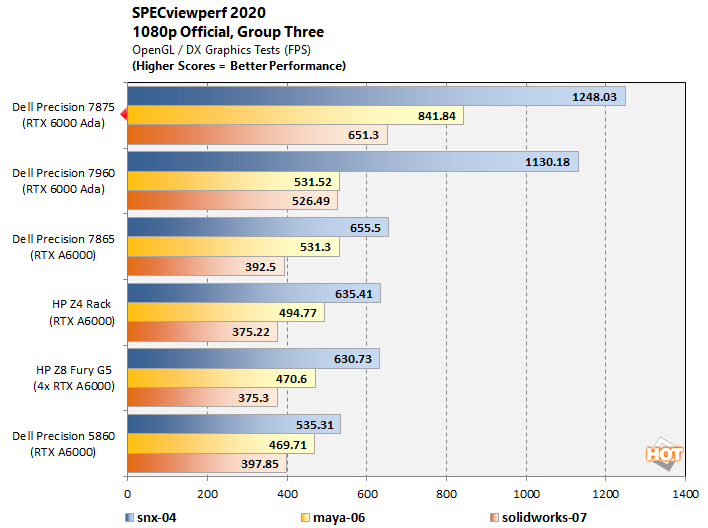
It's fascinating to see that, even though they sport the same graphics card, the Precision 7875 is consistently faster than its Xeon-based cousin, and sometimes by quite a bit. We're not sure if we'd chalk this up to the dramatically-higher memory bandwidth, the speedy Infinity Fabric interconnect, or perhaps the TR Pro 7995WX's high boost clock, and / or updated drivers and software on the newer machine. Whatever the case, it is consistently the fastest machine in our SPEC testing.
Stable Diffusion Generative AI Benchmark
We're experimenting with a few different AI workloads to expand our repertoire of tests. One of the most concrete applications of generative AI for end users is for the creation of detailed art or faux-tographs from just a few words of prompting for the machine intelligence. Stability AI's Stable Diffusion has emerged as one of the most popular options due to its open-source and "free as in speech" nature. Unlike cloud-based AI models such as DALL-E and Meta AI's Imagine, Stable Diffusion can run locally on your own PC and graphics card.
We used Stable Diffusion XL to generate 100 one-megapixel images in batches of five images at a time, and measured how long it took the machines to finish the task. The results below are in seconds.

Stable Diffusion, at least as presented by the AUTOMATIC1111 web UI, doesn't support running on multiple processors simultaneously. However, just like with LAME, that's easily resolved by running a second copy on the second graphics card. You can launch the UI on a specific GPU by using the "--device-id" launch parameter. There are some quirks to doing this—we found it to be a little unstable—but it does work.
Unfortunately, we don't have a lot of hardware to compare against yet, but it's interesting to see how much quicker AD102GL is in comparison to AD103. Some of this is down to the much larger local memory; Stable Diffusion XL uses both a "base" and "refiner" model, and the RTX 6000 Ada Generation cards are able to keep both models in their local memory while generating images, greatly accelerating the process. Meanwhile, the 16GB GeForce RTX 4080 has to unload one model to use the other, adding quite a bit of time to each batch generation.

The GeForce RTX 3080 and its 10GB of video RAM can use Stable Diffusion XL, but not with the settings that we were using -- it's simply too demanding and the process would bomb out with an out of memory error every time. Big local memory is critical for AI, especially for folks who are looking to train their own networks rather than simply performing inference as we are. It's unfortunate that NVIDIA decided to make NVLink exclusive to its datacenter GPUs this generation. Being able to gather the 48GB of local memory on each card into a single 96GB pool would be a really killer feature for this configuration.
All this performance must come at a price, right? Let's find out on the next page.