|
|
| Introduction, Specifications, and Related Info | ||||
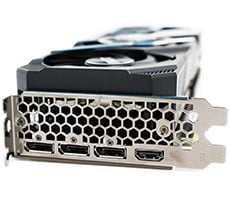
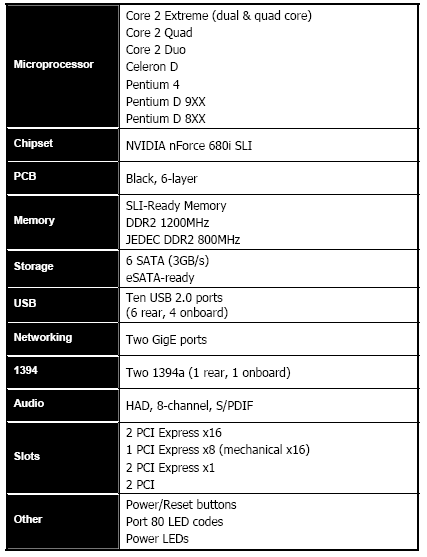
In case you haven't caught on by now, the "i" and "a" designations signify which platform the chipsets are designed for - i for Intel, a for AMD, obviously. The flagship member of the nForce 600i family of products, the nForce 680i SLI, is arguably the most feature-rich chipset to hit the Intel platform. With support for true, dual-PCI Express x16 graphics slots, plus a third x16 slot with a x8 electrical connection, 6 SATA ports, 10 USB ports, and dual Gigabit Ethernet, the 680i SLI is clearly targeted at enthusiasts. And adding to the appeal of the 680i SLI is a host of overclocking related tools that give end users a lot of freedom to experiment with different clock frequencies for not only the CPU, but also Memory and PCI Express slots as well. We'll cover the details on the pages ahead, and introduce you to the other members of the 600i family of products.
We've posted a number of articles in the past with information relative to today's launch of the nForce 600i series of chipsets. We've also got a comprehensive look at the new GeForce 8800 Series of graphics cards posted, which are launching alongside these new nForce chipsets today. But for a look at more details regarding NVIDIA's multi-GPU SLI platform as a whole, we recommend taking a look at a few of our other recent articles:
We know that's a lot of reading, but the information and performance data in the articles listed above will give you the background information and architectural details necessary to fully understand the new products being announced today. If you're unclear about anything on the proceeding pages, we recommend looking back to these articles for more information. |
| Other Members in the 600i Family |
In addition to the flagship nForce 680i SLI being launched today, NVIDIA is announcing two other members of the nForce 600i family of chipsets - the nForce 650i SLI and 650i Ultra.
As you can see in the chart above, all of the members of the nForce 600i family of chipsets have a few features in common, like support for nTune and MediaShield, but it's the 680i SLI that's outfitted with the lion's share of capability. The 680i SLI is equipped with 28 more PCI Exress lanes, more USB ports, more SATA ports, and it also supports DualNet, FirstPacket, LinkBoost, and higher-clocked EPP compatible memory. Each of the chipsets are targeted at a different audience though, and as such they'll hit at different price points. Motherboards based on the nForce 680i SLI chipset will likley sell in the $249 to $299 range, 650i SLI motherboards in the $149 to $199 range, and 650i Ultra boards in the $99 to $149. All of NVIDIA's partners are expected to release motherboards based on the nForce 600i family of chipsets in the coming weeks and months. |
| Features and Benefits: DualNet & FirstPacket | ||||||||||
The new nForce 680i SLI chipset has many features in common with the nForce 590 SLI that came before it, namely DualNet, FirstPacket, LinkBoost, EPP, MediaShield and nTune support.
As its name implies, DualNet is a reference to the dual independent Gigabit Ethernet MACs incorporated into the nForce 680i chipset. DualNet is more than a pair of MACs though. Both GigE MACs feature TCP/IP acceleration which offloads many functions from the host processor to lower CPU utilization, and both can do RSS, or Receive Side Scaling.
Having dual independent MACs gives NVIDIA the ability to link a pair of GigE LAN connections together to enable Teaming with Failover protection. With Teaming, both GigE connections are essentially linked, and appear as a single 2Gb connection for double the theoretical max bandwidth to the network. And with Failover protection, should one of the GigE connections be compromised in any way, the other automatically takes over and keeps the system connected to the network.
Another new feature integrated into NVIDIA's DualNet engine is dubbed FirstPacket. FirstPacket is a technology that lets user's prioritize data packets from specified applications, like games for example.
When multiple applications are in contention for network resources a typical configuration will arbitrarily balance the load between applications. But with FirstPacket, a user can specify a particular application, and when that application is sending data packets, the FirstPacket Prioritizer sends those packets to a dedicated queue, and in turn they are prioritized ahead of other applications. FirstPacket will be useful for gamers who want to keep their pings as low as possible while running other applications that also use network resources (FTP, IM Clients, etc.), or for those who use VoIP applications like Skype on regular basis. |
| Features and Benefits: MediaShield and LinkBoost | ||||||||
NVIDIA also updated the storage capabilities of the nForce 600 family of chipsets. The nForce 680i SLI in particular has six native SATA ports capable of 3.0Gb/s transfer rates. The nForce 650i SLI and 650i Ultra however, have only four.
Having six SATA ports all under the control of NVIDIA's MediaShield gives these 680i SLI chipset a couple of new capabilities. Having six SATA ports gives users the ability to configure multiple independent RAID arrays, like dual 3-disk RAID 5 arrays, for example, or even large six-disk RAID arrays. The MediaShield 3.0 application itself has even gotten a bit of a facelift to unify its look with NVIDIA's graphics, networking, and nTune interfaces. NVIDIA also plans to incorporate drive specific tuning into MediaShield, which should offer performance enhancements to those with supported drives. As of now Western Digital's WD1500 appears to be the first and only drive that NVIDIA has specifically optimized for. Lastly, to simplify the installation and configuration of RAID arrays, Microsoft's upcoming Windows Vista should ship with drivers and support for MediaShield.
Another feature incorporated into the 680i SLI is called LinkBoost. With LinkBoost, key interfaces between the SPP, MCP and PCI Express graphics cards are clocked higher than normal, which then increases the bandwidth between the components. We hesitate to call LinkBoost sanctioned overclocking, because the higher clocks have been certified by NVIDIA and there is still headroom for overclocking available when LinkBoost is enabled. For now, LinkBoost is only supported on the nForce 590 SLI and 680i SLI when used in conjunction with GeForce 7900 and 8800 GTX/GTS graphics cards. The HT link between the SPP and MCP, and the PCI Express links between the graphics cards and the chipset are increased by 25% with LinkBoost, for effective clock speeds of 1250MHz and 125MHz, respectively. The higher clocks result in an increase of available bandwidth from 8GB/s to 10GB/s. We should note, however, that the HT link between the CPU and the chipset is NOT affected by LinkBoost, so the CPU and its HT link are not affected in any way. LinkBoost is designed to offer more bandwidth between the chipset and graphics cards autonomously. |
| Features and Benefits: EPP and nTune | |||||||||
Another feature incorporated into the nForce 600i family of products required the cooperation of Corsair to bring to fruition. Enhanced Performance Profiles, or EPP, is a feature designed to maximize system performance by automatically tweaking memory and CPU frequencies, multipliers and voltages. If you'd like to take a look at the official announcement from Corsair, it's available as a PDF download from their on-line virtual press room. The announcement was made on May 15, 2006.
EPP is a new open memory standard that we expect will be adopted by a number of motherboard and memory manufacturers. Enhanced Performance Profiles increases performance by taking advantage of additional memory parameters added to the unused portion of a standard JEDEC Serial Presence Detect, or SPD. The JEDEC specification only calls for small amount of data to be stored in a standard SPD, which leaves a significant amount of unused space. EPP takes advantage of this space to store specific information about the modules, like their maximum supported frequencies and timings. EPP also needs motherboard support to function as well. To support EPP a motherboard's BIOS has to be programmed to snoop the upper portion of the SPD to find the EPP relevant data. That data is then used in conjunction with a pre-determined set of parameters stored in the system BIOS to automatically tweak performance. For example, if the EPP data stored in the SPD states a particular memory kit is capable of running at 1066MHz with 5-5-5-12 timings, EPP will automatically alter the processor's multiplier, voltage and bus speed, along with the memory voltage, to get as close to the memory's rated speed as possible. EPP will also overclock the processor by a user determined percentage to hit the memory's rated speed.
To coincide with the launch of the nForce 600i family, NVIDIA is also releasing a new version of their nTune system tweaking utility. When used with a motherboard that has all of the BIOS hooks necessary to support nTune, the application gives users the ability to alter virtually every performance related BIOS option from within Windows. Take a look at the screen-shot above to see the vast number of options that can be altered with nTune. With the exception of the CPU multiplier, you'll see that there's nothing in regard to the CPU, chipset, and memory that can't be tweaked. When they launched the nForce 500 series of chipsets, NVIDIA sent over a handful of Flash animations to help explain the features and benefits of the chipsets. Because many of the features are essentially unchanged, we thought we'd re-use some of these animations for those of you that would like to get a visual representation of how the features we've talked about on the preceding pages work. The animations are not very big, so even the unfortunate among you that are still on dial-up, should be able to see them all very quickly. |
| Our Test Systems & SiSoft SANDRA | |||||||||||||||
How we configured our test systems: When configuring our test systems for the following set of benchmarks, we first entered their respective system BIOSes and set each board to its "Optimized" or "High-Performance Defaults." We then saved the settings, re-entered the BIOS and set memory timings for DDR2-800 with 4,4,4,12 1T timings. The hard drives were then formatted, and Windows XP Professional (SP2) was installed. When the Windows installation was complete, we installed the drivers necessary for our components, and removed Windows Messenger from the system. Auto-Updating and System Restore were then disabled, and we set up a 1024MB permanent page file on the same partition as the Windows installation. Lastly, we set Windows XP's Visual Effects to "best performance," installed all of our benchmarking software, defragged the hard drives, and ran all of the tests.
We began our testing with SiSoftware's SANDRA, the System ANalyzer, Diagnostic and Reporting Assistant. We ran three of the built-in subsystem tests that partially comprise the SANDRA 2007 suite (CPU, Multimedia, and Memory) with the new EVGA nForce 680i SLI motherboard. All of the scores reported below were taken with our Core 2 Duo X6800 processor running at its default clock speed of 2.93GHz.
SANDRA's relatively light-duty CPU Arithmetic, Multimedia, and Memory Bandwidth benchmarks didn't reveal anything out of the ordinary. The EVGA nForce 680i SLI motherboard performed right on par with, or slightly better than the 975X Express reference system in SADNRA's database in the CPU and Multimedia tests. The Memory Bandwidth benchmark, however, showed the 975X Express with a slight edge, but advantages in a synthetic test like this one don't always translate into any real-world performance gains. |
|||||||||||||||
| PCMark05: CPU and Memory | |||||
For our next round of synthetic benchmarks, we ran the CPU and memory performance modules built into Futuremark's PCMark05 suite.
"The CPU test suite is a collection of tests that are run to isolate the performance of the CPU. The CPU Test Suite also includes multithreading: two of the test scenarios are run multithreaded; the other including two simultaneous tests and the other running four tests simultaneously. The remaining six tests are run single threaded. Operations include, File Compression/Decompression, Encryption/Decryption, Image Decompression, and Audio Compression" - Courtesy FutureMark Corp.
All of our Core 2 Extreme X6800 test systems performed similarly in the PCMark05's CPU performance module. The EVGA nForce 680i SLI motherboard finished right behind the 975X Express, followed by the nForce 590 SLI Intel Edition.
"The Memory test suite is a collection of tests that isolate the performance of the memory subsystem. The memory subsystem consists of various devices on the PC. This includes the main memory, the CPU internal cache (known as the L1 cache) and the external cache (known as the L2 cache). As it is difficult to find applications that only stress the memory, we explicitly developed a set of tests geared for this purpose. The tests are written in C++ and assembly. They include: Reading data blocks from memory, Writing data blocks to memory performing copy operations on data blocks, random access to data items and latency testing." - Courtesy FutureMark Corp.
PCMark05's memory performance module had all of the Core 2 Extreme X6800 systems finishing within a few points of one another. Technically, the 975X Express finished in first place, followed by the nForce 680i SLI and then the 590 SLI Intel Edition, but the <100 point spread between the three is hardly significant. |
| Office XP SP2 and Photoshop 7.0 | ||||
PC World Magazine's WorldBench 5.0 is a Business and Professional application benchmark. The tests consist of a number of performance modules that each utilize one, or a group of popular applications to gauge performance.
Below we have the results from WorldBench 5.0's Office XP SP2 and Photoshop 7 modules, recorded in seconds. Lower times indicate better performance here, so the shorter the bar the better.
The new EVGA nForce 680i SLI motherboard performed very well in WorldBench 5.0's Office XP and Photoshop performance modules. In the Office test, the 680i SLI put up the fastest time by about 3 seconds. In the Photoshop test, the 680i SLI was just slightly slower than the 975X Express - by 1 second to be exact - but both the 680i SLI and 975X Express were marginally faster than all of the other systems. |
| LAME MT and Sony Vegas | ||||||||
In our custom LAME MT MP3 encoding test, we convert a large WAV file to the MP3 format, which is a very popular scenario that many end users work with on a day-to-day basis to provide portability and storage of their digital audio content.
In this test, we created our own 223MB WAV file (a never-ending Grateful Dead jam) and converted it to the MP3 format using the multi-thread capable LAME MT application in single and multi-thread modes. Processing times are recorded below. Once again, shorter times equate to better performance.
Things couldn't have been closer in our custom LAME MT audio encoding benchmark. In this test, all three of the Intel powered systems finished with the exact same score, which was significantly faster than the AMD-powered system.
Sony's Vegas DV editing software is heavily multithreaded as it processes and mixes both audio and video streams. This is a new breed of digital video editing software that takes full advantage of current dual and multi-core processor architectures.
The graph above makes it look like there is a relatively large delta separating the 975X Express, 680i SLI, and 590 SLI Intel Edition motherboards, but things are not always exactly as they appear. Performance with the same platform can vary by about 5-10 seconds in the Sony Vegas benchmark from run to run. Our results put the 975X Express on top, followed by the 680i SLI, but we consider the 12 second delta separating the two platforms small when we take into account the slight variability in this test. |
| Kribibench v1.1 | ||||
For this next batch of tests, we ran Kribibench v1.1, a 3D rendering benchmark produced by the folks at Adept Development. Kribibench is an SSE aware software renderer where a 3D model is rendered and animated by the host CPU, and the average frame rate is reported.
We used two of the included models with this benchmark: a "Sponge Explode" model consisting of over 19.2 million polygons and the test suite's "Ultra" model that is comprised of over 16 billion polys.
The Intel 975X Express had a distinct advantage in the Kribibench benchmark, regardless of the model being rendered, and despite the fact that all of the test systems were powered by the exact same processor and graphics card. As you can see, the 975X Express took the top spot in both Kribibench tests, followed closely behind by the nForce 680i SLI, and then the 590 SLI Intel Edition. |
| POV-Ray | ||||
POV-Ray, or the Persistence of Vision Raytracer, is a top-notch open source tool for creating 3D graphics artwork. We tested with POV-Ray's standard included benchmarking model on both test machines and recorded the scores reported for each. Results are measured in pixels-per-second throughput.
We had a virtual photo-finish in the POV-Ray benchmark. In this test, the EVGA nForce 680i SLI finished in first place, followed very closely behind by the 975X Express. The nForce 590 SLI Intel Edition took the third position, with the AMD-powered rig finishing in last by a wide margin. For all intents and purposed though, the Intel-powered systems all performed at the same level. The 19 points separating the third and first place finishers falls well within the margin of error in this test. |
| Cinebench and 3DMark06: CPU | ||||||||
The Cinebench 2003 benchmark is an OpenGL 3D rendering performance test, based on the commercially available Cinema 4D application. Cinema 4D from Maxon is a 3D Rendering and Animation suite used by many 3D Animation houses and producers like Sony Animation and many others. And of course it's very demanding of system processor resources.
This is a multi-threaded, multi-processor aware benchmark that renders a single 3D scene and tracks the length of the entire process. The time it took each test system to render the entire scene is represented in the graph below (listed in seconds).
It was another tight race in the Cinebench benchmark. In the single-threaded test, the 975X Express outpaced the new 680i SLI by a measly 1 second. But in the all important multi-threaded test, NVIDIA's and Intel's current flagship chipsets finished with the exact same score.
3DMark06's built-in CPU test is a multi-threaded "gaming related" DirectX metric that's useful for comparing relative performance between similarly equipped systems. This test consists of two different 3D scenes that are generated with a software renderer that is dependent on the host CPU's performance. This means that the calculations normally reserved for your 3D accelerator are instead sent to the central processor. The number of frames generated per second in each test are used to determine the final score.
3DMark06's multi-threaded CPU performance module had the nForce 680i SLI-based system finishing in the top spot, with the 975X Express and nForce 590 SLI Intel Edition finishing in second and third place, respectively. A relatively small delta of 22 points separated the 975X Express and 680i SLI, but the 590 SLI Intel Edition faltered here, with a score almost 100 points behind the new 680i SLI. |
| Quake 4: Low and High Resolutions | ||||
For our next set of tests, we benchmarked all of the test systems using a custom single-player Quake 4 timedemo. Here, we installed the game's official v1.3 point release which is SMP capable and ran some tests in two configurations. First, we turned the resolution down to 640x480, and configured the game to run at its "Low-Quality" graphics setting. Although Quake 4 typically taxes today's high-end GPUs, when it's configured at these minimal settings, it is much more CPU and memory bandwidth-bound than anything else. In the second set of tests, we cranked the resoltuion to 1600x1200 and enabled 4X anti-aliasing and 16X anisotropic filtering to see how each board performed in a more GPU bound situation.
Our custom low-resolution Quake 4 benchmark had the EVGA nForce 680i SLI motherboard finishing in first place, outpacing the 975X Express by 2.5 frames per second. Not a large margin of victory, but a victory for the 680i SLI nonetheless.
The tables turned in favor of the 975X Express in our high-resolution Quake 4 benchmark. This time around, the Intel-built chipset took the pole position, followed very closely behind by the nForce 680i SLI. The 975X Express' margin of victory was only 1.6 frames per second though, which equates to only a 1.3% difference. |
| F.E.A.R. Low and High Resolutions | ||||
For our last set of game tests, we moved on to more low- and high-resolution benchmarking with F.E.A.R. When testing all processors and motherboards with F.E.A.R, we drop the resolution to 640x480, and drop all of the in-game graphical options to their minimum values to isolate CPU and memory performance as much as possible. However, the in-game "effects" and "advanced computer options" settings, which control the level of detail for F.E.A.R.'s physics engine and particle system, were all set to maximum values since these actually do place loads on the CPU rather than GPU. The opposite is true in the high-resolution test, where a more significant load is placed on the graphic sub-system, hence the lower framerates reported in the second graph below.
The low-reslution F.E.A.R. tests were a virtual dead-heat. Only 2 frames per second, or approximately .8%, separated the first place 975X Express from the second place nForce 680i SLI.
The high-resolution F.E.A.R. benchmark however, went to the nForce 680i SLI. In this test, the new nForce 680i SLI put up 76 frames per second, 1 more frame than the 975X Express. |
| Power Consumption and Heat | ||||
We have a few final data points to cover before bringing this article to a close. Throughout all of our benchmarking, we monitored how much power our nForce 680i SLI based test system was consuming using a power meter. Our goal was to give you all an idea as to how much power each configuration used while idle and under a CPU load. Please keep in mind that we were testing total system power consumption here, not just the power being drawn by the motherboards and processors alone.
The nForce 680i SLI motherboard consumed marginally more power than any of the other systems while idling, but surprisingly it consumed a bit less power than the nForce 590 SLI Intel Edition under load. The 975X Express-based system consumed considerably less power at idle and under load, but there are some things to take into remember looking at these numbers. The nForce 680i SLI has more than double the amount of PCI Express lanes than the 975X Express, and the EVGA nForce 680i SLI motherboard we used for testing has a host of integrated peripherals that all consume some level of power. |
| Our Summary and Conclusion | ||||
Performance Summary: The nForce 680i SLI performed very well throughout all of our testing. In every benchmark we ran, our nforce 680i SLI-based system performed on-par or better than a reference system based on Intel's flagship 975X Express chipset. It also outpaced an Asus P5N32-SLI Premium motherboard, powered by the older nForce 590 SLI Intel Edition chipset, in every test.
NVIDIA clearly is bringing a winning product to market with the nForce 680i SLI. The chipset supports all current and some future Intel processors, its performance it top notch, and it's a very good overclocker. The nForce 680i SLI is also arguably the most feature-rich chipset to ever be released for the Intel platform. NVIDIA is the only company to offer a solution for the Intel platform with true, dual PCI Express x16 graphics slots, it has six native SATA ports with RAID support, dual-Gigabit LAN, HD Audio, and a flexible memory controller. And let's not forget that the only way to get SLI support with an Intel processor is with an nForce SLI based motherboard. The nForce 680i SLI is impressive in just about every category concerning features and performance. The proposed price point puts motherboards based on this chipset in a higher bracket, but since when do enthusiasts not pay top dollar for flagship products? Power consumption was also relatively high versus Intel's 975X Express, but that too is to be expected considering the nForce 680i SLI has more PCI Express lanes and features in general. Overall, we really liked the nForce 680i SLI, and we're giving the EGA reference board we tested high marks on the Heat Meter; a 9 to be exact. Anyone looking to build a high-end, SLI capable rig, powered by an Intel processor will likely be pleased by the nForce 680i SLI.
|