Intel Solid State Drive 335 Series SSD Review
The solid state storage market has rapidly evolved over the last four years or so. Whereas early drives were relatively slow and offered inconsistent performance, current high-end drives routinely approach the limits of the SATA interface and off much better performance, both in terms of sequential and random IO operations. Over the same time period, solid state drives have also gotten significantly more affordable. It wasn’t that long ago that sought-after SSDs were commanding $3-4 a gigabyte. Now though, a quality, brand name, high performance SSD can be had for less than $1 a gigabyte.
Much of the price reduction in the SSD market is due to fierce competition among companies vying for storage dollars, but it’s also due to the use of more advanced, cheaper to produce NAND flash memory. The drive we’ll be showing you here today, the recently released Intel SSD 335, supports that fact. The Intel SSD 335 is the company’s first drive to ship with NAND flash memory produced using a 20nm process. Intel claims the drive “uses the smallest, most efficient multi-level cell NAND flash on the market”. The flash memory used on the Intel SSD 335 was jointly developed my Intel’s and Micron’s IM Flash Technologies (IMFT) and was announced last April, but is now ready for prime time in a drive targeting the sweet spot of the enthusiast and DIY market.
;)
|
| Model Name | Intel Solid-State Drive 335 Series |
| Capacity | 240GB |
| NAND Flash Memory | 20nm Intel NAND Flash Memory Multi-Level Cell (MLC) |
| Bandwidth | Sustained Sequential Reads up to: 500 MB/s Sustained Sequential Writes up to: 450 MB/s |
| Random IOPS (4KB) | Reads up to: 42,000 IOPS Writes up to: 52,000 IOPS |
| Interface | SATA 6Gb/s, compatible with SATA 3Gb/s |
| Form Factor, Height and Weight | 2.5 inch, 9.5mm, up to 78 grams |
| Life Expectancy | 1.2 million hours Mean Time Between Failures (MTBF) |
| Power Consumption | Active: 350 mW Typical Idle: 275 mW Typical |
| Operating Temperature | 0°C to 70°C |
| RoHS Compliance | Meets the requirements of European Union (EU) RoHS Compliance Directives |
| Software Tools | Intel Solid-State Drive Toolbox with Intel SSD Optimizer at www.intel.com/go/ssdtoolbox Intel Data Migration Software at www.intel.com/go/ssdinstallation |
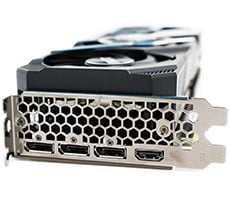
The Intel SSD 335 looks much like many of Intel’s current solid state drives. It conforms to the 2.5” form factor with 9.5mm Z-Height so prevalent among consumer SSDs and uses the familiar silver enclosure we’ve seen on so many other Intel-branded drives.
;)
;)
According to its specifications, the Intel 335 SSD offers up to 500MB/s sequential reads and 450 MB/s sequential writes over its SATA 6Gbps interface, with up to 42,000 4K read IOPS and 4K writes up to 52,000 IOPS. If specs like those look somewhat familiar, it’s because they’re in line with other solid state drives built around LSI's popular SandForce SF-2281 controller.
;)
;)
;)
The Intel SSD 335's SandForce controller and 20nm IMFT MLC NAND
It’s the new NAND inside the Intel SSD 335 that’s the star of the show here. Historically, as flash memory is produced on smaller and smaller process nodes, reliability is a larger concern. According to Intel, however, the 20nm IMFT MLC NAND used in this drive has a new cell structure that enables more aggressive cell scaling than conventional architectures. The 20nm 64Gb NAND uses a new planar cell structure that results in performance and reliability that is on par with the previous 25nm generation of NAND memory. The planar cell structure reportedly overcomes the scaling constraints of the standard NAND floating gate cell by integrating the first Hi-K/metal gate stack in NAND production. We obviously won’t know what long term reliability actually looks like for a while, but the drive carries a 3 year warranty and has the same endurance specifications as the SSD 330 series, which uses 25nm NAND.
;)
The particular drive you see pictured above is a 240GB model, but it is actually outfitted with 256GB of flash memory. The remaining 16GB is provisioned for wear leveling, garbage collection, and other proprietary features to ensure long-term reliability and more consistent performance. Like other Intel SSDs, the drive also comes bundled with a few extras, including a 2.5” to 3.5” adapter tray, power and SATA cables, mounting screws, documentation, and a “Speed Demon” decal to show your friends what your system is packing.