|
|
| Introduction and Related Info |
Late last week, we posted a glimpse of what AMD had in store with their latest A-Series APUs for desktop systems. In that article, we were able to officially unveil the Virgo platform and discuss speeds and feeds, GPU performance, and power consumption characteristics. However, we weren’t able to disclose any CPU performance numbers, overclocking data, or pricing. We know some of you aren’t too fond of cliffhangers that leave out important data like that, but thankfully we can give you all the full scoop here today. In those two articles, we cover all pertinent architectural details and features, spotlight AMD’s latest A-Series mobile platform and cover desktop A-Series GPU performance.
We've had a couple of AMD's latest A-Series APUs in-house for a while now; more specifically the flagship AMD A10-5800K and the A8-5600K. Both of these APUs are quad-core variants, with 100W TDPs, and unlocked CPU and GPU multipliers for easier overclocking. AMD, however is also launching a host of other A-Series APUs, with varying features and specifications. The complete breakdown of the AMD A-Series APUs launching today is as follows:
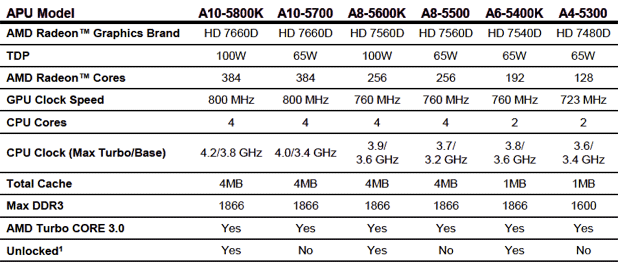
As you can see, the A10-5800K is the top of the line model. It sports an integrated Radeon HD 7660D GPU with 384 active Radeon Cores, that run at 800MHz. There is 4MB of total cache on-board, and the CPU portion of the chip runs at a base clock of 3.8GHz which can Turbo up to 4.2GHz. The A8-5600K, however, is outfitted with an integrated Radeon HD 7560D, which has only 256 active Radeon Cores and a slightly lower frequency of 760MHz. The A8-5600K's CPU cores run at a base clock of 3.6GHz and Turbo up to 3.9GHz, but it has the same 4MB of total cache of its higher-end counterpart. |
| Test Setup and SiSoft SANDRA | ||||||||||||
Test System Configuration Notes: When configuring our test systems for this article, we first entered their respective system BIOSes or UEFIs and set each board to its "Optimized" or "High performance Defaults". We then saved the settings, re-entered the BIOS/UEFI and set the memory speed to each platform's maximum, officially supported speed--DDR3-1866 in the case of Virgo. The solid state drives were then formatted, and Windows 7 Ultimate x64 was installed. When the Windows installation was complete, we fully updated the OS, and installed the drivers necessary for our components. Auto-Updating and Windows Defender were then disabled and we installed all of our benchmarking software, performed a disk clean-up, cleared any prefetch and temp data, and ran the tests.
Despite their new architecture and much higher base and Turbo frequencies, the AMD A10-5800K and A8-5600K offer only marginal improvements in performance over previous-gen products according to SANDRA. As the processor and multimedia benchmarks show, the A10-5800K and A8-5600K are only marginally faster than a Phenom II X4 965 and hang with older Core 2 Quads. Memory bandwidth is in the 11.1 - 11.4GB/s range, and like Bulldozer-based FX-Series processors, cache latency is unfortunately much higher than previous-gen products. |
| Futuremark PCMark 7 | ||||
Futuremark's PCMark 7 is the latest version of the PCMark whole-system benchmarking suite. It has updated application performance measurements targeted for a Windows 7 environment and uses newer metrics to gauge relative performance.
Below is what Futuremark says is incorporated into the base PCMark suite and the Entertainment, Creativity, and Productivity suites--the four modules we have benchmark scores for you here.
PCMark7 shows the AMD A10-5800K and A8-5600K outpacing the Llano-based A8-3870K and coming close to the Bulldozer-based FX-8150, but AMD's latest APUs can't quite hang with any of the Intel processors we tested. The Core i3 and i5 processors showed huge gains in a couple of tests, especially the creativity test where their Quick Sync encoding engines show their might, but the AMD APUs actually pulled ahead in the productivity benchmark. |
| LAME MT and SunSpider | ||||||||
In our custom LAME MT MP3 encoding test, we convert a large WAV file to the MP3 format, which is a popular scenario that many end users work with on a day-to-day basis to provide portability and storage of their digital audio content. LAME is an open-source MP3 audio encoder that is used widely in a multitude of third party applications.
In this test, we created our own 223MB WAV file (a hallucinogenically-induced Grateful Dead jam) and converted it to the MP3 format using the multi-thread capable LAME MT application, in both single and multi-thread modes. Processing times are recorded below, listed in seconds. Shorter times equate to better performance.
Audio encoding with LAME MT is definitely not one of Piledriver's strong suits. The A10-5800K and A8-5600K outpace the fastest Llano chip here, but Intel's parts simply dominate.
Next up, we have some numbers from the SunSpider JavaScript benchmark. According to the SunSpider website:
All of the systems were tested using the latest version of Internet Explorer 9, with default browser settings, on a clean install of Windows 7 Ultimate x64.
The A10-5800K and A8-5600K were once again somewhat faster than the Llano-based A8-3870K in the SunSpider benchmarks, but every other processor we tested had a huge advantage. Piledriver's lower IPC and higher cache latency versus Intel's offerings certainly hold it back here. |
| Cinebench R11.5 and POV-Ray | ||||||||
Cinebench R11.5 is a 3D rendering performance test based on Cinema 4D from Maxon. Cinema 4D is a 3D rendering and animation suite used by animation houses and producers like Sony Animation and many others. It's very demanding of processor resources and is an excellent gauge of pure computational throughput.
This is a multi-threaded, multi-processor aware benchmark that renders a photorealistic 3D scene (from the viral "No Keyframes" animation by AixSponza). This scene makes use of various algorithms to stress all available processor cores. The rate at which each test system was able to render the entire scene is represented in the graph below.
The new A10-5800K and A8-5600K didn't do so well in the Cinebench benchmark. AMD's latest APUs are able to compete well with Llano in terms of single-thread performance, but their shared FPU resources result in lower multi-thread performance versus every other processor we tested in this benchmark.
POV-Ray, or the Persistence of Vision Ray-Tracer, is an open source tool for creating realistically lit 3D graphics artwork. We tested with POV-Ray's standard 'one-CPU' and 'all-CPU' benchmarking tools on all of our test machines, and recorded the scores reported for each. Results are measured in pixels-per-second throughput; higher scores equate to better performance.
POV-Ray tells a similar story to Cinebench. Here, the new A10-5800K and A8-5600K offer somewhat better single-thread performance than Llano, but trail once again in the multi-threaded test. AMD's latest APUs, however, are able to pull ahead of the Core i3's here. |
| Media Encoding and Image Editing | ||||||||
Cyberlink's MediaEspresso is a video conversion tool that imports various video file types and converts them to other formats for publication, portability and/or streaming. In this test, we take a 277MB high definition 1080p AVCHD video clip and convert it to a an H.264 encoded MP4 compatible file designed for use with an iPhone / iPad (or other portable media playback device).
Here we're going to look directly at AMD's HD Media Accelerator in the new A10 and A8 series APUs and compare it to Intel's Ivy Bridge Quick Sync engine and competitive CPU-based solutions as well.
AMD's updated media accelerator offers a huge speed improvement over the CPU alone, but it can't come close to matching the performance of Intel's Quick Sync engine.
Musemage is a fully functional GPU-powered photo editing software suite. Thanks to the GPU accelerated filters built into the app, Musemage can leverage the additional performance afforded by a more powerful GPU and offer real-time (or near real-time) visual feedback. The application also offers a built-in benchmark, which output performance as a final "score". The score put up by each test system is represented in the graph below.
When AMD's A-Series APUs are able to leverage the additional performance offered by their relatively powerful integrated GPU's they put up some pretty good scores. Because the Intel processors have to handle the workload on their own, without assistance from a GPU, they lag behind AMD here. |
| Overclocking Desktop Trinity | ||||
We took a bit of time to overclock AMD's higher-end A10-5800K APU as it'll likely be one of the more popular chips in AMD's new line-up that performance enthusiasts will want to tinker with. Overclocking the A10 is somewhat delicate work, perhaps more so than previous AMD architectures. Dialing up frequency on the IGP will undoubtedly contribute to additional thermal stress on your cooling solution, affecting the CPU, and vice-versa for that matter. You also do not need a lot of extra voltage in order to overclock AMD's new desktop APU. Crank VID too high and you'll generate excess heat that will cause the CPU to throttle without high-end cooling.
We settled in on a 1.418V VID core voltage on the CPU with a stock 100MHz reference clock and a multiplier of 44X, giving us a top CPU speed of 4.4GHz under load. This was achieved on standard air cooling and our DDR3 system memory set to 1866MHz. Our GPU speed was able to hit 1GHz with full stability as well, over a stock speed of 800MHz. This may seem like a modest overclock but we accomplished this with a run of the mill aftermarket air cooler, the Thermaltake TR2 R1. Results may vary chip-to-chip and system-to-system but with more robust air cooling, liquid cooling or some other higher-end solution, there is definitely even more headroom available beyond what we're able to show you here.
The benefits of overclocking are apparent as always, with roughly a 10% kicker in CPU performance realized and a 15 - 17% increase in GPU performance for the overclocked Trinity A10 APU. On a side note, overclocking the GPU on the A10 is easy money. With a simple push of the clock slider 1GHz is attainable with virtually no fuss. Overclocking the CPU can take a bit more finesse with reference clock speeds, multipliers and voltages to balance. |
| Performance Summary and Conclusion | ||||
Performance Summary: In last week’s article detailing GPU performance, AMD’s latest Trinity-based APUs put up scores that easily outpaced Intel’s integrated graphics offerings. Today’s look at CPU performance, however, tells an entirely different story. The A10-5800K and A8-5600K generally offer better performance than the previous-generation Llano-based APUs they’ll be supplanting in AMD’s desktop APU line-up. Versus Intel’s similarly priced desktop offerings, however, the picture isn’t as rosy. The dual-core Core i3-3220 and i3-3225 keep pace with and in many cases significantly outpace AMD’s latest APUs.
|