Asus P5Q Deluxe - P45 Chipset with DDR2

![]() As many of you are no doubt aware, Intel is planning to officially release a new mainstream chipset in a few weeks, the P45. From a feature standpoint, the new P45 is somewhat similar to last year's P35. The P45, however, will have official support for PCI Express 2.0, with a more flexible lane configuration for multi-GPU graphics, and the chipset itself is being manufactured at 65nm as opposed to 90nm. Using the more advanced process to build the chips should result in lower power consumption and lower operating temperatures as well. The P45 will also be paired up with a new ICH10-series southbridge, which is similar to the ICH9 sans a few legacy features.
As many of you are no doubt aware, Intel is planning to officially release a new mainstream chipset in a few weeks, the P45. From a feature standpoint, the new P45 is somewhat similar to last year's P35. The P45, however, will have official support for PCI Express 2.0, with a more flexible lane configuration for multi-GPU graphics, and the chipset itself is being manufactured at 65nm as opposed to 90nm. Using the more advanced process to build the chips should result in lower power consumption and lower operating temperatures as well. The P45 will also be paired up with a new ICH10-series southbridge, which is similar to the ICH9 sans a few legacy features.
Asus showed off a few P45-based motherboards at the CeBit show a while back, but at the time, the boards weren't quite ready for the market. We have, however, gotten our hands on final production version of the Asus P5Q Deluxe, which should be available soon.
;)
;)
;)
;)
Asus P5Q Deluxe: P45 with DDR2 Memory Support
As you can see in the images above, the P5Q Deluxe sports a large passive, all copper cooling system, very similar to the P5E3 series of boards. There are heatsinks over the northbridge and sourthbridge, and over the baord's VRM, which are all linked together via a copper heat-pipe system. Although the elaborate cooling may make it seem like the P45 needs plenty of cooling, we found this board to run incredibly cool. In fact, even after hours of use, the NB heatsinks was barely warm to the touch.
The Asus P5Q Deulxe has three physical PCI Express x16 slots, dual PCIe x1 slots, and a pair of PCI slots. And as we've mentioned the PCI Express lanes to the PEG slots is flexible - unlike the P35 - so they can be setup in either a x16 / x1 or x8 / x8 configuration depending on how many graphics cards are installed. Audio duties on the board are handled by an ADI2000B HD codec, Gigabit Ethernet by Marvell 88E8001 and 88E8056 controllers, and the I/O backplane is loaded with six USB 2.0 ports, dual LAN jacks, a PS/2 mouse or keyboard port (notice the two-tone colored port), digital and analog audio outputs, Firewire, and eSATA.
If you look between the second PCI and PCIe x16 slots, a flash memory card is visible, which features the "Express Gate", Linux-based mini-OS we told you about here. The version installed on the P5Q Deluxe, however, has been updated to add more features and functionality. Finally, we should note a few other new features Asus is touring with this board. The P5Q Deluxe has ESD and Overcurrent Protection built in, as well TPM and Drive Xpert support. The ESD protection prevents damage to the on-board circuitry due to an electrostatic discharge at that USB ports. The overcurrent protection circuit is somewhat similar, and protects the ports should the current being drawn from them reach a level that could cause an excessive temperature increase. ASUS Data Guardian ofers support for trusted plafrom modules (TPM), and Drive Xpert is an included tool for backing up data. Finally, the board also features Asus' EPU technology, which is designed to improve power consumption and efficiency.
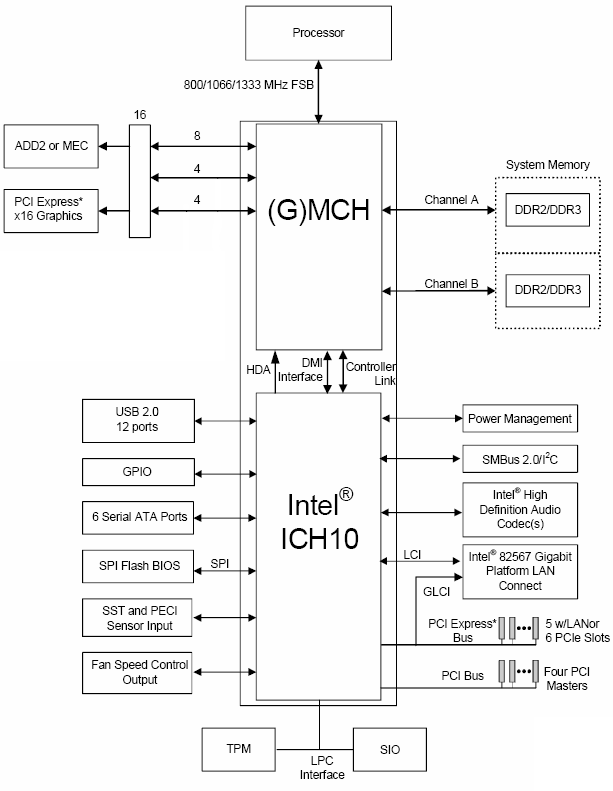
P45 Chipset High-Level Overview
As we've mentioned, the P45 chipset is manufactured using Intel's 65nm process node. The chipset can support either DDR2 or DDr memory technologies and 800MHz - 1.33GHz Front Side Bus frequencies, although a 1.6GHz FSB will be unofficially supported by many P45 motherboards. DDR3 memory speeds of up to DDR3-1333 and DDR2 speed of up to DDR2-1066 are officially supported, but once again, higher speeds are attainable through overclocking.
The ICH10 southbridge supports 6 SATA ports, 12 USB 2.0 ports, HD audio, and Intel 82567 Gigabit LAN. The Asus P5Q Deluxe, however, features the ICH10R, which also adds support for Intel Matrix RAID storage technology. Notice, there is no legacy PATA or LPT support here.